
PUBLISHER: TeleGeography | PRODUCT CODE: 940586

PUBLISHER: TeleGeography | PRODUCT CODE: 940586
Ethernet Over MPLS - Network Pricing Database
Please contact us using the inquiry form for pricing information.
This database presents information on prices connected to Layer 2, point-to-point Ethernet Private Line transport service delivered over an MPLS mesh. Need prices on that? You've come to the right place.
SAMPLE VIEW
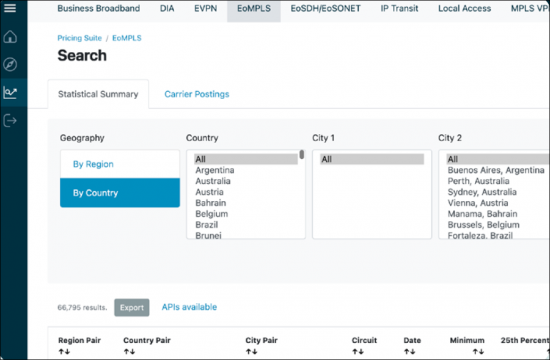
About Our Data
TeleGeography directly surveys facilities-based service providers that offer point-to-point Ethernet over MPLS (EoMPLS) service. Carriers complete a matrix of available routes and capacities and indicate the non-recurring installation fees and monthly recurring charges. Capacities range between 2 Mbps and 1 Gbps.
EoMPLS pricing is reported at the individual carrier price quote level by route and circuit capacity. Individual providers remain anonymous in the carrier postings, but are identified by a three-letter code throughout the data set.
A statistical price summary is also reported for each route and circuit capacity. The statistical summary is comprised of the minimum, median, average, and maximum of all prices recorded for each route and capacity combination within each quarter.
Currently, there are more than 150 routes in the database that are actively tracked. Users can locate prices for connections to Africa, Asia-Pacific, Europe, North America, Central America, and South America.
Subscribers to this module also gain access to bi-monthly Bandwidth Pricing Reports. Each report provides analysis for a particular region or topic. Reports are based on pricing data located in the database, as well as other relevant TeleGeography transport pricing modules.
Using This App
- City Pair Searches: Because EoMPLS is tracked on a route basis, as opposed to a city basis, our search tool allows the user to input two cities to find desired price points.
- City Pair Charts: When it comes to charting, users select explicit routes, circuit, and the desired statistic to track. Our charting tools do the rest of the work. (Plotted something important? You can download all of your charts as PNG files.)


Please contact us using the inquiry form for pricing information.