
PUBLISHER: Juniper Research Ltd | PRODUCT CODE: 1415812

PUBLISHER: Juniper Research Ltd | PRODUCT CODE: 1415812
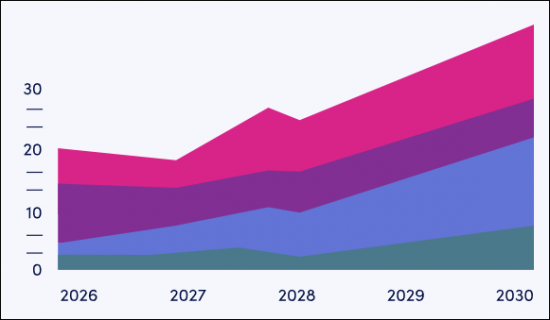
Global Buy Now, Pay Later Market: 2024-2028
| KEY STATISTICS | |
|---|---|
| Total BNPL transaction value in 2024: | $334bn |
| Total BNPL transaction value in 2028: | $687bn |
| 2024 to 2028 market growth: | 105% |
| Forecast period: | 2023-2028 |
Overview
Our “Buy Now Pay Later” research suite provides a detailed and insightful analysis of this evolving market, enabling stakeholders from banks, payment service providers, regulators, and technology vendors to understand future growth, key trends, and the competitive environment.
The suite includes several different options that can be purchased separately, including access to data mapping the adoption and future growth of BNPL, an insightful study uncovering the latest trends and opportunities within the market, and document containing extensive analysis of the 18 market leaders in the BNPL space. The coverage can also be purchased as a Full Research Suite, containing all these elements, and including a substantial discount.
Collectively, they provide a critical tool for understanding this rapidly emerging market, allowing relevant BNPL-related vendors to shape their future strategy. Its unparalleled coverage makes this research suite an incredibly useful resource for charting the future of such an uncertain and rapidly growing market.
Key Features
- Market Dynamics: The report provides a comprehensive market assessment discussing key market trends impacting the effectiveness and value proposition of the BNPL market, as well as an in-depth evaluation of the future growth of the market and readiness for further disruption. This enables readers to understand the critical innovations and develop market opportunities.
- Key Takeaways & Strategic Recommendations: In-depth analysis of key development opportunities and key findings within the BNPL market, accompanied by key strategic recommendations for stakeholders.
- Benchmark Industry Forecasts: The business overview into financial service providers includes forecasts for total revenue for BNPL, split by digital BNPL and flexible credit, and further splits between mobile and online transactions and usage.
- Juniper Research Competitor Leaderboard: Key player capability and capacity assessment for 18 BNPL vendors, via the Juniper Research Competitor Leaderboard, featuring banking market size for major players in the banking industry.
SAMPLE VIEW
Market Trends & Strategies Report
A comprehensive analysis of the current market landscape, alongside strategic recommendations.
Market Data & Forecasting Report
This industry-leading research suite for the “Buy Now Pay Later” market includes access to the full set of forecast data of 81 tables and over 36,900 datapoints. Metrics in the research suite include:
- Total Number of BNPL Users
- Total Volume of BNPL Transactions
- Total Spend via BNPL
- Total BNPL Platform Revenue
Juniper Research Interactive Forecast Excel contains the following functionality:
- Statistics Analysis: Users benefit from the ability to search for specific metrics, displayed for all regions and countries across the data period. Graphs are easily modified and can be exported to the clipboard.
- Country Data Tool: This tool lets users look at metrics for all regions and countries in the forecast period. Users can refine the metrics displayed via a search bar.
- Country Comparison Tool: Users can select countries and compare each of them for specific country data. The ability to export graphs is included in this tool.
- What-if Analysis: Here, users can compare forecast metrics against their own assumptions, including 5 interactive scenarios.
Market Trends & Strategies Report
Juniper Research's new “Buy Now Pay Later” research suite assesses the market in detail, examining the key trends shaping the market , as well as the opportunities and challenges this presents.
This report delivers comprehensive analysis of the strategic opportunities for BNPL vendors; addressing key trends and developing challenges, and how stakeholders should navigate them. The report also includes an analysis of the key BNPL providers in the market, including how banks, superapps, and credit card networks have adapted to the market, and what unique offerings they provide compared to the fintech contemporaries.
Finally, a further segment analysis assessing the current state of play, and future outlook, present across six major BNPL segments; retail, eCommerce, B2B, travel, healthcare, and utilities, is featured.
Competitor Leaderboard Report
Juniper Research's Competitor Leaderboard for BNPL vendors features detailed evaluation and market positioning for 18 leading vendors in the “Buy Now Pay Later” market. The vendors are positioned either as an established leader, leading challenger or disruptor and challenger, based on capacity and capability assessments. These vendors include:
|
|
This document is centred around the Juniper Research Competitor Leaderboard, a vendor positioning tool that provides an at a glance view of the competitive landscape in a market, backed by a robust methodology.
Table of Contents
1. Market Trends & Strategies
1. Key Takeaways & Strategic Recommendations
- 1.1 Key Takeaways
- 1.2. Strategic Recommendations
2. Market Landscape
- 2.1. Introduction
- 2.1.1. History of BNPL
- Figure 2.1: Buy Now, Pay Later Timeline
- 2.1.1. History of BNPL
- 2.2. BNPL Landscape
- Figure 2.2: Total Value of Digital BNPL Transactions ($m) Split by Key Regions, 2023
- 2.3. Digital BNPL
- 2.3.1. Digital BNPL in Retail & eCommerce
- 2.4 Key Trends & Drivers
- 2.5. BNPL vs Credit
- 2.5.1. BNPL
- i. Strengths
- ii. Weaknesses
- 2.5.2. Credit
- i. Strengths
- Figure 2.3: Proportion of Individuals that Own a Credit Card, Split by Top Countries (2021)
- ii. Weaknesses
- i. Strengths
- 2.5.1. BNPL
- 2.6. Challenges
3. Segment Analysis
- 3.1. Introduction
- 3.2. Retail & eCommerce
- 3.3. B2B
- 3.4. Healthcare
- 3.5. Travel
- Figure 3.1: Cart Abandonment Rates Across Industries, 2020
- 3.6. Utilities
4. Player Analysis
- 4.1. Introduction
- 4.2. Card Networks
- 4.3. Superapps
- 4.4. Banks
5. Country Readiness Index & Regional Analysis
- 5.1. Introduction
- 5.2. BNPL Country Readiness Index
- Figure 5.1: Juniper Research's 8 Key Regions Definition
- Table 5.2: Juniper Research Buy Now Pay Later Country Readiness Index: Scoring Criteria
- Figure 5.3: Juniper Research Country Readiness Index - Buy Now Pay Later
- Figure 5.4: Juniper Research's Competitive Web: Buy Now Pay Later Regional Opportunities
- 5.3. Regional Analysis
- 5.3.1. North America
- Figure 5.5: Total Digital BNPL Transaction Volume (m) in North America, Split by 2 Select Countries, 2023-2028
- i. US
- ii. Canada
- 5.3.2. Latin America
- Figure 5.6: Total BNPL Transaction Volume (m) in Latin America, Split by 8 Select Countries, 2023
- i. Mexico
- 5.3.3. West Europe
- Figure 5.7: Total BNPL Transaction Volume (m) in West Europe, Split by 16 Select Countries, 2023
- i. Sweden
- ii. UK
- iii. Germany
- iv. Belgium
- v. Denmark
- 5.3.4. Central & East Europe
- Figure 5.8: Total Digital BNPL Transaction Volume (m) in Central & East Europe, 2023-2028
- i. Poland
- 5.3.5. Far East & China
- Figure 5.9: Total Digital BNPL Transaction Volume (m) in Far East & China, Split by 4 Select Countries, 2023
- i. China
- ii. Japan
- 5.3.6. Indian Subcontinent
- Figure 5.10: Total Digital BNPL Transaction Volume (m) in Indian Subcontinent, Split by 4 Select Countries, 2023-2028
- i. India
- 5.3.7. Rest of Asia Pacific
- Figure 5.11: BNPL Transaction Volume (m) in Rest of Asia Pacific, Split by Country, 2023
- i.Australia
- ii. New Zealand
- iii. Singapore
- 5.3.8. Africa & Middle East
- Figure 5.12: Total Digital BNPL Transaction Volume (m) in Africa & Middle East, 2023-2028
- i. UAE
- ii. Saudi Arabia
- iii. South Africa
- 5.3.1. North America
- 5.4. Country Readiness Index Heatmaps
- Table 5.13: Juniper Research's Country Readiness Index: North America
- Table 5.14: Juniper Research's Country Readiness Index: Latin America
- Table 5.15: Juniper Research's Country Readiness Index: West Europe
- Table 5.16: Juniper Research's Country Readiness Index: Central & East Europe
- Table 5.17: Juniper Research's Country Readiness Index: Far East & China
- Table 5.18: Juniper Research's Country Readiness Index: Indian Subcontinent
- Table 5.19: Juniper Research's Country Readiness Index: Rest of Asia Pacific
- Table 5.20: Juniper Research's Country Readiness Index: Africa & Middle East
2. Competitor Leaderboard
1. BNPL Competitor Leaderboard
- 1.1. Why Read This Report?
- Table 1.1: Juniper Research Competitor Leaderboard: Buy Now, Pay Later Vendors Included & Product Portfolio
- Figure 1.2: Juniper Research Competitor Leaderboard for Buy Now. Pay Later
- Table 1.3: Juniper Research Competitor Leaderboard: BNPL Vendors & Positioning
- Table 1.4: Juniper Research Buy Now Pay Later Competitor Leaderboard Heatmap
- 1.2. Vendor Profiles
- 1.2.1. Affirm
- i. Corporate
- ii. Geographic Spread
- iii. Key Clients & Strategic Partnerships
- iv. High-level View of Offerings
- v. Juniper Research's View: Key Strengths & Strategic Development Opportunities
- 1.2.2. Afterpay
- i. Corporate
- ii. Geographic Spread
- iii. Key Clients & Strategic Partnerships
- iv. High-level View of Offerings
- v. Juniper Research's View: Key Strengths & Strategic Development Opportunities
- 1.2.3. Apple Pay Later
- i. Corporate
- ii. Geographic Spread
- iii. Key Clients & Strategic Partnerships
- iv. High-level View of Offerings
- v. Juniper Research's View: Key Strengths & Strategic Development Opportunities
- 1.2.4. Credi2
- i. Corporate
- ii. Geographic Spread
- iii. Key Clients & Strategic Partnerships
- iv. High-level View of Offerings
- v. Juniper Research's View: Key Strengths & Strategic Development Opportunities
- 1.2.5. Grab
- i. Corporate
- ii. Geographic Spread
- iii. Key Clients & Strategic Partnerships
- iv. High-level View of Offerings
- v. Juniper Research's View: Key Strengths & Strategic Development Opportunities
- 1.2.6. humm
- i. Corporate
- ii. Geographic Spread
- iii. Key Clients & Strategic Partnerships
- iv. High-level View of Offerings
- v. Juniper Research's View: Key Strengths & Strategic Development Opportunities
- 1.2.7. Klarna
- i. Corporate
- ii. Geographic Spread
- iii. Key Clients & Strategic Partnerships
- iv. High-level View of Offerings
- v. Juniper Research's View: Key Strengths & Strategic Development Opportunities
- 1.2.8. Kredivo
- i. Corporate
- ii. Geographic Spread
- iii. Key Clients & Strategic Partnerships
- iv. High-level View of Offerings
- v. Juniper Research's View: Key Strengths & Strategic Development Opportunities
- 1.2.9. Laybuy
- i. Corporate
- ii. Geographic Spread
- iii. Key Clients & Strategic Partnerships
- iv. High-level View of Offerings
- v. Juniper Research's View: Key Strengths & Strategic Development Opportunities
- 1.2.10. Payl8r
- i. Corporate
- ii. Geographic Spread
- iii. Key Clients & Strategic Partnerships
- iv. High-level View of Offerings
- v. Juniper Research's View: Key Strengths & Strategic Development Opportunities
- 1.2.11. PayPal
- i. Corporate
- ii. Geographic Spread
- iii. Key Clients & Strategic Partnerships
- iv. High-level View of Offerings
- v. Juniper Research's View: Key Strengths & Strategic Development Opportunities
- 1.2.12. Perpay
- i. Corporate
- ii. Geographic Spread
- iii. Key Clients & Strategic Partnerships
- iv. High-level View of Offerings
- v. Juniper Research's View: Key Strengths & Strategic Development Opportunities
- 1.2.13. Scalapay
- i. Corporate
- ii. Geographic Spread
- iii. Key Clients & Strategic Partnerships
- iv. High-level View of Offerings
- v. Juniper Research's View: Key Strengths & Strategic Development Opportunities
- 1.2.14. Sezzle
- i. Corporate
- ii. Geographic Spread
- iii. Key Clients & Strategic Partnerships
- iv. High-level View of Offerings
- v. Juniper Research's View: Key Strengths & Strategic Development Opportunities
- 1.2.15. Simpl
- i. Corporate
- ii. Geographic Spread
- iii. Key Clients & Strategic Partnerships
- iv. High-level View of Offerings
- v. Juniper Research's View Key Strengths & Strategic Development Opportunities
- 1.2.16. Splitit
- i. Corporate
- ii. Geographic Spread
- iii. Key Clients & Strategic Partnerships
- iv. High-level View of Offerings
- v. Juniper Research's View: Key Strengths & Strategic Development Opportunities
- 1.2.17. Tabby
- i. Corporate
- ii. Geographic Spread
- iii. Key Clients & Strategic Partnerships
- iv. High-level View of Offerings
- v. Juniper Research's View: Key Strengths & Strategic Development Opportunities
- 1.2.18. Zip
- i. Corporate
- ii. Geographic Spread
- iii. Key Clients & Strategic Partnerships
- iv. High-level View of Offerings
- v. Juniper Research's View: Key Strengths & Strategic Development Opportunities
- 1.2.1. Affirm
- 1.3. Juniper Research Leaderboard Assessment Methodology
- 1.3.1. Limitations & Interpretations
- Table 1.5: Juniper Research Competitor Leaderboard Scoring Criteria - Buy Now, Pay Later
- 1.3.1. Limitations & Interpretations
3. Data & Forecasting
1. Market Overview
- 1.1. Introduction
- 1.1.1. Methodology & Assumptions
- Figure 1.1: Buy Now, Pay Later Forecast Methodology
- 1.1.1. Methodology & Assumptions
- 1.2. Forecast Summary
- 1.2.1. Total Digital BNPL and Flexible Credit Unique Users
- Figure & Table 1.2: Total Digital BNPL and Flexible Credit Unique Users (m) Split by Key Regions, 2023-2028
- 1.2.2. Total Volume of Digital BNPL and Flexible Credit Transactions
- Figure & Table 1.3: Total Volume of Digital BNPL and Flexible Credit Transactions (m) Split by Key Regions, 2023-2028
- 1.2.3. Total Digital BNPL and Flexible Credit Transaction Value
- Figure & Table 1.4: Total Digital BNPL and Flexible Credit transaction Value ($m) Split by Key Regions, 2023-2028
- 1.2.4. Total Digital BNPL and Flexible Credit Platform Revenue
- Figure & Table 1.5: Total Digital BNPL and Flexible Credit Platform Revenue ($m) Split by Key Regions, 2023-2028
- 1.2.1. Total Digital BNPL and Flexible Credit Unique Users
2. Digital BNPL: Market Forecasts
- 2.1. Digital BNPL Unique Users
- Figure & Table 2.1: Total Unique Digital BNPL Users (m) split by Key Regions, 2023-2028
- 2.2. Digital BNPL Mobile Users
- Figure & Table 2.2: Total Digital BNPL Mobile Users (m) Split by Key Regions, 2023-2028
- 2.3. Digital BNPL Online Users
- Figure & Table 2.3: Total Digital BNPL Online Users (m) Split by Key Regions, 2023-2028
- 2.4. Total Volume of Digital BNPL Transactions
- Figure & Table 2.4: Total Volume of Digital BNPL Transactions, Split by Key Regions, 2023-2028
- 2.5. Total Digital BNPL Transaction Value
- Figure & Table 2.5: Total Digital BNPL Transaction Value ($m) Split by Key Regions, 2023-2028
- 2.6. Digital BNPL Platform Revenue
- Figure & Table 2.6: Total Digital BNPL Platform Revenue ($m) Split by Key Regions, 2023-2028
3. Flexible Credit: Market Forecasts
- 3.1. Flexible Credit Unique Users
- Figure & Table 3.1: Total Volume of Flexible Credit Users (m) Split by Key Regions, 2023-2028
- 3.2. Flexible Credit Mobile Users
- Figure & Table 3.2: Total Volume of Flexible Credit Mobile Users (m) Split by Key Regions, 2023-2028
- 3.3. Flexible Credit Online Users
- Figure & Table 3.3: Total Flexible Credit Online Users (m) Split by Key Regions, 2023-2028
- 3.4. Total Volume of Flexible Credit Transactions
- Figure & Table 3.4: Total Volume of Flexible Credit Transactions (m) Split by Key Regions, 2023-2028
- 3.5. Total Flexible Credit Transaction Value
- Figure & Table 3.5: Total Flexible Credit Transaction Value ($m) Split by Key Regions, 2023-2028
- 3.6. Flexible Credit Platform Revenue
- Figure & Table 3.6: Total Flexible Credit Platform Revenue ($m) Split by Key Regions, 2023-2028
4. B2B BNPL Market
- 4.1. Number of Businesses Utilising B2B BNPL
- Figure & Table 4.1: Total Number of Businesses Utilising B2B BNPL (m) Split by Key Regions, 2023-2028
- 4.2. Average Number of Transactions per Business using B2B BNPL
- Figure & Table 4.2: Average Number of Transactions per Business Using B2B BNPL (Year End) Split by Key Regions, 2023-2028
- 4.3. Total Number of B2B BNPL Transactions
- Figure & Table 4.3: Total Volume of B2B BNPL Transactions (m) Split by Key Regions, 2023-2028
- 4.4. Average Spend per B2B BNPL Transaction
- Figure & Table 4.4: Average Spend per B2B BNPL Transaction ($) Split by Key Regions, 2023-2028
- 4.5. Total B2B BNPL Transaction Value
- Figure & Table 4.5: Total B2B BNPL Transaction Value ($m) Split by Key Regions, 2023-2028
- 4.6. Total B2B BNPL Platform Revenue ($m)
- Figure & Table 4.62: Total B2B BNPL Platform Revenue ($m) Split by Key Regions, 2023-2028

