
PUBLISHER: Mordor Intelligence | PRODUCT CODE: 1849877

PUBLISHER: Mordor Intelligence | PRODUCT CODE: 1849877
Rare Earth Elements - Market Share Analysis, Industry Trends & Statistics, Growth Forecasts (2025 - 2030)
The rare earth metals market stood at 196.63 kilotons in 2025 and is projected to reach 260.36 kilotons by 2030, expanding at a 5.80% CAGR over the forecast period.
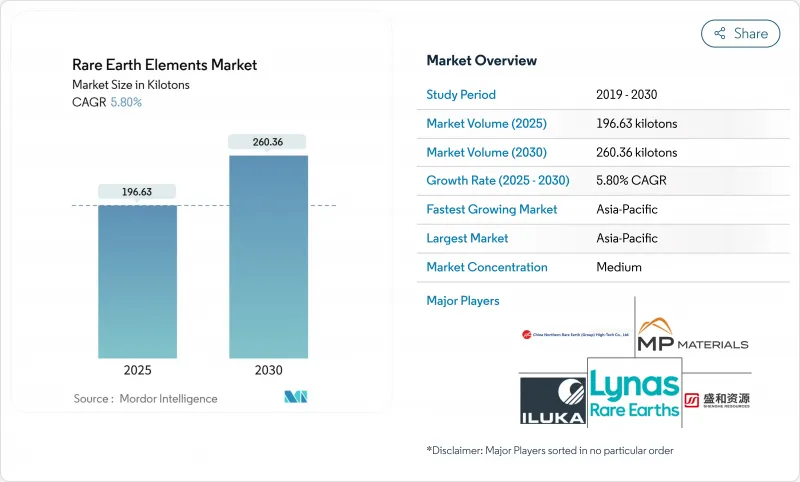
Robust demand from clean-energy technologies, consumer devices, and defense platforms continues to lift volumes, while the rapid scale-up of electric vehicles (EVs) threatens to outstrip current neodymium and praseodymium production by 2036 if new capacity or large-scale recycling fails to materialize. Asia-Pacific remains the production and processing hub, anchored by China's dominant position, yet policy support in the United States, Canada, and the European Union is opening investment pathways that could reduce concentration risk. Magnet applications post the strongest growth because high-performance NdFeB magnets are indispensable in EV traction motors and direct-drive wind turbines, giving this segment an 8.02% forecast CAGR. Mounting geopolitical friction is prompting Western governments to subsidize domestic projects; the U.S. Department of Defense alone has committed more than USD 439 million since 2020 to shore up supply chains.
Global Rare Earth Elements Market Trends and Insights
High Demand from Emerging Economies
Emerging markets are lifting consumption as governments accelerate industrialization and renewable-energy deployment. China increased export volumes in 2024 despite slower domestic use, masking tightening long-term supply. India intends to triple refined output by 2032 through Indian Rare Earths Limited, lowering import dependency and bolstering regional self-reliance. African nations collectively aim to deliver 9% of global supply by 2029, adding new low-cost tonnage that could temper price spikes. These supply-side moves are coupled with demand growth from regional EV, electronics, and wind-turbine assembly plants. The resulting realignment lessens single-country concentration yet raises integration hurdles for downstream users.
Dependency of Green Technology on Rare Earth Elements
Wind turbines, EV traction motors, and energy-efficient lighting require large volumes of neodymium, praseodymium, dysprosium, and terbium. The European Commission projects demand to rise 4.5 to 5.5 times by 2030 and 2050, respectively. Each offshore wind turbine contains kilograms of NdFeB magnets that deliver high torque at low rotational speeds. Recycling breakthroughs are gaining traction; Cyclic Materials attracted investment from Microsoft's Climate Innovation Fund to scale a process that recovers up to 85% of rare earths from discarded hard drives. Successful commercialization of closed-loop flows will cushion raw-material risk and loosen China's grip on supply over the long term.
High Capex & Radioactive Waste-Management Costs for Separation Facilities
Building a standalone separation and oxide refinery demands specialized solvent-extraction circuits and containment systems for thorium- and uranium-bearing residues. These requirements raise operating costs by 15-20%, deterring first-movers outside China. Research groups in Guangzhou demonstrated an electrokinetic mining technique that delivers 95% recovery and cuts ammonia emissions by 95%, offering a viable pathway to comply with stricter Western environmental rules. Mobilizing sufficient funding and de-risking the technology at commercial scale remain near-term hurdles for non-Chinese operators.
Other drivers and restraints analyzed in the detailed report include:
- Rapid Penetration of Permanent-Magnet EV Motors across Asia
- Scandium-Aluminum Alloys Adoption in Aerospace Manufacturing
- Price Volatility Linked to Chinese Policy Shifts
For complete list of drivers and restraints, kindly check the Table Of Contents.
Segment Analysis
Light rare earths, supplied 80% of global tonnage in 2024 because of their relative abundance and lower mining costs. The rare earth metals market size for light REEs is projected to expand at 5.98% CAGR to 2030, driven by polishing powders, FCC catalysts, and NdFeB magnet feedstock. Recycling programs in Europe and North America are beginning to divert waste streams, creating secondary feed that mildly tempers virgin-ore growth. Heavy rare earths such as dysprosium, terbium, and yttrium deliver higher unit value but face geological scarcity. Ongoing pilot trials in electrokinetic leaching show 95% recovery with 60% lower power use, potentially narrowing production-cost gaps between product types and reshaping long-term supply economics.
Second-order effects from EV demand, wind-energy roll-outs, and defense procurement maintain strong price signals for both classes. Yet project financing remains skewed toward light REE deposits because of easier metallurgy and shorter ramp-up timelines. Heavy-REE output is expected to track specialty demand in high-temperature magnets, laser crystals, and phosphors, supporting a balanced revenue mix across the rare earth metals market.
Cerium controlled a 40% share in 2024 on the back of glass-polishing powders and autocatalyst use. Experimentation at HSE University produced tunable yellow luminescence, opening potential lighting and display applications that could broaden cerium's addressable market. Neodymium registers the fastest growth at 9.20% CAGR as EV traction motors and turbo-generators soak up magnet alloy feed. MP Materials began commercial NdPr metal pours at its Texas facility in January 2025, an essential milestone in rebuilding the United States' mine-to-magnet supply chain.
Terbium and dysprosium enjoy stable demand in high-coercivity magnets for offshore wind and defense gear, yet output is constrained by metallurgical complexity. Scandium's profile is rising; Rusal expects to initiate scandium oxide production in 2025, lowering the input cost of aerospace-grade Al-Sc alloys and accelerating adoption in commercial aircraft. Altogether, diversified element uptake underpins a resilient revenue structure for the rare earth metals market.
The Rare Earth Metals Market Report Segments the Industry by Product Type (Light Rare Earth Elements and Heavy Rare Earth Elements), Element (Cerium, Neodymium, and More), Application (Catalysts, Ceramics, and More), End-Use Industry (Clean Energy, Consumer Electronics, and More), and Geography (Asia-Pacific, North America, Europe, South America, Middle East and Africa). The Market Forecasts are Provided in Terms of Volume (tons).
Geography Analysis
Asia-Pacific produced 86% of global output in 2024, anchored by China's integrated mining, separation, and magnet manufacturing complex. The region is forecast to grow at 5.92% CAGR to 2030 on relentless EV and consumer-electronics capacity expansions. Japan and South Korea deepen collaboration on shared data platforms for battery and magnet supply chains to increase resilience by 2025.
North America is the significant region as policy incentives compress timelines for new mines, refineries, and magnet plants. The U.S. Department of Defense has dispersed more than USD 439 million since 2020 to strengthen domestic capabilities, and MP Materials' Mountain Pass complex feeds downstream operations in Texas. Canada's critical-minerals roadmap complements U.S. goals by funding exploration and pilot separation hubs, creating an integrated continental value chain.
Europe's Critical Raw Materials Act sets quantitative targets for mining, processing, and recycling by 2030, catalyzing investment in Norwegian, Swedish, and French deposits alongside UK-based recycling ventures. However, greenfield mine approvals remain slow because of permitting hurdles and local opposition. Africa's contribution grows as projects in Burundi, Tanzania, and South Africa progress; the continent could supply 9% of global demand by 2029, diversifying trade flows and reducing single-supplier risk.
- Appia REU
- China Rare Earth Group Resources Technology Co., Ltd.
- China Rare Earth Holdings Limited
- ChinaTungsten
- Energy Fuels Inc.
- Iluka Resources Limited
- Jiangxi Copper Corporation
- Lynas Rare Earths Ltd
- Mitsubishi Corporation RtM Japan Ltd.
- MP Materials
- Northern Minerals
- Northern Rare Earth
- Rio Tinto
- Shenghe Resources Holding Co., Ltd.
- Ucore Rare Metals Inc.
- Yuyan Rare Earth New Materials Co., Ltd.
Additional Benefits:
- The market estimate (ME) sheet in Excel format
- 3 months of analyst support
TABLE OF CONTENTS
1 Introduction
- 1.1 Study Assumptions and Market Definition
- 1.2 Scope of the Study
2 Research Methodology
3 Executive Summary
4 Market Landscape
- 4.1 Market Overview
- 4.2 Market Drivers
- 4.2.1 High Demand from Emerging Economies
- 4.2.2 Dependency of 'Green Technology' on Rare Earth Elements
- 4.2.3 Rapid Penetration of Permanent-Magnet EV Motors across Asia
- 4.2.4 Scandium-Aluminum Alloys Adoption in Aerospace Manufacturing
- 4.2.5 High Demand in Consumer Electronics
- 4.3 Market Restraints
- 4.3.1 High Capex and Radioactive Waste Management Costs for Separation Facilities
- 4.3.2 Price Volatility Linked to Chinese Policy Shifts
- 4.3.3 Inconsistent Supply of Rare Earth Elements
- 4.4 Value Chain Analysis
- 4.5 Porter's Five Forces
- 4.5.1 Bargaining Power of Suppliers
- 4.5.2 Bargaining Power of Consumers
- 4.5.3 Threat of New Entrants
- 4.5.4 Threat of Substitutes
- 4.5.5 Degree of Competition
5 Market Size and Growth Forecasts (Volume)
- 5.1 By Product Type
- 5.1.1 Light Rare Earth Elements
- 5.1.2 Heavy Rare Earth Elements
- 5.2 By Element
- 5.2.1 Cerium
- 5.2.1.1 Oxide
- 5.2.1.2 Sulfide
- 5.2.1.3 Other Compounds
- 5.2.2 Neodymium
- 5.2.2.1 Alloy
- 5.2.3 Lanthanum
- 5.2.3.1 Alloy
- 5.2.3.2 Oxide
- 5.2.3.3 Other Compounds
- 5.2.4 Dysprosium
- 5.2.5 Terbium
- 5.2.6 Yttrium
- 5.2.7 Scandium
- 5.2.8 Other Elements
- 5.2.1 Cerium
- 5.3 By Application
- 5.3.1 Catalysts
- 5.3.2 Ceramics
- 5.3.3 Phosphors
- 5.3.4 Glass and Polishing
- 5.3.5 Metallurgy
- 5.3.6 Magnets
- 5.3.7 Other Applications
- 5.4 By End-use Industry
- 5.4.1 Clean Energy
- 5.4.2 Consumer Electronics
- 5.4.3 Aerospace and Defense
- 5.4.4 Industrial Automation
- 5.4.5 Healthcare
- 5.4.6 Others
- 5.5 By Geography
- 5.5.1 Asia-Pacific
- 5.5.1.1 China
- 5.5.1.2 India
- 5.5.1.3 Japan
- 5.5.1.4 South Korea
- 5.5.1.5 Australia
- 5.5.1.6 Rest of Asia-Pacific
- 5.5.2 North America
- 5.5.2.1 United States
- 5.5.2.2 Canada
- 5.5.2.3 Mexico
- 5.5.3 Europe
- 5.5.3.1 Germany
- 5.5.3.2 United Kingdom
- 5.5.3.3 France
- 5.5.3.4 Italy
- 5.5.3.5 Nordics
- 5.5.3.6 Rest of Europe
- 5.5.4 South America
- 5.5.4.1 Brazil
- 5.5.4.2 Argentina
- 5.5.4.3 Rest of South America
- 5.5.5 Middle East and Africa
- 5.5.5.1 Saudi Arabia
- 5.5.5.2 United Arab Emirates
- 5.5.5.3 South Africa
- 5.5.5.4 Rest of Middle East and Africa
- 5.5.1 Asia-Pacific
6 Competitive Landscape
- 6.1 Market Concentration
- 6.2 Strategic Moves
- 6.3 Market Share Analysis
- 6.4 Company Profiles (includes Global level Overview, Market level overview, Core Segments, Financials as available, Strategic Information, Market Rank/Share for key companies, Products and Services, and Recent Developments)
- 6.4.1 Appia REU
- 6.4.2 China Rare Earth Group Resources Technology Co., Ltd.
- 6.4.3 China Rare Earth Holdings Limited
- 6.4.4 ChinaTungsten
- 6.4.5 Energy Fuels Inc.
- 6.4.6 Iluka Resources Limited
- 6.4.7 Jiangxi Copper Corporation
- 6.4.8 Lynas Rare Earths Ltd
- 6.4.9 Mitsubishi Corporation RtM Japan Ltd.
- 6.4.10 MP Materials
- 6.4.11 Northern Minerals
- 6.4.12 Northern Rare Earth
- 6.4.13 Rio Tinto
- 6.4.14 Shenghe Resources Holding Co., Ltd.
- 6.4.15 Ucore Rare Metals Inc.
- 6.4.16 Yuyan Rare Earth New Materials Co., Ltd.
7 Market Opportunities and Future Outlook
- 7.1 White-space and Unmet-need Assessment

