
PUBLISHER: Mordor Intelligence | PRODUCT CODE: 1851186

PUBLISHER: Mordor Intelligence | PRODUCT CODE: 1851186
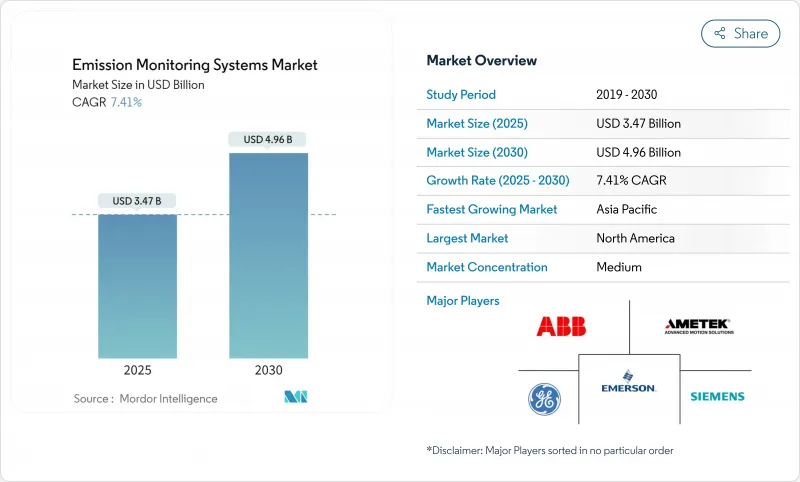
Emission Monitoring Systems - Market Share Analysis, Industry Trends & Statistics, Growth Forecasts (2025 - 2030)
The emission monitoring systems market is valued at USD 3.47 billion in 2025 and is forecast to reach USD 4.96 billion by 2030, advancing at a 7.41% CAGR.
Stricter air-pollution rules and the direct monetization of carbon under the EU Emissions Trading System Phase IV are raising demand for higher-accuracy stack monitors, while the shift toward hybrid continuous-predictive architectures is redefining vendor strategies. Hardware still generates the largest revenue stream, holding 46% of 2024 sales, yet services are expanding fastest at a 7.7% CAGR as users seek calibration, certification, and data-management support. North America leads in installed base, but Asia Pacific records the highest 10% regional growth as China and India impose new plant-level limits. In-situ laser analyzers, particularly TDLS, are rapidly displacing extractive systems in waste-to-energy plants, lowering lifecycle outlays by roughly 30%. Simultaneously, AI-enabled software modules are turning compliance data into predictive-maintenance and process-optimization tools that trim operating costs by 15-20%.
Global Emission Monitoring Systems Market Trends and Insights
Transition from CAPEX-heavy CEMS to Hybrid CEMS-PEMS Architectures
Hybrid configurations blend direct readings from CEMS hardware with software-based emission models, lowering upfront expenditure by 25-30% while keeping error rates below 3% against reference instruments. Early adopters in U.S. refineries and combined-cycle gas plants now treat predictive modules as a compliance-accepted alternative for secondary pollutants after U.S. EPA approval. Global platform vendors embed machine-learning algorithms that auto-calibrate models in real time, shrinking validation cycles. As cloud hosting removes local IT overhead, software pricing is falling, opening the hybrid option to mid-sized facilities. Analysts expect this configuration to represent roughly one-quarter of all new emission monitoring systems market installations by 2027.
Mandatory EU-ETS Phase IV Carbon Pricing Driving Stack-Level Monitoring
Allowance prices above EUR 80 per tonne in 2025 have turned emissions data into a line-item financial variable. Operators in power, cement, and waste management have added high-precision analyzers that improve accuracy by 2-3 percentage points versus prior models, minimizing over-purchasing of carbon credits. Expansion of scope to maritime and small industrial sites has boosted new system orders across Eastern Europe, where installations jumped 35% since 2023. Plants now integrate monitors directly with process-control loops to throttle output against live carbon costs. Vendors able to pair monitoring hardware with automated trading dashboards have gained share in the emission monitoring systems market.
Scarcity of TUV & MCERTS-Certified Technicians Delaying European Commissioning
Compliance in Europe obliges on-site audits by technicians accredited under TUV or MCERTS frameworks. A 40% workforce shortfall has extended average project start-ups by up to six months, particularly in Poland, Romania, and Bulgaria. Hourly service rates have escalated 25-30% since 2023, pushing users toward vendors with in-house service arms. OEMs respond with remote-assistance toolkits that guide local staff through calibration sequences via augmented-reality headsets. Despite these work-arounds, the technician bottleneck trims near-term growth for the emission monitoring systems market until training pipelines expand.
Other drivers and restraints analyzed in the detailed report include:
- Inflation Reduction Act Tax-Credit Verification Creating Surge in U.S. Power-Plant CEMS Retrofits
- In-situ Laser-Based Sensors Cutting Lifecycle Cost by 30% in APAC Waste-to-Energy Plants
- Legacy DCS-DAQ Inter-operability Gaps Inflating Retrofit Costs in U.S. Utilities
For complete list of drivers and restraints, kindly check the Table Of Contents.
Segment Analysis
The segment opened 2024 with CEMS owning 71% of revenue thanks to universal regulatory acceptance. However, PEMS is outpacing at an 8.4% CAGR as cloud compute charges fall and regulators endorse predictive algorithms. The emission monitoring systems market size linked to hybrid deployments is projected to cross USD 1 billion by 2027, reflecting steadily rising adoption where processes run under steady-state conditions. Oil refineries, gas turbines, and petrochemical crackers see tight correlations between temperature, O2, and pollutant outputs, making them prime candidates. Vendors that package turnkey data-science support gain leverage, because many plant engineers lack modeling expertise. Incremental software subscriptions also give suppliers annuity revenue, shifting away from lumpy hardware sales.
CEMS remains irreplaceable for primary pollutants such as SO2 and particulate matter where laws demand direct readings. As a result, hybrid configurations that pair a compact analyzer for critical gases with PEMS for secondary streams dominate new bids. The approach lets operators balance compliance rigor and budget, preserving CEMS integrity while harvesting PEMS cost savings. Within this model, the emission monitoring systems market share of pure predictive installations is unlikely to top 10% by 2030, yet hybrid value will mount steadily as AI tools improve and field data builds confidence.
Gas analyzers, flow sensors, and probes generated 46% of global turnover in 2024, led by multi-component FTIR and TDLS instruments that command premium pricing in cement, steel, and waste-to-energy. Nevertheless, recurring service contracts-calibration, certification, and data validation-now advance at a 7.7% CAGR. New trading schemes such as national carbon markets in Canada and South Korea raise the stakes for data accuracy, prompting annual or semi-annual audits. End-users lacking internal metrology teams outsource compliance assurance, making service specialists pivotal across the emission monitoring systems market.
Cloud-native software modules add another growth lever. Suppliers bundle automated compliance reports that map directly to EU or EPA templates, cutting administrative workload. Subscription revenue is rising 18% annually, reshaping financial models. Some OEMs have introduced emissions-monitoring-as-a-service plans that combine hardware leases with full-scope maintenance, smoothing customer cash out-flows. This recurring model should gradually dilute lump-sum hardware dependence and diversify income streams in the emission monitoring systems industry.
The Emission Monitoring Market Report is Segmented by System Type (Continuous Emission Monitoring Systems (CEMS), and Predictive Emission Monitoring Systems (PEMS)), Component (Hardware, Software, and Services), Monitoring Technology (Extractive, Dilution, and In-Situ), End-User Industry (Power Generation, Oil and Gas, Metals and Mining, and More), and Geography. The Market Forecasts are Provided in Terms of Value (USD).
Geography Analysis
North America headed the 2024 rankings with 39% revenue, anchored by roughly 15,000 installed CEMS units across power and refining. Inflation Reduction Act incentives prompt utilities to modernize analyzers, while Canada's output-based pricing system spreads monitoring into mid-size manufacturing. Retrofit projects dominate order books because many units installed before 2015 reach end-of-life. Integration with cloud dashboards that link compliance data to maintenance planning is now standard practice, and this digital overlay influences most competitive bids.
Asia Pacific is the fastest-growing region at a 10% CAGR. China's 14th Five-Year Plan compels around 80,000 plants to install monitors, often leapfrogging directly to in-situ lasers. India's National Clean Air Programme mandates continuous stacks at more than 200 coal stations by 2026, compressing buying cycles. Advanced analyzer vendors partner with local system integrators to navigate procurement rules and service coverage gaps. Japan and South Korea already operate mature fleets but continue to upgrade to TDLS and quantum-cascade platforms, especially in waste-to-energy. Southeast Asia mirrors Chinese standards; Vietnam and Indonesia published guidelines modeled on GB standards in 2024, widening the install base for the emission monitoring systems market.
Europe represents 25% of global value, uniquely shaped by carbon-price exposure under the EU-ETS, which elevates data-quality requirements. Eastern-member expansion drives first-install volumes, while Western-EU users focus on uptime and cost-of-ownership gains. Service revenue is proportionally higher because annual calibrations and parallel-sampling tests are mandatory. The Middle East and Africa are nascent but promising: Saudi Arabia's Vision 2030 ties emissions targets to industrial diversification, and South Africa's carbon tax accelerates monitoring adoption in mining and power. Harsh-environment resilience-high dust, heat, and salinity-forms a technical differentiator for vendors chasing these frontier opportunities
- ABB Ltd.
- Siemens AG
- Emerson Electric Co.
- Thermo Fisher Scientific Inc.
- AMETEK Inc.
- Honeywell International Inc.
- Teledyne Technologies Inc.
- HORIBA Ltd.
- SICK AG
- Rockwell Automation Inc.
- General Electric Company
- Fuji Electric Co. Ltd.
- Advanced Emissions Solutions Inc.
- ENVEA Global SAS
- Parker Hannifin Corp.
- Baker Hughes Co.
- Cemtrex Inc.
- Babcock and Wilcox Enterprises Inc.
- Opsis AB
- Altech Environment U.S.A.
Additional Benefits:
- The market estimate (ME) sheet in Excel format
- 3 months of analyst support
TABLE OF CONTENTS
1 INTRODUCTION
- 1.1 Study Assumptions and Market Definition
- 1.2 Scope of the Study
2 RESEARCH METHODOLOGY
3 EXECUTIVE SUMMARY
4 MARKET LANDSCAPE
- 4.1 Market Overview
- 4.2 Market Drivers
- 4.2.1 Transition from CAPEX-heavy CEMS to Hybrid CEMS-PEMS Architectures in Europe
- 4.2.2 Mandatory EU-ETS Phase-IV Carbon Pricing Driving Stack-Level Monitoring (Europe)
- 4.2.3 Inflation Reduction Act Tax-Credit Verification Creating Surge in United States Power-Plant CEMS Retrofits
- 4.2.4 In-situ Laser-Based Sensors Cutting Lifecycle Cost by 30 % in Asia-Pacific Waste-to-Energy Plants
- 4.2.5 National Clean Air Programme Accelerating Coal-Fired CEMS Roll-outs (India)
- 4.2.6 IMO 2023 EEXI and CII Rules Triggering Ship-board SEMS Installations (Global Maritime)
- 4.3 Market Restraints
- 4.3.1 Scarcity of TUV and MCERTS-Certified Technicians Delaying European Commissioning
- 4.3.2 High Humidity Bias in Tropical Regions Raising False-Compliance Risk
- 4.3.3 Legacy DCS-DAQ Inter-operability Gaps Inflating Retrofit Costs in United States Utilities
- 4.3.4 Capital Lock-In from Long-Term CEMS Leasing Models Hindering PEMS Adoption (MEA)
- 4.4 Industry Ecosystem Analysis
- 4.5 Technological Outlook
- 4.6 Porter's Five Forces Analysis
- 4.6.1 Bargaining Power of Suppliers
- 4.6.2 Bargaining Power of Buyers
- 4.6.3 Threat of New Entrants
- 4.6.4 Threat of Substitutes
- 4.6.5 Intensity of Competitive Rivalry
5 MARKET SIZE AND GROWTH FORECASTS (VALUES)
- 5.1 By System Type
- 5.1.1 Continuous Emission Monitoring Systems (CEMS)
- 5.1.2 Predictive Emission Monitoring Systems (PEMS)
- 5.2 By Component
- 5.2.1 Hardware
- 5.2.1.1 Gas Analyzers
- 5.2.1.2 Flow and Opacity Monitors
- 5.2.1.3 Data Acquisition Systems (DAS)
- 5.2.2 Software
- 5.2.2.1 Stand-alone
- 5.2.2.2 Cloud-Hosted
- 5.2.3 Services
- 5.2.3.1 Installation and Deployment
- 5.2.3.2 Calibration and Certification
- 5.2.3.3 Support and Maintenance
- 5.2.1 Hardware
- 5.3 By Monitoring Technology
- 5.3.1 Extractive
- 5.3.1.1 Hot-Wet
- 5.3.1.2 Cold-Dry
- 5.3.2 Dilution
- 5.3.3 In-situ
- 5.3.3.1 Tunable Diode Laser Spectroscopy (TDLS)
- 5.3.1 Extractive
- 5.4 By End-User Industry
- 5.4.1 Power Generation
- 5.4.1.1 Coal-Fired
- 5.4.1.2 Combined-cycle Gas Turbines
- 5.4.2 Oil and Gas
- 5.4.2.1 Upstream
- 5.4.2.2 Midstream
- 5.4.2.3 Downstream and Refineries
- 5.4.3 Metals and Mining
- 5.4.4 Chemicals and Petrochemicals
- 5.4.5 Pharmaceuticals
- 5.4.6 Cement and Aggregates
- 5.4.7 Pulp and Paper
- 5.4.8 Waste-to-Energy and Incineration
- 5.4.9 Maritime (Ship-board)
- 5.4.1 Power Generation
- 5.5 By Geography
- 5.5.1 North America
- 5.5.1.1 United States
- 5.5.1.2 Canada
- 5.5.1.3 Mexico
- 5.5.2 Europe
- 5.5.2.1 Germany
- 5.5.2.2 United Kingdom
- 5.5.2.3 France
- 5.5.2.4 Italy
- 5.5.2.5 Spain
- 5.5.2.6 Rest of Europe
- 5.5.3 Asia-Pacific
- 5.5.3.1 China
- 5.5.3.2 Japan
- 5.5.3.3 South Korea
- 5.5.3.4 India
- 5.5.3.5 South East Asia
- 5.5.3.6 Rest of Asia-Pacific
- 5.5.4 South America
- 5.5.4.1 Brazil
- 5.5.4.2 Rest of South America
- 5.5.5 Middle East and Africa
- 5.5.5.1 Middle East
- 5.5.5.1.1 United Arab Emirates
- 5.5.5.1.2 Saudi Arabia
- 5.5.5.1.3 Rest of Middle East
- 5.5.5.2 Africa
- 5.5.5.2.1 South Africa
- 5.5.5.2.2 Rest of Africa
- 5.5.1 North America
6 COMPETITIVE LANDSCAPE
- 6.1 Market Concentration
- 6.2 Strategic Moves
- 6.3 Market Share Analysis
- 6.4 Company Profiles (includes Global level Overview, Market level overview, Core Segments, Financials as available, Strategic Information, Market Rank/Share for key companies, Products and Services, and Recent Developments)
- 6.4.1 ABB Ltd.
- 6.4.2 Siemens AG
- 6.4.3 Emerson Electric Co.
- 6.4.4 Thermo Fisher Scientific Inc.
- 6.4.5 AMETEK Inc.
- 6.4.6 Honeywell International Inc.
- 6.4.7 Teledyne Technologies Inc.
- 6.4.8 HORIBA Ltd.
- 6.4.9 SICK AG
- 6.4.10 Rockwell Automation Inc.
- 6.4.11 General Electric Company
- 6.4.12 Fuji Electric Co. Ltd.
- 6.4.13 Advanced Emissions Solutions Inc.
- 6.4.14 ENVEA Global SAS
- 6.4.15 Parker Hannifin Corp.
- 6.4.16 Baker Hughes Co.
- 6.4.17 Cemtrex Inc.
- 6.4.18 Babcock and Wilcox Enterprises Inc.
- 6.4.19 Opsis AB
- 6.4.20 Altech Environment U.S.A.
7 MARKET OPPORTUNITIES AND FUTURE OUTLOOK
- 7.1 White-space and Unmet-Need Assessment

