
PUBLISHER: Mordor Intelligence | PRODUCT CODE: 1851531

PUBLISHER: Mordor Intelligence | PRODUCT CODE: 1851531
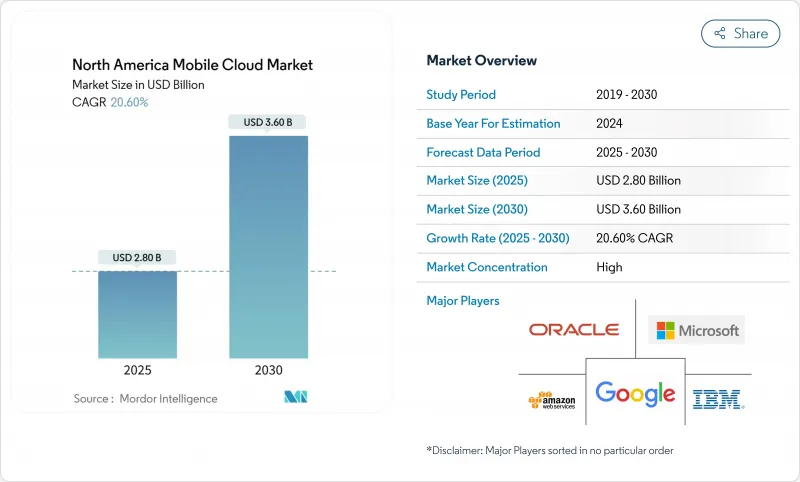
North America Mobile Cloud - Market Share Analysis, Industry Trends & Statistics, Growth Forecasts (2025 - 2030)
The signature verification market reached USD 2.8 billion in 2025 and is expected to grow to USD 3.6 billion by 2030, delivering a 20.6% CAGR over the forecast period.
Momentum is fueled by eIDAS 2.0 in Europe and 21 CFR Part 11 in the United States, both of which compel regulated sectors to adopt trustworthy digital-signature validation. Rising fraud losses, advances in AI-driven forgery analytics, and rapid cloud migration further elevate demand. Government programs ranging from AI-assisted mail-in ballot processing to Aadhaar-linked wallets expand use-cases and geographic reach. Meanwhile, multimodal authentication and API-first delivery models are reshaping competitive positioning across the signature verification market.
North America Mobile Cloud Market Trends and Insights
5G Densification & Edge POP Build-out
5G densification is transforming network topologies by relocating compute resources to micro-edge sites that sit one or two hops from the radio. T-Mobile's 5G Advanced rollout delivers the sub-10 ms round-trip latency that cloud gaming and augmented-reality apps demand. Partnerships such as Vapor IO and NVIDIA in Las Vegas show how edge points of presence now function as mini data centers with GPU acceleration rather than simple packet gateways. Cloud providers are off-loading content caching, AI inference, and security inspection to these nodes, trimming backhaul expenses and meeting stringent data-residency rules. Fixed-wireless access has already connected roughly 9 million homes, widening the addressable base for mobile cloud subscriptions. The ongoing spectrum refarming in 6 GHz bands is set to intensify small-cell deployment and propel new service tiers for ultra-reliable low-latency communication.
Generative-AI-led Mobile Workload Explosion
Generative-AI chat, translation, and video-creation tools are ballooning per-user data volumes beyond historical forecasts. Ericsson expects AI-based video interactions to sustain traffic momentum even as traditional streaming plateaus. Qualcomm estimates that cloud-only processing of multimodal AI queries could inflate infrastructure spend by billions, pushing vendors toward device-edge hybrids that trim compute cycles and power draw. Akamai's Cloud Inference service promises 60% lower latency and 86% lower cost compared with centralized inference, underscoring how specialized silicon at the edge is rewriting cost curves. Enterprises are embracing bring-your-own-model strategies, running proprietary LLMs in secure mobile backends to preserve IP while meeting data-sovereignty mandates. These dynamics are redefining capacity planning, turning burstable GPU pools at the metro edge into a core buying criterion for cloud contracts.
Mobile-specific Cloud Egress Costs
Data-out fees slice 10-15% from many mobile application budgets, because frequent state sync and media uploads traverse multiple availability zones. AWS lists USD 0.05 per GB for internet egress from US East, a charge that accumulates rapidly for high-resolution video or AI model updates. Google Cloud's recent decision to drop egress fees for customer-owned data hints at a forthcoming price war, yet inconsistent policies complicate forecasting. Startups that cannot negotiate volume discounts often refactor architectures, pushing content to regional edge nodes to avoid inter-region transfers. These pressures accelerate demand for multi-cloud routers and overlay networks that steer traffic toward the least-cost path without impacting user experience.
Other drivers and restraints analyzed in the detailed report include:
- BYOD Security Mandates (CISA & NIST SP-800-124 r2)
- eSIM-only Smartphone Design Wave
- Low-Orbit Satellite Backhaul Integration
- Zero-trust Latency Penalties
For complete list of drivers and restraints, kindly check the Table Of Contents.
Segment Analysis
Large enterprises controlled a 54.21% share in 2024, yet individual creators and freelancers are expanding at a 21.10% CAGR, a pace that will add fresh pressure on platform usability. Enterprises favour integrated access governance, centralized billing, and lengthy service-level commitments. Individual users prioritize pay-as-you-go compute bursts that spin up alongside a weekend coding sprint, often selecting simpler control panels over full-stack observability. This dichotomy forces providers to build dual personas into their consoles while unifying billing across roles.
Individual prosumers increasingly demand the same GPU clusters, low-code pipelines, and API gateways available to Fortune 500 accounts. The resulting traffic variability drives interest in autoscaling micro-VMs that boot in under a second. For the North America mobile cloud market, the implication is clear: back-end schedulers must juggle enterprise reservations and bursty consumer spikes within the same physical clusters. Providers that master this balancing act surface higher utilization without compromising SLA guarantees.
Public cloud services gathered 61.50% of the North America mobile cloud market share in 2024 by offering predictable pricing and friction-free onboarding. However, hybrid patterns are growing fastest at 22.70% CAGR as organizations blend colocation racks, telco edges, and hyperscale regions. Data-sovereignty laws and egress-cost discipline push sensitive tables and media libraries into nearby private clouds, leaving stateless microservices on public endpoints. DigitalOcean's Partner Network Connect exemplifies this posture by tunnelling 1-10 Gbps links between multiple providers to slash cross-cloud transfer fees.
Hybrid adoption is reinforced by multicolour disaster-recovery playbooks that replicate databases across vendor boundaries. Telcos, meanwhile, package compute alongside network slices, creating a unified fabric that auto-steers packets to the nearest function instance. This model positions the North America mobile cloud market as an orchestration canvas rather than a monolithic stack, rewarding platforms that provide consistent policy controls regardless of location.
North America Mobile Cloud Market is Segmented by User Type (Enterprise, Consumer), End-User Industry (Individual Users, Small and Medium Enterprises, Large Enterprises), Deployment Model (Public Cloud, Private Cloud and More), Application Type (mCommerce, Mobile Gaming and More), Geography. The Market Forecasts are Provided in Terms of Value (USD).
List of Companies Covered in this Report:
- Amazon Web Services Inc.
- Microsoft Corporation
- Google LLC
- IBM Corporation
- Oracle Corporation
- Salesforce Inc.
- SAP SE
- Akamai Technologies Inc.
- Cloudflare Inc.
- Kyndryl Holdings Inc.
- VMware by Broadcom
- Citrix (Cloud Software Group)
- Tencent Cloud Intl.
- DigitalOcean Holdings Inc.
- Alibaba Cloud Intl.
- Cloudways Ltd
- Kony Inc. (Temenos)
- Rackspace Technology Inc.
- Snowflake Inc.
- Fastly Inc.
Additional Benefits:
- The market estimate (ME) sheet in Excel format
- 3 months of analyst support
TABLE OF CONTENTS
1 INTRODUCTION
- 1.1 Study Assumptions and Market Definition
- 1.2 Scope of the Study
2 RESEARCH METHODOLOGY
3 EXECUTIVE SUMMARY
4 MARKET LANDSCAPE
- 4.1 Market Overview
- 4.2 Market Drivers
- 4.2.1 5G densification and edge POP build-out
- 4.2.2 Generative-AI-led mobile workload explosion
- 4.2.3 BYOD security mandates (CISA & NIST SP-800-124 r2)
- 4.2.4 ESIM-only smartphone design wave
- 4.2.5 Low-orbit satellite backhaul integration
- 4.3 Market Restraints
- 4.3.1 Mobile-specific cloud egress costs
- 4.3.2 Zero-trust latency penalties
- 4.4 Value / Supply-Chain Analysis
- 4.5 Regulatory Landscape
- 4.6 Technological Outlook
- 4.7 Porter's Five Forces Analysis
- 4.7.1 Bargaining Power of Suppliers
- 4.7.2 Bargaining Power of Buyers
- 4.7.3 Threat of New Entrants
- 4.7.4 Intensity of Competitive Rivalry
- 4.7.5 Threat of Substitutes
- 4.8 Investment Analysis
5 MARKET SIZE AND GROWTH FORECASTS (VALUE)
- 5.1 By End-user Industry
- 5.1.1 Individual Users
- 5.1.2 Small and Medium Enterprises
- 5.1.3 Large Enterprises
- 5.2 By Deployment Model
- 5.2.1 Public Cloud
- 5.2.2 Private Cloud
- 5.2.3 Hybrid / Multi-Cloud
- 5.3 By Application Type
- 5.3.1 mCommerce
- 5.3.2 Mobile Gaming
- 5.3.3 Content Streaming
- 5.3.4 Productivity and Collaboration
- 5.3.5 Others
- 5.4 By User Type
- 5.4.1 Enterprise
- 5.4.2 Consumer
- 5.5 By Geography
- 5.5.1 United States
- 5.5.2 Canada
- 5.5.3 Mexico
6 COMPETITIVE LANDSCAPE
- 6.1 Market Concentration
- 6.2 Strategic Moves
- 6.3 Market Share Analysis
- 6.4 Company Profiles {(includes Global level Overview, Market level overview, Core Segments, Financials as available, Strategic Information, Market Rank/Share for key companies, Products & Services, and Recent Developments)}
- 6.4.1 Amazon Web Services Inc.
- 6.4.2 Microsoft Corporation
- 6.4.3 Google LLC
- 6.4.4 IBM Corporation
- 6.4.5 Oracle Corporation
- 6.4.6 Salesforce Inc.
- 6.4.7 SAP SE
- 6.4.8 Akamai Technologies Inc.
- 6.4.9 Cloudflare Inc.
- 6.4.10 Kyndryl Holdings Inc.
- 6.4.11 VMware by Broadcom
- 6.4.12 Citrix (Cloud Software Group)
- 6.4.13 Tencent Cloud Intl.
- 6.4.14 DigitalOcean Holdings Inc.
- 6.4.15 Alibaba Cloud Intl.
- 6.4.16 Cloudways Ltd
- 6.4.17 Kony Inc. (Temenos)
- 6.4.18 Rackspace Technology Inc.
- 6.4.19 Snowflake Inc.
- 6.4.20 Fastly Inc.
7 MARKET OPPORTUNITIES AND FUTURE OUTLOOK
- 7.1 White-space and Unmet-Need Assessment

