
PUBLISHER: Mordor Intelligence | PRODUCT CODE: 2035163

PUBLISHER: Mordor Intelligence | PRODUCT CODE: 2035163
United States Live Music - Market Share Analysis, Industry Trends & Statistics, Growth Forecasts (2026 - 2031)
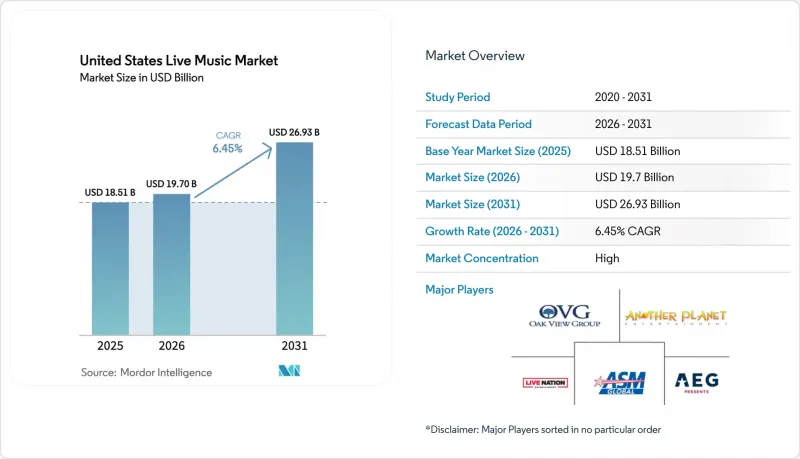
The United States live music market size was valued at USD 18.51 billion in 2025 and estimated to grow from USD 19.7 billion in 2026 to reach USD 26.93 billion by 2031, at a CAGR of 6.45% during the forecast period (2026-2031).
Solid pent-up demand from consumers who reprioritize shared experiences, combined with strategic venue investments and technology adoption by leading promoters, sustains this expansion path. Ticket revenues continue to anchor promoter economics even as sponsorship, merchandising and hybrid streaming channels diversify income streams and reduce exposure to pricing fatigue. Consolidation accelerates as Legends' acquisition of ASM Global and Live Nation Entertainment's USD 1 billion program for 18 new venues reshape facility control and enable superior negotiating leverage with artists. Regional momentum is strongest in the South, which benefits from migration trends and supportive local regulation, while the West records the fastest gains on the back of technology-sector affluence and aggressive green-field venue development. Across the forecast horizon, successful operators will balance dynamic pricing against regulatory pressure, manage climate-driven insurance costs, and embed ESG retrofits to secure new city permits all while maintaining fan trust.
United States Live Music Market Trends and Insights
Pent-Up Post-Pandemic Demand Surge
Consumer budgets keep shifting from on-demand audio streaming to in-person performances, reinforcing the United States live music market trajectory. Live Nation Entertainment served 145 million attendees in 2023 and produced USD 22.7 billion in revenue, signaling restored confidence among fans and artists alike. Gen Z concertgoers alone spent over USD 2,100 during the past two years, proving a willingness to pay premium prices when experiences feel unique. Average ticket prices reached USD 144 in 2025, 45% higher than 2019 levels, giving promoters short-run pricing power even while triggering affordability debates. Demand clusters in the South and West, where new residents and expanded capacities amplify volume, creating secondary-market resale premiums that 75% of Gen Z fans accept to secure attendance. Sustaining this momentum depends on macroeconomic stability, yet the driver remains potent through at least 2026 as consumers continue to prioritize shared cultural moments.
Rise of Dynamic Ticket-Pricing Algorithms
Artificial-intelligence engines now ingest real-time variables ranging from social chatter to weather forecasts, allowing venues to adjust listed prices minute by minute. Yield improvements lift average revenue per seat; however, the Oasis reunion tour controversy illustrates heightened scrutiny when perceived fairness erodes, prompting multiple states to consider transparency mandates. Major metropolitan areas adopt the model fastest due to rich data pools and consumer familiarity with variable pricing in other sectors, such as ridesharing and lodging. Secondary cities reveal slower uptake, with fans and local officials wary of volatility that undermines budgeting for leisure activities. Promoters must therefore calibrate algorithms to avoid reputational costs that may outweigh incremental margin. A balanced rollout that pairs transparent fee structures with loyalty rewards can preserve goodwill while still unlocking upside.
Ticket-Price Inflation Backlash & Regulatory Scrutiny
Escalating list prices combined with service fees spark consumer anger and legislative hearings, bringing new compliance costs to the United States live music market. Average face value hitting USD 144 in 2025 stretched household budgets, especially for fans under 30 despite their high willingness to attend live events. Some states now draft bills that insist promoters reveal maximum price ceilings at the start of any onsale, while others contemplate capping surge increments on dynamic platforms. Fee transparency rules could reduce ancillary revenue slices that promoters rely on, potentially shifting emphasis toward sponsorship and merchandise to protect margins. Public perception challenges mount on social platforms where screenshots of pricing spikes trend rapidly, forcing companies to invest in proactive communication. Balancing revenue optimization with equitable access becomes a critical reputational imperative over the next two years.
Other drivers and restraints analyzed in the detailed report include:
- Corporate Sponsorship Appetite for Experiential Marketing
- Growth in Hybrid/Streamed Add-On Revenue
- Talent-Booking Cost Escalation
For complete list of drivers and restraints, kindly check the Table Of Contents.
Segment Analysis
Concerts accounted for 45.21% of the United States live music market in 2025, providing the bedrock of annual tour cycles and representing the segment most familiar to mainstream audiences. The United States live music market size for concerts gains from predictable scheduling and scalable production templates that help promoters allocate capital efficiently. Artist-to-fan intimacy occurring in theater tours coexists with stadium spectacles that sell more than 60,000 tickets per date, offering a revenue ladder across career stages. Festivals, while only 12.50 % behind concerts in 2025 share terms, post a 9.08% CAGR and thus reshape how younger patrons engage through multi-day immersions that bundle food, camping and merchandising. Corporate events and weddings, each below 10% share, nonetheless add stability by filling venue calendars during weekdays and off-peak seasons. The evolving mix obliges venue operators to invest in modular staging solutions so spaces can morph quickly between applications and maximize occupancy.
Demand heterogeneity across applications underscores the need for differentiated marketing strategies within the United States live music market. Festivals leverage social-media virality and influencer partnerships to accelerate sell-through despite price increases. Concerts tap presale partnerships with credit-card brands that guarantee partial sold inventories before public onsales, thereby improving cash-flow visibility. The theater subcategory benefits from Broadway touring companies extending runs in regional cities, lifting local attendance and spending. Corporate gathering demand climbs as hybrid work elevates the value of in-person retreats, making premium hospitality upsells viable. Weddings integrate live bands alongside DJs, supporting niche agencies specializing in bespoke entertainment curation. Collectively, cross-pollination among applications further solidifies occupancy rates and ticket yield potential.
Ticket sales supplied 71.62% of the United States live music market size in 2025, serving as the primary generator of box-office receipts. While this share underscores core dependence, the ceiling on price elasticity invites promoters to cultivate high-growth alternatives. Sponsorship revenues are expected to grow 9.95% CAGR, reflecting the C-suite's realization that experiential placements outshine banner ads in brand recall. The United States live music market share held by merchandising hovers near 7%, with average per-head spend up 14% year over year as digital point-of-sale technology speeds transaction time. VIP experiences, although blended across ticket and hospitality accounting lines, deliver outsized profitability due to minimal incremental cost once base production is set. Hybrid streaming unlocks fresh pay-per-view and on-demand libraries, with some artists pre-selling digital collectibles that gate bonus content.
Diversification trends mitigate reliance on volatile ticket yields and help counterbalance insurance inflation. Corporate sponsors, armed with first-party data access, pay premiums for segments offering opt-in consumer intel beyond basic demographics. Merchandise design now involves capsule drops exclusive to venue kiosks, creating scarcity that prompts immediate purchase rather than post-event browsing. Dynamic bundles that pair physical tickets with NFTs or limited apparel heighten average order value without visible seat-price hikes, easing consumer sticker shock. Across clubs and arenas alike, the revenue algorithm continues to evolve toward a multilayered stack that spreads risk and capitalizes on multiple fan touchpoints.
The United States Live Music Market Report is Segmented by Application (Concerts, Festivals, Theater, Corporate Events, Weddings), Revenue Stream (Tickets, Sponsorship, Merchandising), Age Group (Children, Teenagers, Adults, Seniors), Venue Size (Small, Medium, Large), and Geography (Northeast, Midwest, South, West). The Market Forecasts are Provided in Terms of Value (USD).
List of Companies Covered in this Report:
- Live Nation Entertainment
- AEG Presents
- ASM Global
- Oak View Group
- Another Planet Entertainment
- Jam Productions
- The Bowery Presents
- C3 Presents
- Nederlander Concerts
- Feld Entertainment
- Spectra Experiences
- MSG Entertainment
- Red Mountain Entertainment
- Opry Entertainment Group
- Paradigm Talent Agency
- Wasserman Music
- United Talent Agency
- William Morris Endeavor
- Emporium Presents
- Paciolan
Additional Benefits:
- The market estimate (ME) sheet in Excel format
- 3 months of analyst support
TABLE OF CONTENTS
1 Introduction
- 1.1 Study Assumptions & Market Definition
- 1.2 Scope of the Study
2 Research Methodology
3 Executive Summary
4 Market Landscape
- 4.1 Market Overview
- 4.2 Market Drivers
- 4.2.1 Pent-up post-pandemic demand surge
- 4.2.2 Rise of dynamic ticket-pricing algorithms
- 4.2.3 Corporate sponsorship appetite for experiential marketing
- 4.2.4 Growth in hybrid/streamed add-on revenue
- 4.2.5 Emergence of NFT-based fan engagement models
- 4.2.6 Venue ESG retrofits unlocking new city permits
- 4.3 Market Restraints
- 4.3.1 Ticket-price inflation backlash & regulatory scrutiny
- 4.3.2 Talent-booking cost escalation
- 4.3.3 Insurance premiums tied to climate-related event risks
- 4.3.4 Local noise-ordinance tightening in secondary markets
- 4.4 Value / Supply-Chain Analysis
- 4.5 Regulatory Landscape
- 4.6 Technological Outlook
- 4.7 Porter's Five Forces
- 4.7.1 Threat of New Entrants
- 4.7.2 Bargaining Power of Buyers
- 4.7.3 Bargaining Power of Suppliers
- 4.7.4 Threat of Substitutes
- 4.7.5 Competitive Rivalry
5 Market Size & Growth Forecasts
- 5.1 By Application
- 5.1.1 Concerts
- 5.1.2 Festivals
- 5.1.3 Theater
- 5.1.4 Corporate Events
- 5.1.5 Weddings
- 5.2 By Revenue Stream
- 5.2.1 Tickets
- 5.2.2 Sponsorship
- 5.2.3 Merchandising
- 5.3 By Age Group
- 5.3.1 Children
- 5.3.2 Teenagers
- 5.3.3 Adults
- 5.3.4 Seniors
- 5.4 By Venue Size
- 5.4.1 Small (less than 1,000 seats)
- 5.4.2 Medium (1,001- 10,000 seats)
- 5.4.3 Large (greater than 10,000 seats)
- 5.5 By Geography
- 5.5.1 Northeast
- 5.5.2 Midwest
- 5.5.3 South
- 5.5.4 West
6 Competitive Landscape
- 6.1 Market Concentration
- 6.2 Strategic Moves
- 6.3 Market Share Analysis
- 6.4 Company Profiles (includes Global level Overview, Market level overview, Core Segments, Financials as available, Strategic Information, Market Rank/Share for key companies, Products & Services, and Recent Developments)
- 6.4.1 Live Nation Entertainment
- 6.4.2 AEG Presents
- 6.4.3 ASM Global
- 6.4.4 Oak View Group
- 6.4.5 Another Planet Entertainment
- 6.4.6 Jam Productions
- 6.4.7 The Bowery Presents
- 6.4.8 C3 Presents
- 6.4.9 Nederlander Concerts
- 6.4.10 Feld Entertainment
- 6.4.11 Spectra Experiences
- 6.4.12 MSG Entertainment
- 6.4.13 Red Mountain Entertainment
- 6.4.14 Opry Entertainment Group
- 6.4.15 Paradigm Talent Agency
- 6.4.16 Wasserman Music
- 6.4.17 United Talent Agency
- 6.4.18 William Morris Endeavor
- 6.4.19 Emporium Presents
- 6.4.20 Paciolan
7 Market Opportunities & Future Outlook
- 7.1 Multiday micro-festival formats in tier-2 cities
- 7.2 AI-powered dynamic stage-craft & personalized set-lists

