PUBLISHER: Mordor Intelligence | PRODUCT CODE: 2100599

PUBLISHER: Mordor Intelligence | PRODUCT CODE: 2100599
Outdoor LED Lighting - Market Share Analysis, Industry Trends & Statistics, Growth Forecasts (2026 - 2031)
According to Mordor Intelligence, the outdoor LED lighting market size was valued at USD 22.97 billion in 2025 and estimated to grow from USD 24.65 billion in 2026 to reach USD 35.14 billion by 2031, at a CAGR of 7.32% during the forecast period (2026-2031).
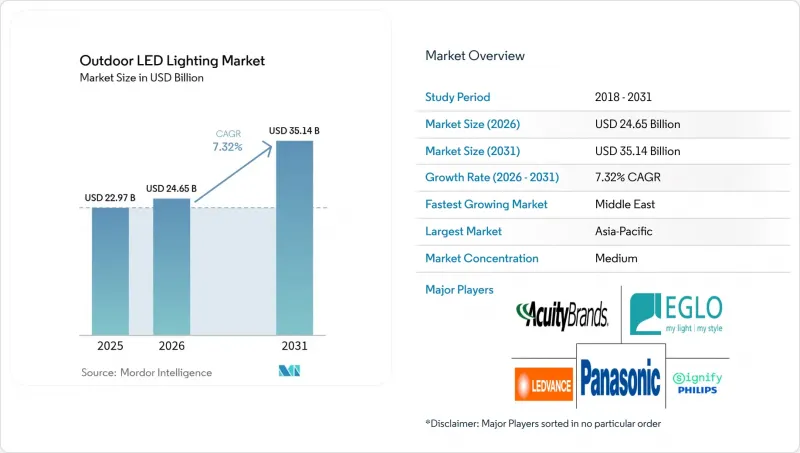
This report is Segmented by Product Type (Lamps, and Luminaires/Fixtures), Application (Street and Roadway Lighting, Architectural and Landscape, Sports and Stadium, Tunnel and Bridge, and More), Installation Type (New Installation, and Retrofit Installation), Distribution Channel (Direct Sales, Wholesale, Retail, and More), and Geography. The Market Forecasts are Provided in Terms of Value (USD).
Global Outdoor LED Lighting Market Trends and Insights
Urban Smart-City Programs Accelerate Modernization
Global smart-city spending continues to prioritize networked public lighting as foundational infrastructure. Dubai completed a 900-luminaire LED conversion along Sheikh Rashid Road that cut electricity use by 60% and extended average service life by 173%. Similar data-driven deployments in Philadelphia show 50% energy savings and measurable reductions in traffic incidents after adaptive dimming controls were activated. Municipal buyers are increasingly viewing connected poles as sensor hubs that generate high-value data on mobility and air quality, creating incremental revenue and providing valuable planning insights.
Component Price Deflation Expands Addressable Base
Average packaged-LED prices fell another 8% in 2024, while efficacy in mainstream outdoor fixtures climbed to 150-175 lumens per watt. The cost curve now supports economically viable deployments in remote transit hubs, temporary construction sites, and low-income municipalities that were previously locked out due to capital constraints. Manufacturers pass along savings through performance-locked service contracts that guarantee lumen output levels, transferring technical risk away from cities and property owners.
Raw-Material Disruptions Create Cost Spikes
China controls close to 80% of global gallium output, and its 2024 export licensing regime has caused spot prices to surge and lead times to lengthen. High-efficacy chips used in tunnel and broadcast-grade sports lighting are most exposed, forcing some OEMs to redesign packages around alternative phosphors. While multinationals carry buffer inventory, second-tier suppliers face margin pressure and sporadic order backlogs.
Other drivers and restraints analyzed in the detailed report include:
- Regulations Cement the Shift Away from HID
- IoT-Ready Fixtures Unlock Long-Term Value
- Capital Constraints Stall Smart-Control Rollouts
For complete list of drivers and restraints, kindly check the Table Of Contents.
Segment Analysis
Luminaires captured 67.80% of the 2025 revenue in the outdoor LED lighting market, buoyed by greenfield projects and smart-city mandates that require fully integrated housings with controls. Flagship sports venues, such as Utah's Maverik Center, installed 76 broadcast-grade LED floodlights that cut annual electricity costs by 72% while meeting NHL illumination standards. The segment will continue to anchor value, although its growth will moderate as price competition intensifies.
The lamp category, often overlooked during the early LED wave, is regaining momentum with a projected 6.34% CAGR to 2031. Straight-swap "plug and play" lamps appeal to budget-sensitive municipalities that can reuse existing housings. California's fluorescent ban is set to create an immediate spike in orders, accelerating compliance across school districts and small businesses. Secondary gains arise from homeowners adopting outdoor PAR-style retrofits, a trend amplified by big-box DIY retailers.
Street and roadway installations accounted for 41.85% of total revenue in 2025, underpinned by the large installed base of legacy sodium lamps. Dubai's city-wide retrofit demonstrates the scale economies now achievable when procurement teams bundle fixture supply with multiyear service contracts. Beyond savings, cities value enhanced uniformity, lower glare, and the ability to dim fixtures for wildlife migration seasons.
Sports and stadium lighting, while representing a smaller slice, will clock the swiftest expansion at a 5.18% CAGR. Broadcasters demand higher lux levels and stroboscopic control for ultra-slow-motion replays, requirements that halide systems cannot meet. Insurance firms in North America now offer premium discounts to venues with LED-based glare control and emergency-mode redundancy, providing facility operators with an additional financial incentive. The outdoor LED lighting market size for stadiums is projected to exceed USD 1.53 billion by 2031, driven by tournament-driven renovation cycles.
Complete Report Scope:
- By Product Type
- Lamps
- Luminaires / Fixtures
- By Application
- Street and Roadway Lighting
- Architectural and Landscape
- Sports and Stadium
- Tunnel and Bridge
- Parking and Transit Areas
- Other Applications
- By Installation Type
- New Installation
- Retrofit Installation
- By Distribution Channel
- Direct Sales
- Wholesale
- Retail
- E-commerce
- By Geography
- North America
- United States
- Canada
- Mexico
- South America
- Brazil
- Argentina
- Rest of South America
- Europe
- Germany
- United Kingdom
- France
- Italy
- Spain
- Russia
- Rest of Europe
- APAC
- China
- Japan
- India
- South Korea
- Australia
- Rest of APAC
- Middle East and Africa
- Middle East
- Saudi Arabia
- United Arab Emirates
- Turkey
- Rest of Middle East
- Africa
- South Africa
- Nigeria
- Rest of Africa
- Middle East
- North America
Geography Analysis
Asia-Pacific controlled 45.20% revenue in 2025, supported by vertically integrated Chinese supply chains and India's pooled procurement programs. The government stimulus aimed at green infrastructure, combined with abundant manufacturing capacity, helps keep the total cost of ownership low. Yet, the region's dominance is slowly eroding under the weight of raw material constraints and escalating maritime freight charges.
The Middle East exhibits the most dynamic runway, projected at an 8.46% CAGR. Ambitions embedded in Saudi Vision 2030 and the UAE's Net-Zero 2050 roadmap translate into large-scale outdoor lighting budgets for airports, promenades, and heritage sites. Martin Professional's 3,200-fixture lighting of Saudi Arabia's At-Turaif UNESCO site highlights the region's appetite for premium, culturally sensitive designs.
- Signify N.V.
- Acuity Brands, Inc.
- ams-OSRAM AG
- Hubbell Incorporated
- Zumtobel Group AG
- Cree Lighting, a division of IDEAL INDUSTRIES, Inc.
- Dialight plc
- Eaton Corporation plc (Cooper Lighting Solutions)
- Samsung Electronics Co., Ltd.
- LG Electronics Inc.
- GE Current, a Daintree company
- Thorn Lighting Ltd
- Valmont Industries, Inc.
- Nichia Corporation
- Everlight Electronics Co., Ltd.
- Legrand S.A.
- Panasonic Holdings Corporation
- Fagerhult Group AB
- OSINLUX Lighting Group Ltd.
- Bridgelux Inc.
Additional Benefits:
- The market estimate (ME) sheet in Excel format
- 3 months of analyst support
TABLE OF CONTENTS
1 INTRODUCTION
- 1.1 Study Assumptions and Market Definition
- 1.2 Scope of the Study
2 RESEARCH METHODOLOGY
3 EXECUTIVE SUMMARY
4 MARKET LANDSCAPE
- 4.1 Market Overview
- 4.2 Market Drivers
- 4.2.1 Rapid urban smart-city projects
- 4.2.2 Falling LED component prices and higher lumen/W ratios
- 4.2.3 Government phasing-out of HID street-lamps
- 4.2.4 Demand for adaptive lighting and IoT-ready luminaires
- 4.2.5 Insurance rebates for safer sports-venue lighting
- 4.2.6 Micro power-purchase agreements for municipal retrofits
- 4.3 Market Restraints
- 4.3.1 Supply-chain volatility in gallium and indium
- 4.3.2 High upfront cost for smart-control retrofits in emerging cities
- 4.3.3 Municipal budget re-prioritisation toward e-mobility infrastructure
- 4.3.4 Glare and light-pollution regulations limiting luminous flux
- 4.4 Industry Value Chain Analysis
- 4.5 Regulatory Landscape
- 4.6 Technological Outlook
- 4.7 The Impact of Macroeconomic Factors on the Market
- 4.8 Porter's Five Forces Analysis
- 4.8.1 Threat of New Entrants
- 4.8.2 Bargaining Power of Suppliers
- 4.8.3 Bargaining Power of Buyers
- 4.8.4 Threat of Substitutes
- 4.8.5 Competitive Rivalry
5 MARKET SIZE AND GROWTH FORECASTS (VALUE)
- 5.1 By Product Type
- 5.1.1 Lamps
- 5.1.2 Luminaires / Fixtures
- 5.2 By Application
- 5.2.1 Street and Roadway Lighting
- 5.2.2 Architectural and Landscape
- 5.2.3 Sports and Stadium
- 5.2.4 Tunnel and Bridge
- 5.2.5 Parking and Transit Areas
- 5.2.6 Other Applications
- 5.3 By Installation Type
- 5.3.1 New Installation
- 5.3.2 Retrofit Installation
- 5.4 By Distribution Channel
- 5.4.1 Direct Sales
- 5.4.2 Wholesale
- 5.4.3 Retail
- 5.4.4 E-commerce
- 5.5 By Geography
- 5.5.1 North America
- 5.5.1.1 United States
- 5.5.1.2 Canada
- 5.5.1.3 Mexico
- 5.5.2 South America
- 5.5.2.1 Brazil
- 5.5.2.2 Argentina
- 5.5.2.3 Rest of South America
- 5.5.3 Europe
- 5.5.3.1 Germany
- 5.5.3.2 United Kingdom
- 5.5.3.3 France
- 5.5.3.4 Italy
- 5.5.3.5 Spain
- 5.5.3.6 Russia
- 5.5.3.7 Rest of Europe
- 5.5.4 APAC
- 5.5.4.1 China
- 5.5.4.2 Japan
- 5.5.4.3 India
- 5.5.4.4 South Korea
- 5.5.4.5 Australia
- 5.5.4.6 Rest of APAC
- 5.5.5 Middle East and Africa
- 5.5.5.1 Middle East
- 5.5.5.1.1 Saudi Arabia
- 5.5.5.1.2 United Arab Emirates
- 5.5.5.1.3 Turkey
- 5.5.5.1.4 Rest of Middle East
- 5.5.5.2 Africa
- 5.5.5.2.1 South Africa
- 5.5.5.2.2 Nigeria
- 5.5.5.2.3 Rest of Africa
- 5.5.5.1 Middle East
- 5.5.1 North America
6 COMPETITIVE LANDSCAPE
- 6.1 Market Concentration
- 6.2 Strategic Moves
- 6.3 Market Share Analysis
- 6.4 Company Profiles (includes Global Level Overview, Market Level Overview, Core Segments, Financials as available, Strategic Information, Market Rank/Share for key companies, Products and Services, and Recent Developments)
- 6.4.1 Signify N.V.
- 6.4.2 Acuity Brands, Inc.
- 6.4.3 ams-OSRAM AG
- 6.4.4 Hubbell Incorporated
- 6.4.5 Zumtobel Group AG
- 6.4.6 Cree Lighting, a division of IDEAL INDUSTRIES, Inc.
- 6.4.7 Dialight plc
- 6.4.8 Eaton Corporation plc (Cooper Lighting Solutions)
- 6.4.9 Samsung Electronics Co., Ltd.
- 6.4.10 LG Electronics Inc.
- 6.4.11 GE Current, a Daintree company
- 6.4.12 Thorn Lighting Ltd
- 6.4.13 Valmont Industries, Inc.
- 6.4.14 Nichia Corporation
- 6.4.15 Everlight Electronics Co., Ltd.
- 6.4.16 Legrand S.A.
- 6.4.17 Panasonic Holdings Corporation
- 6.4.18 Fagerhult Group AB
- 6.4.19 OSINLUX Lighting Group Ltd.
- 6.4.20 Bridgelux Inc.
7 MARKET OPPORTUNITIES AND FUTURE OUTLOOK
- 7.1 White-space and unmet-need assessment

