PUBLISHER: Mordor Intelligence | PRODUCT CODE: 2113246

PUBLISHER: Mordor Intelligence | PRODUCT CODE: 2113246
United States Oil And Gas Upstream - Market Share Analysis, Industry Trends & Statistics, Growth Forecasts (2026 - 2031)
According to Mordor Intelligence, the United States oil and gas upstream market size is expected to grow from USD 103.94 billion in 2025 to USD 108.97 billion in 2026 and is forecast to reach USD 138.08 billion by 2031 at 4.84% CAGR over 2026-2031.
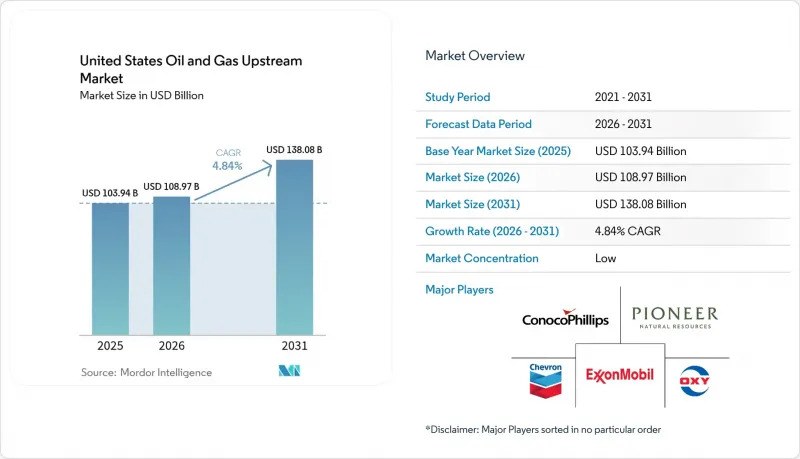
This report is Segmented by Location of Deployment (Onshore and Offshore), Resource Type (Crude Oil and Natural Gas), Well Type (Conventional and Unconventional), and Service (Exploration, Development and Production, and Decommissioning). The Market Sizes and Forecasts are Provided in Terms of Value (USD).
United States Oil And Gas Upstream Market Trends and Insights
Cost Optimization Through Digital Drilling Analytics
Digital drilling analytics reduce well costs by 10-15%, primarily by shortening drilling cycles and minimizing downhole incidents. SLB's Neuro platform processes 1,000 data points per second and has reduced drilling time by 20% in the Permian Basin. Halliburton's LOGIX system has logged 95% automated drilling on recent wells, cutting total spud-to-TD time by 30%. Corva's cloud-hosted dashboard predicts stick-slip, differential sticking, and other hazards hours in advance, lowering unexpected downtime by 30%. As algorithms learn from every run, performance gains become cumulative, pushing breakevens downward. The approach is especially attractive to smaller operators that can now lease software on a subscription basis rather than invest upfront in proprietary platforms.
Proliferation of Horizontal Shale Drilling in the Permian Basin
Extended-reach horizontals in the Permian yield initial production 30-40% higher than vertical counterparts, and active rigs topped 315 units-60% of the U.S. total-in late 2024. Average lateral lengths in core acreage already exceed 10,000 ft, with multi-zone completions improving recovery across stacked benches. Pad drilling reduces surface disturbance and trims per-well costs by 15-20% compared to single-well pads. Permian firms also benefit from mature transport and processing grids, which lower gathering costs and minimize flaring. Network effects entice additional capital, reinforcing the basin's lead in short-cycle supply.
Crude-Price Volatility & Capital-Discipline Pressures
Oil prices fluctuated between USD 70 and USD 85/bbl in 2024, prompting producers to maintain breakevens near USD 45/bbl and to reduce their rig fleets when WTI dipped below USD 65/bbl. Integrated majors capitalize on downturns by locking in discounted service rates, whereas independents often defer projects, resulting in a 15-20% reduction in activity. Variable cost structures-such as contracted rigs, spot frac spreads, and pay-as-you-go water services-help protect cash flow. Larger balance sheets and greater hedging depth confer a competitive advantage, enabling market share gains while weaker peers retreat. Continuous volatility thus reinforces consolidation and capital discipline, curbing near-term volume growth.
Other drivers and restraints analyzed in the detailed report include:
- Rising LNG-Export Infrastructure Boosting Gas Drilling
- Inflation Reduction Act CCS Incentives Accelerating EOR Projects
- ESG-Driven Divestment & Financing Constraints
For complete list of drivers and restraints, kindly check the Table Of Contents.
Segment Analysis
Onshore operations accounted for 74.18% of the US oil and gas upstream market in 2025, reflecting established infrastructure, rapid cycle times, and favorable cost profiles. Yet, the offshore segment is forecast to log a stronger 5.66% CAGR through 2031, as de-risked deepwater fields in the Gulf of Mexico move into development. Offshore projects involve higher upfront capital but generate flatter decline curves and longer plateau production, traits that attract patient capital. Chevron's Anchor and BP's Tiber are emblematic, each designed for 75,000 bbl/d peak output with managed-pressure drilling that trims subsalt risk.
Offshore growth bolsters supply diversity and tempers overall decline rates in the US oil and gas upstream market. Service providers are rolling out high-pressure riser systems, real-time formation evaluation, and automated well-completion strings that compress development schedules by 10-12%. As Gulf of Mexico lease sales raised USD 382 million in 2024, operators secured acreage at favorable terms amid muted competition. These commitments underpin a production up-cycle likely to endure beyond the current decade.
Natural gas held 54.12% of 2025 output and is projected to grow at a 5.17% CAGR, the fastest among resources in the US oil and gas upstream market. Abundant Appalachian dry gas and associated gas from Permian oil wells feed expanding LNG and domestic power demand, presenting multiple monetization avenues. Pipeline debottlenecks and processing plant additions in West Texas and Louisiana reduce flaring and capture more rich-gas liquids, improving well economics.
Crude oil volumes, while still substantial, face growth headwinds from OPEC+ coordination and refinery capacity constraints. Nonetheless, associated gas elevates the composite return of oil-weighted wells. The US oil and gas upstream industry is increasingly selling "energy packages" consisting of oil, condensate, gas, and NGLs, thereby optimizing revenue streams against market fluctuations.
Complete Report Scope:
- By Location of Deployment
- Onshore
- Offshore
- By Resource Type
- Crude Oil
- Natural Gas
- By Well Type
- Conventional
- Unconventional
- By Service
- Exploration
- Development and Production
- Decomissioning
List of Companies Covered in this Report:
- Exxon Mobil Corporation
- Chevron Corporation
- ConocoPhillips
- Occidental Petroleum Corporation
- Pioneer Natural Resources Company
- Devon Energy Corporation
- EOG Resources Inc.
- BP plc
- Shell plc
- Hess Corporation
- Marathon Oil Corporation
- Continental Resources Inc.
- Chesapeake Energy Corporation
- EQT Corporation
- Diamondback Energy Inc.
- Coterra Energy Inc.
- APA Corporation
- Murphy Oil Corporation
- Talos Energy Inc.
- Matador Resources Company
Additional Benefits:
- The market estimate (ME) sheet in Excel format
- 3 months of analyst support
TABLE OF CONTENTS
1 Introduction
- 1.1 Study Assumptions & Market Definition
- 1.2 Scope of the Study
2 Research Methodology
3 Executive Summary
4 Market Landscape
- 4.1 Market Overview
- 4.2 Market Drivers
- 4.2.1 Cost optimisation through digital drilling analytics
- 4.2.2 Proliferation of horizontal shale drilling in Permian Basin
- 4.2.3 Rising LNG-export infrastructure boosting gas drilling
- 4.2.4 Inflation Reduction Act CCS incentives accelerating EOR projects
- 4.2.5 Re-fracking of mature shale wells extending field life
- 4.2.6 De-risked deep-water plays in Gulf of Mexico post-2024 lease sales
- 4.3 Market Restraints
- 4.3.1 Crude-price volatility & capital-discipline pressures
- 4.3.2 Federal leasing restrictions on public lands
- 4.3.3 ESG-driven divestment & financing constraints
- 4.3.4 Skilled-labour shortages in advanced drilling ops
- 4.4 Supply-Chain Analysis
- 4.5 Regulatory Landscape
- 4.6 Technological Outlook
- 4.7 Crude-Oil Production & Consumption Outlook
- 4.8 Natural-Gas Production & Consumption Outlook
- 4.9 Unconventional Resources CAPEX Outlook (tight oil, oil sands, deep-water)
- 4.10 Porter's Five Forces
- 4.10.1 Threat of New Entrants
- 4.10.2 Bargaining Power of Suppliers
- 4.10.3 Bargaining Power of Buyers
- 4.10.4 Threat of Substitutes
- 4.10.5 Industry Rivalry
- 4.11 PESTLE Analysis
5 Market Size & Growth Forecast
- 5.1 By Location of Deployment
- 5.1.1 Onshore
- 5.1.2 Offshore
- 5.2 By Resource Type
- 5.2.1 Crude Oil
- 5.2.2 Natural Gas
- 5.3 By Well Type
- 5.3.1 Conventional
- 5.3.2 Unconventional
- 5.4 By Service
- 5.4.1 Exploration
- 5.4.2 Development and Production
- 5.4.3 Decomissioning
6 Competitive Landscape
- 6.1 Market Concentration
- 6.2 Strategic Moves (M&A, Partnerships, PPAs)
- 6.3 Market Share Analysis (Market Rank/Share for key companies)
- 6.4 Company Profiles (includes Global level Overview, Market level overview, Core Segments, Financials as available, Strategic Information, Products & Services, and Recent Developments)
- 6.4.1 Exxon Mobil Corporation
- 6.4.2 Chevron Corporation
- 6.4.3 ConocoPhillips
- 6.4.4 Occidental Petroleum Corporation
- 6.4.5 Pioneer Natural Resources Company
- 6.4.6 Devon Energy Corporation
- 6.4.7 EOG Resources Inc.
- 6.4.8 BP plc
- 6.4.9 Shell plc
- 6.4.10 Hess Corporation
- 6.4.11 Marathon Oil Corporation
- 6.4.12 Continental Resources Inc.
- 6.4.13 Chesapeake Energy Corporation
- 6.4.14 EQT Corporation
- 6.4.15 Diamondback Energy Inc.
- 6.4.16 Coterra Energy Inc.
- 6.4.17 APA Corporation
- 6.4.18 Murphy Oil Corporation
- 6.4.19 Talos Energy Inc.
- 6.4.20 Matador Resources Company
7 Market Opportunities & Future Outlook
- 7.1 White-space & Unmet-need Assessment

