PUBLISHER: Mordor Intelligence | PRODUCT CODE: 2113380

PUBLISHER: Mordor Intelligence | PRODUCT CODE: 2113380
India Oil And Gas Downstream - Market Share Analysis, Industry Trends & Statistics, Growth Forecasts (2026 - 2031)
According to Mordor Intelligence, the India oil and gas downstream market size was valued at USD 5.11 billion in 2025 and estimated to grow from USD 5.36 billion in 2026 to reach USD 6.81 billion by 2031, at a CAGR of 4.89% during the forecast period (2026-2031).
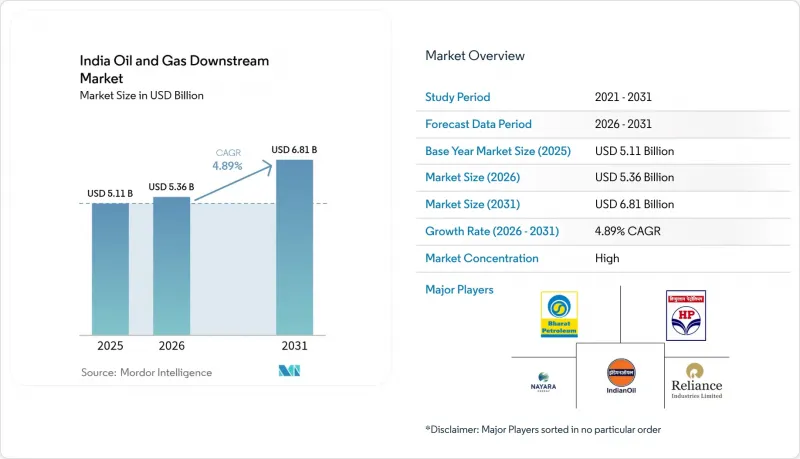
This report is Segmented by Type (Refineries and Petrochemical Plants), Product Type (Refined Petroleum Products, Petrochemicals, and Lubricants), and Distribution Channel (Direct Sales/Wholesale, Distributors/Commercial, and Retail). The Market Sizes and Forecasts are Provided in Terms of Value (USD).
India Oil And Gas Downstream Market Trends and Insights
Rising Middle-Class Fuel Demand
Vehicle ownership in Tier-2 and Tier-3 cities is increasing at a rate of 12% annually, outpacing the plateauing metros and creating dispersed demand nodes across the India oil and gas downstream market. Indian Oil Corporation plans to establish 5,000 new rural retail outlets by 2026, targeting these growth centers. Middle-class purchasing power is also driving the consumption of premium lubricants and specialty products, thereby boosting per-unit margins for retailers. Aviation turbine-fuel demand mirrors this trend as passenger numbers are set to double by 2030, further underpinning jet-fuel cracks. Together, these dynamics strengthen revenue visibility for refiners and marketers, supporting fresh investments in storage, logistics, and customer-facing technologies.
Bharat Stage-VI Compliance Capex
Sector-wide capex topping USD 15 billion has upgraded hydrotreaters, catalytic reformers, and blending systems to comply with BS-VI sulfur limits. Hindustan Petroleum's Vizag refinery alone invested USD 1.2 billion, completing upgrades ahead of peers and freeing funds for capacity growth in the India oil and gas downstream market. Early movers now sell premium BS-VI fuels domestically and export to sulfur-stringent markets, widening gross-refining margins. Smaller refiners face a capital-access squeeze and are considering joint ventures or mergers to dilute compliance costs. The regulatory milestone consequently accelerates industry consolidation and the diffusion of technology.
Capex Overruns & Delays
Project delays averaging 18-24 months and cost overruns up to 40% plague greenfield and expansion schemes, straining balance sheets and diluting forecast capacity additions in the India oil and gas downstream market. Environmental clearances, land acquisition disputes, and skilled labor shortages emerge as the primary bottlenecks. Bharat Petroleum's Bina expansion, for instance, slipped 30 months and ballooned to USD 4.1 billion, eroding IRR assumptions. Financing costs rise with each schedule slippage, curtailing dividend flexibility and nudging boards toward more conservative investment pacing or asset-light partnerships.
Other drivers and restraints analyzed in the detailed report include:
- Hydrogen & Bio-Fuels Blending Push
- Digital Refinery OPEX Optimization
- Margin Volatility vs. Crude Prices
For complete list of drivers and restraints, kindly check the Table Of Contents.
Segment Analysis
Refineries account for 65.12% of India's oil and gas downstream market share in 2025, reflecting the long-standing government emphasis on energy security through import-substitution refining. Jamnagar alone processes more than 1.3 million barrels per day, underpinning India's status as a net product exporter. This segment benefits from additional residential upgrading investments that increase diesel and jet-fuel yields and support lucrative exports to Europe and Africa. However, petrochemical plants-though smaller in base-are set to log a 7.22% CAGR to 2031, driving the fastest volumetric expansion across the India oil and gas downstream market.
The push toward integrated O2C complexes allows operators to toggle feedstocks between fuels and chemicals based on margin signals. ONGC Petro Additions Limited's Dahej complex exemplifies such flexibility, channeling refinery naphtha into polymer chains that command higher spreads compared to simple distillates. Technology upgrades under the Petroleum and Explosives Safety Organisation framework improve process safety, further strengthening investor confidence in new chemical units adjacent to legacy refineries.
Complete Report Scope:
- By Type
- Refineries
- Petrochemical Plants
- By Product Type
- Refined Petroleum Products
- Petrochemicals
- Lubricants
- By Distribution Channel
- Direct Sales/Wholesale
- Distributors/Commercial
- Retail
List of Companies Covered in this Report:
- Indian Oil Corporation Ltd
- Bharat Petroleum Corporation Ltd
- Hindustan Petroleum Corporation Ltd
- Reliance Industries Ltd
- Nayara Energy Ltd
- Mangalore Refinery & Petrochemicals Ltd
- Chennai Petroleum Corporation Ltd
- GAIL (India) Ltd
- Oil & Natural Gas Corporation
- Petronet LNG Ltd
- Indian Strategic Petroleum Reserves Ltd
- HPCL-Mittal Energy Ltd (HMEL)
- ONGC Petro additions Ltd (OPaL)
- Numaligarh Refinery Ltd
- Assam Petrochemicals Ltd
- Bharat Oman Refineries Ltd
- Adani Total Gas Ltd
- Ineos Styrolution India Ltd
- Haldia Petrochemicals Ltd
- Nayara Energy - Vadinar Refinery
Additional Benefits:
- The market estimate (ME) sheet in Excel format
- 3 months of analyst support
TABLE OF CONTENTS
1 Introduction
- 1.1 Study Assumptions & Market Definition
- 1.2 Scope of the Study
2 Research Methodology
3 Executive Summary
4 Market Landscape
- 4.1 Market Overview
- 4.2 Market Drivers
- 4.2.1 Rising middle-class fuel demand
- 4.2.2 Bharat Stage-VI compliance capex
- 4.2.3 Petrochemicals demand growth
- 4.2.4 Hydrogen & bio-fuels blending push
- 4.2.5 Digital refinery OPEX optimisation
- 4.2.6 Aviation traffic rebound
- 4.3 Market Restraints
- 4.3.1 Capex overruns & delays
- 4.3.2 Margin volatility vs crude prices
- 4.3.3 ESG / net-zero capital flight
- 4.3.4 EV adoption biting gasoline demand
- 4.4 Supply-Chain Analysis
- 4.5 Regulatory Landscape
- 4.6 Technological Outlook
- 4.7 Refining Capacity Analysis
- 4.8 Porter's Five Forces
- 4.8.1 Threat of New Entrants
- 4.8.2 Bargaining Power of Suppliers
- 4.8.3 Bargaining Power of Buyers
- 4.8.4 Threat of Substitutes
- 4.8.5 Competitive Rivalry
- 4.9 PESTLE Analysis
5 Market Size & Growth Forecasts
- 5.1 By Type
- 5.1.1 Refineries
- 5.1.2 Petrochemical Plants
- 5.2 By Product Type
- 5.2.1 Refined Petroleum Products
- 5.2.2 Petrochemicals
- 5.2.3 Lubricants
- 5.3 By Distribution Channel
- 5.3.1 Direct Sales/Wholesale
- 5.3.2 Distributors/Commercial
- 5.3.3 Retail
6 Competitive Landscape
- 6.1 Market Concentration
- 6.2 Strategic Moves (M&A, Partnerships, PPAs)
- 6.3 Market Share Analysis (Market Rank/Share for key companies)
- 6.4 Company Profiles (includes Global level Overview, Market level overview, Core Segments, Financials as available, Strategic Information, Products & Services, and Recent Developments)
- 6.4.1 Indian Oil Corporation Ltd
- 6.4.2 Bharat Petroleum Corporation Ltd
- 6.4.3 Hindustan Petroleum Corporation Ltd
- 6.4.4 Reliance Industries Ltd
- 6.4.5 Nayara Energy Ltd
- 6.4.6 Mangalore Refinery & Petrochemicals Ltd
- 6.4.7 Chennai Petroleum Corporation Ltd
- 6.4.8 GAIL (India) Ltd
- 6.4.9 Oil & Natural Gas Corporation
- 6.4.10 Petronet LNG Ltd
- 6.4.11 Indian Strategic Petroleum Reserves Ltd
- 6.4.12 HPCL-Mittal Energy Ltd (HMEL)
- 6.4.13 ONGC Petro additions Ltd (OPaL)
- 6.4.14 Numaligarh Refinery Ltd
- 6.4.15 Assam Petrochemicals Ltd
- 6.4.16 Bharat Oman Refineries Ltd
- 6.4.17 Adani Total Gas Ltd
- 6.4.18 Ineos Styrolution India Ltd
- 6.4.19 Haldia Petrochemicals Ltd
- 6.4.20 Nayara Energy - Vadinar Refinery
7 Market Opportunities & Future Outlook
- 7.1 White-space & Unmet-Need Assessment

