PUBLISHER: Mordor Intelligence | PRODUCT CODE: 2119707

PUBLISHER: Mordor Intelligence | PRODUCT CODE: 2119707
Public Cloud - Market Share Analysis, Industry Trends & Statistics, Growth Forecasts (2026 - 2031)
According to Mordor Intelligence, public cloud market size in 2026 is estimated at USD 0.86 trillion, growing from 2025 value of USD 0.73 trillion with 2031 projections showing USD 1.94 trillion, growing at 17.69% CAGR over 2026-2031.
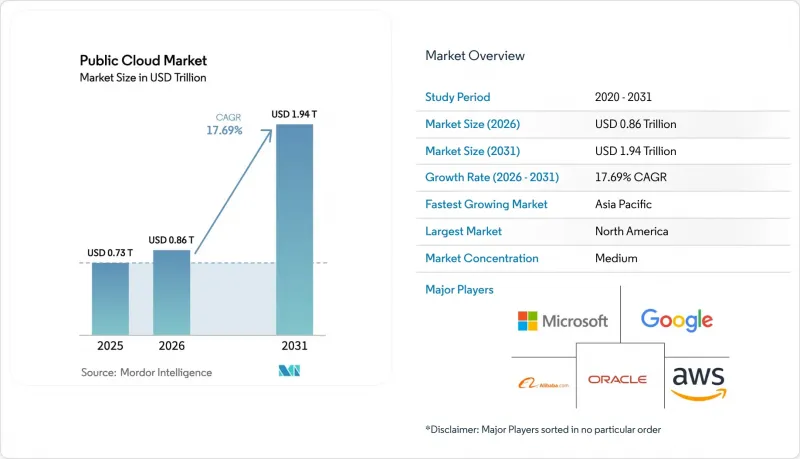
This report is Segmented by Deployment (Software-As-A-Service (SaaS), Platform-As-A-Service (PaaS), and Infrastructure-As-A-Service (IaaS)), Organization Size (Small and Medium Enterprises, and Large Enterprises), End-User Industry (BFSI, Healthcare and Life Sciences, Government and Public Sector, Manufacturing, IT and Telecom, and More), and Geography. The Market Forecasts are Provided in Terms of Value (USD).
Global Public Cloud Market Trends and Insights
AI-led workload migration boom
Manufacturing, banking, and healthcare organizations have moved beyond pilots to production-scale AI, propelling wholesale shifts into the public cloud market. BMW migrated 6,000 applications to SAP S/4HANA on cloud infrastructure, and JPMorgan Chase transferred 1 exabyte of data to AWS under a USD 17 billion annual technology budget. Ninety-three percent of manufacturers launched fresh AI projects in 2024, confirming that cloud-hosted AI is now a strategic imperative rather than an experiment.
GenAI-optimized chip supply ramp-up
NVIDIA, SoftBank, and the Japanese government are co-funding domestic AI datacenters to counter global component shortages, while U.S. hyperscale's commit double-digit-billion capital to secure motherboard and processor supply. AWS acknowledged chip scarcity as a drag on Q4 2024 revenue yet expects new fabs and packaging facilities to ease constraints by 2026.
Data-sovereignty patchwork
Conflicting statutes such as the EU GDPR and U.S. CLOUD Act force multinationals to duplicate storage across regions, hiking operational costs and slowing cross-border analytics pipelines. China's Cybersecurity Law similarly raises compliance friction for foreign firms that must isolate "important data" locally.
Other drivers and restraints analyzed in the detailed report include:
- Hyperscale price-performance wars
- Sovereign-cloud mandates
- GPU/optics supply bottlenecks
For complete list of drivers and restraints, kindly check the Table Of Contents.
Segment Analysis
PaaS will grow at 19.08% CAGR through 2031, even as SaaS held 55.60% public cloud market share in 2025. Enterprises graduate from a SaaS-first phase into PaaS to build proprietary AI services without managing underlying infrastructure. In Europe, developer demand for integrated environments has pushed PaaS ahead of Infrastructure-as-a-Service. Siemens' pairing of Teamcenter PLM with Microsoft Azure underscores PaaS's role in embedding AI into manufacturing workflows. The public cloud market size for PaaS is expected to surge as low-code platforms shrink development cycles, while SaaS continues to experience expansive albeit slower growth through domain-specific applications.
Infrastructure-as-a-Service retains steady relevance for lift-and-shift migrations, serving legacy workloads that cannot yet be containerized. Over the forecast, PaaS may erode SaaS' share where firms favor custom ML models over packaged software. Yet SaaS' ubiquity in CRM, HCM, and collaboration ensures it remains the revenue anchor of the public cloud market.
Complete Report Scope:
- By Deployment
- Software-as-a-Service (SaaS)
- Platform-as-a-Service (PaaS)
- Infrastructure-as-a-Service (IaaS)
- By Organisation Size
- Small and Medium Enterprises (SMEs)
- Large Enterprises
- By End-user Industry
- BFSI
- Healthcare and Life Sciences
- Government and Public Sector
- Manufacturing
- IT and Telecom
- Other End-user Industries
- By Geography
- North America
- South America
- Europe
- Asia-Pacific
- Middle East
- Africa
Geography Analysis
North America remains the largest region with 43.75% share in 2025, anchored by hyperscale headquarters, venture ecosystems, and mature enterprise spending patterns. However, pending tariffs of up to 34% on electronics risk inflating build costs, pushing operators like Microsoft to delay expansion talks. Federal cloud budgets are climbing, USD 8.3 billion earmarked for FY 2025, offsetting some inflationary drag. Treasury alone lifted its cloud allocation fourfold year-over-year, underscoring unwavering public-sector appetite.
Asia-Pacific is the velocity story, projected to grow 18.12% CAGR through 2031. AWS pledged JPY 2.26 trillion (USD 15.1 billion) for Japanese buildouts, while Microsoft is spending USD 2.9 billion on AI datacenters. Tokyo's Economic Security Promotion Act subsidizes half of a USD 100 million GenAI supercomputer, reflecting sovereign determination to secure compute. The Asian Development Bank finds cloud contributes up to 2.23% of GDP, with policy reform able to add 0.7 percentage-point growth by 2028.
Europe navigates stricter data-residency statutes such as DORA, complicating multinational rollouts but offering clarity for regional players adept at compliance. Despite regulation, continental cloud services are set for 23.1% CAGR to reach EUR 110.4 billion by 2028, although U.S. vendors still hold 72% share. South America, the Middle East, and Africa remain nascent yet strategic, attracting first-mover builds to capture unmet digital transformation demand.
- Amazon Web Services Inc.
- Microsoft Corporation (Azure)
- Google LLC (Google Cloud)
- Alibaba Cloud
- Oracle Corporation
- IBM Corporation
- Tencent Cloud
- Salesforce Inc.
- SAP SE
- Adobe Inc.
- VMware Inc.
- Huawei Cloud
- OVHcloud
- DigitalOcean Holdings Inc.
- Rackspace Technology Inc.
- Linode (Akamai)
- Hetzner Online GmbH
- Snowflake Inc.
- Workday Inc.
- ServiceNow Inc.
Additional Benefits:
- The market estimate (ME) sheet in Excel format
- 3 months of analyst support
TABLE OF CONTENTS
1 INTRODUCTION
- 1.1 Study Assumptions and Market Definition
- 1.2 Scope of the Study
2 RESEARCH METHODOLOGY
3 EXECUTIVE SUMMARY
4 MARKET LANDSCAPE
- 4.1 Market Overview
- 4.2 Market Drivers
- 4.2.1 AI-led workload migration boom
- 4.2.2 GenAI - optimised chip supply ramp-up
- 4.2.3 Hyperscaler price-performance wars
- 4.2.4 Sovereign-cloud mandates (under-reported)
- 4.2.5 Green datacentre tax credits
- 4.2.6 "Cloud-adjacent" AI accelerators demand
- 4.3 Market Restraints
- 4.3.1 Data-sovereignty patch-work
- 4.3.2 Escalating cloud egress fees
- 4.3.3 GPU/optics supply bottlenecks
- 4.3.4 Rising datacentre water-use scrutiny
- 4.4 Regulatory Landscape
- 4.5 Technological Outlook
- 4.6 Porter's Five Forces Analysis
- 4.6.1 Bargaining Power of Suppliers
- 4.6.2 Bargaining Power of Buyers
- 4.6.3 Threat of New Entrants
- 4.6.4 Threat of Substitutes
- 4.6.5 Intensity of Competitive Rivalry
- 4.7 Impact of Macroeconomic Factors on the Market
5 MARKET SIZE AND GROWTH FORECASTS (VALUE)
- 5.1 By Deployment
- 5.1.1 Software-as-a-Service (SaaS)
- 5.1.2 Platform-as-a-Service (PaaS)
- 5.1.3 Infrastructure-as-a-Service (IaaS)
- 5.2 By Organisation Size
- 5.2.1 Small and Medium Enterprises (SMEs)
- 5.2.2 Large Enterprises
- 5.3 By End-user Industry
- 5.3.1 BFSI
- 5.3.2 Healthcare and Life Sciences
- 5.3.3 Government and Public Sector
- 5.3.4 Manufacturing
- 5.3.5 IT and Telecom
- 5.3.6 Other End-user Industries
- 5.4 By Geography
- 5.4.1 North America
- 5.4.2 South America
- 5.4.3 Europe
- 5.4.4 Asia-Pacific
- 5.4.5 Middle East
- 5.4.6 Africa
6 COMPETITIVE LANDSCAPE
- 6.1 Market Concentration
- 6.2 Strategic Moves
- 6.3 Market Share Analysis
- 6.4 Company Profiles (includes Global level Overview, Market level overview, Core Segments, Financials as available, Strategic Information, Market Rank/Share for key companies, Products and Services, and Recent Developments)
- 6.4.1 Amazon Web Services Inc.
- 6.4.2 Microsoft Corporation (Azure)
- 6.4.3 Google LLC (Google Cloud)
- 6.4.4 Alibaba Cloud
- 6.4.5 Oracle Corporation
- 6.4.6 IBM Corporation
- 6.4.7 Tencent Cloud
- 6.4.8 Salesforce Inc.
- 6.4.9 SAP SE
- 6.4.10 Adobe Inc.
- 6.4.11 VMware Inc.
- 6.4.12 Huawei Cloud
- 6.4.13 OVHcloud
- 6.4.14 DigitalOcean Holdings Inc.
- 6.4.15 Rackspace Technology Inc.
- 6.4.16 Linode (Akamai)
- 6.4.17 Hetzner Online GmbH
- 6.4.18 Snowflake Inc.
- 6.4.19 Workday Inc.
- 6.4.20 ServiceNow Inc.
7 MARKET OPPORTUNITIES AND FUTURE OUTLOOK
- 7.1 White-space and Unmet-need Assessment

