
PUBLISHER: Roots Analysis | PRODUCT CODE: 1073201

PUBLISHER: Roots Analysis | PRODUCT CODE: 1073201
RNAi Market: Therapeutics and Technologies (Focus on siRNA, miRNA, shRNA and DNA) (3rd Edition) by Key Therapeutic Areas (Oncological Disorders, Genetic Disorders, Metabolic Disorders, Hematological Disorders, Ophthalmic Disorders and Other Disorders),
Title:
RNAi Market:
Therapeutics and Technologies (Focus on siRNA, miRNA, shRNA and DNA) (3rd Edition) by Key Therapeutic Areas (Oncological Disorders, Genetic Disorders, Metabolic Disorders, Hematological Disorders, Ophthalmic Disorders and Other Disorders), Route of Administration (Subcutaneous, Intravenous, Topical and Intradermal), Leading Industry Players, Type of RNAi Molecule (siRNA and shRNA) and Key Geographical Regions (North America, Europe, Asia-Pacific and Rest of the World): Industry Trends and Global Forecasts, 2022-2035.
Example Insights:
Overview
RNAi therapeutics have garnered significant attention post the 2006 Nobel Prize that was awarded to Andrew Fire and Craig Mello for the discovery of RNA interference (RNAi). Subsequently, upon the approval of the first RNAi therapeutic, ONPATTRO®, in 2018, the field has witnessed a further surge in activity. Since then, three more RNAi based therapies, namely (in chronological order of approval year) GIVLAARI® (November 2019), LEQVIO® (October 2020) and OXLUMO™ (November 2020), have been approved by regulatory authorities. In addition, over 200 RNAi drug candidates are being evaluated across several clinical trials for the treatment of a wide range of disease indications. The ongoing research and development efforts are driven by the various advantages offered by these molecules; these include higher efficacy and enhanced potency at reduced effector molecule concentrations, over other modalities based on the anti-sense approach. RNAi-based therapies have also been identified as potential candidates for the treatment of COVID-19.
However, despite the numerous benefits offered by RNAi therapies, developers often face concerns related to the stability and targeted delivery of their candidates. In order to mitigate the aforementioned challenges, several players have developed novel technologies and delivery systems to ensure target specific delivery of these molecules. Such advancements have allowed therapy developers to shift their focus towards the use of RNAi therapeutics. Initiatives are also being undertaken to explore the vast potential associated with such therapeutic modalities for the control of disease-associated gene expression. In addition to effective gene silencing, these candidates can be deployed for applications related to precision medicine. Studies have also demonstrated the safety of RNAi therapeutics for in systemic delivery, paving the way for systemic applications of the therapy. The high specificity, efficiency, and long term and stable gene silencing capabilities of RNAi therapeutics are believed to offer the potential to revolutionize the biopharmaceutical industry. As a result, several big pharma players have also undertaken various initiatives in this field of research. In the last five years, USD 8.5 billion has been invested to enable the advancement of ongoing research efforts. Moreover, 3,000+ articles related to RNAi therapeutics and technologies have been published. It is also worth highlighting that over 2,100 patents have been filed / granted, highlighting the continuous pace of ongoing innovation in this field. Given the high research activity and ongoing technology advancements, the RNAi therapeutics market is poised to grow at a steady pace in the foreseen future.
Scope of the Report
The "RNAi Market: Therapeutics and Technologies (Focus on siRNA, miRNA, shRNA and DNA) (3rd Edition) by Key Therapeutic Areas (Oncological Disorders, Genetic Disorders, Metabolic Disorders, Hematological Disorders, Ophthalmic Disorders and Other Disorders), Route of Administration (Subcutaneous, Intravenous, Topical and Intradermal), Leading Industry Players, Type of RNAi Molecule (siRNA and shRNA) and Key Geographical Regions (North America, Europe, Asia-Pacific and Rest of the World): Industry Trends and Global Forecasts, 2022-2035" report features an extensive study of the current market landscape and the likely future potential; associated with the RNAi therapeutics market, over the next decade. The study also includes a detailed analysis of key drivers and trends within this evolving market. Amongst other elements, the report features:
A detailed overview of the overall market landscape of players engaged in the development of RNAi therapeutics, based on several relevant parameters, such as phase of development (marketed, clinical, and preclinical / discovery stage) of pipeline candidates, target disease indication(s), key therapeutic areas (oncological disorders, infectious diseases, genetic disorders, ophthalmic diseases, respiratory disorders, hepatic disorders, metabolic disorders, cardiovascular disorders, dermatological disorders and other disorders), type of RNAi molecule (siRNA, miRNA, shRNA, sshRNA and DNA), target gene, route of administration and special drug designations (if any) .
- A detailed overview of the players engaged in the development of RNAi therapeutics, based on several relevant parameters, such as year of establishment, company size, location of headquarters and regional landscape.
- A competitiveness analysis of RNAi therapeutic developers, based on developer strength (in terms of employee count and years of experience) and product portfolio strength (in terms of number of RNAi molecules across different phases of development, type of RNAi molecule offered, purpose of technology and target therapeutic area).
- Elaborate profiles of drug candidates that are in the advanced stages of development (phase II / III and above). Each drug profile features information on the current development status of the drug, along with details on its developer, mechanism of action, route of administration, affiliated technology Platform (if available) , dosage and recent clinical trial results.
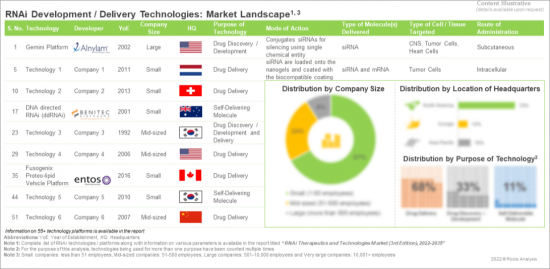
- An overview of the current market landscape of technology platforms available for the development of RNAi therapeutics, along with information on their developer, purpose of technology, type of molecule (s) delivered and type of cell (s) / tissue (s) targeted. In addition, the chapter includes information on technology developer(s), highlighting the year of their establishment, company size and location of headquarters. The chapter also includes brief profiles of key RNAi-based drug discovery / development technology platforms and drug delivery technologies (shortlisted on the basis of competitiveness score) . Each profile features details on the various pipeline molecules that have been / are being developed using the technology and insights from patents associated with the technology.
- An insightful technology competitiveness analysis, benchmarking RNAi technologies, based on supplier power (in terms of company size and years of experience) and key technology specifications. The analysis was designed to enable stakeholder companies to compare their existing capabilities within and beyond their respective peer groups and identify opportunities to achieve a competitive edge in the industry.
- A detailed analysis of the target indications (segregated by various therapeutic areas, including oncological disorders, infectious diseases, metabolic disorders, ophthalmic diseases and genetic disorders) that are currently the prime focus of companies engaged in the development of RNAi therapeutics.
- An analysis of completed, ongoing and planned clinical studies, based on several relevant parameters, such as trial registration year, current status, phase of development, type of RNAi molecule, enrolled patient population and regional distribution of trials.
- An analysis highlighting the key opinion leaders (KOLs) in this domain. It features a 2X2 analysis to assess the relative experience of certain KOLs who were shortlisted based on their contributions (in terms of involvement in various clinical studies) in this field.
- An in-depth analysis of patents related to RNAi therapeutics, filed / granted, since 2016, based on type of patent (granted patents, patent applications and others), publication year, regional applicability, CPC symbols, emerging focus areas, leading industry / non-industry players (in terms of the number of patents filed / granted) , and patent valuation.
- A detailed review of around 3,000 peer-reviewed, scientific articles related to research on RNAi therapeutics, based on several relevant parameters, such as year of publication, type of publication, popular keywords, top journals, top publishers, key copyright holders and key funding institutes.
- An analysis of the various partnerships related to RNAi therapeutics inked by players engaged in this domain, based on various parameters, such as the type of partnership, year of partnership, target disease indication, therapeutic area, type of RNAi molecule, financial details (wherever applicable), focus area of collaboration and most active players (in terms of number of partnerships) .
- A detailed analysis of various investments made by players engaged in this domain, during the period 2016-2021, based on several relevant parameters, such as year of funding, type of funding (seed financing, venture capital financing, IPOs, secondary offerings, debt financing, grants and other offerings), amount invested, type of RNAi molecule, most active players (in terms of number and amount of funding instances) and key investors (in terms of number of instances) .
- An elaborate discussion on the various commercialization strategies that can be adopted by drug developers engaged in this domain, across different stages of therapy development, including prior to drug launch, at / during drug launch and post-marketing of the drug.
- An elaborate discussion on the use of miRNA as a potential biomarker, along with a list of diagnostic kits that are either available in the market, or likely to be approved in the foreseen future.
- A detailed analysis of the companies that are actively supporting the development of RNAi therapeutics market, including contract manufacturers, contract researcher organizations and other service providers based on various parameters, such as type of service provider, location of their headquarters and type of RNAi molecule developed.
- An informed estimate of the annual clinical and commercial demand for RNAi therapeutics, taking into account the target patient population in ongoing and planned clinical trials of RNAi therapeutics, sponsored by both industry and non-industry players.
- A detailed analysis capturing affiliated trends, key drivers and challenges, under a comprehensive SWOT framework, featuring a Harvey ball analysis, highlighting the relative impact of each SWOT parameter on the RNAi therapeutics market.
One of the key objectives of the report was to estimate the existing market size and estimate the future size of the RNAi therapeutics market. We have provided informed estimates on the evolution of the market for the period 2022-2035. Our year-wise projections of the current and future opportunity have further been segmented on the basis of [A] key therapeutic areas (oncological disorders, genetic disorders, metabolic disorders, hematological disorders, ophthalmic disorders and other diosrders), [B] route of administration (subcutaneous, intravenous, topical and intradermal), [C] share of leading industry players, [D] type of RNAi molecule (siRNA and shRNA) and [E] key geographical regions (North America, Europe and Asia-Pacific). In order to account for future uncertainties and to add robustness to our model, we have provided three market forecast scenarios, namely conservative, base and optimistic scenarios, representing different tracks of the market's evolution.
All actual figures have been sourced and analyzed from publicly available information forums and primary research discussions. Financial figures mentioned in this report are in USD, unless otherwise specified.
Key Questions Answered:
- Who are the key players engaged in the development of RNAi therapeutics?
- Which drugs are being evaluated across early and late stages of pipeline?
- Which are the key therapeutic areas targeted by RNAi therapeutics?
- Which technology platforms / delivery systems are being used for the development and delivery of RNAi therapeutics?
- What are the most active trial sites (in terms of number of clinical studies being conducted) related to RNAi therapeutics?
- Who are the key opinion leaders / experts engaged in the field of RNAi therapeutics?
- Which companies are actively filing patents to drive innovation in the field of RNAi therapeutics?
- What type of partnership models are commonly adopted by industry stakeholders?
- Who are the key investors in this domain?
- Which commercialization strategies are most commonly adopted by RNAi therapy developers, across different stages of product development?
- Who are the key service providers engaged in the RNAi therapeutics domain?
- How is the current and future market opportunity likely to be distributed across key market segments?
Chapter Outlines
Chapter 2 is an executive summary of the key insights captured during our research. It offers a high-level view on the current state of the RNAi therapeutics market and its likely evolution in the short-mid term to long term.
Chapter 3 provides a general overview of RNAi therapeutics, including a discussion on the historical background. In addition, it includes information on the type of RNA molecule, along with information on their mechanisms of action and application areas. Further, it highlights the key advantages and challenges associated with this domain.
Chapter 4 includes information on over 200 RNAi pipeline candidates that are currently in different stages of development. It features a detailed analysis of the pipeline molecules, based on several relevant parameters, such as phase of development, target indication(s), key therapeutic areas, type of RNAi molecule, target genes, route of administration and special drug designation (if any) .
Chapter 5 presents the detailed overview of players engaged in the development of RNAi therapeutics, along with information on their year of establishment, company size and location of headquarters. In addition, it features a logo landscape of product developers based on location of headquarters and company size.
Chapter 6 presents a three-dimensional bubble analysis of key players engaged in this domain, evaluating their developer strength (on the basis of employee count and years of experience) and product portfolio strength (on the basis of number of RNAi molecules across different phases of development, type of RNAi molecule offered, purpose of technology and target therapeutic areas).
Chapter 7 contains detailed profiles of drug candidates that are in the advanced stages of development (phase II/III and above). Each drug profile features information on the current development status of the drug, along with details on its developer, mechanism of action, route of administration, affiliated technology platform (if available) , dosage and recent clinical trial results
Chapter 8 provides an analysis of the current market landscape of technology platforms available for the development of RNAi therapeutics, based on several relevant parameters such as, purpose of technology, type of molecule (s) delivered and type of cell (s) / tissue (s) targeted. In addition, the chapter includes an analysis on technology developer(s), highlighting their year of their establishment, company size and location of headquarters. The chapter also includes brief profiles of key RNAi-based drug discovery / development technology platforms and drug delivery technologies (shortlisted on the basis of competitiveness score) . Each profile features details on the various pipeline molecules that have been / are being developed using the technology and insights from patents associated with the technology.
Chapter 9 presents the technology competitiveness analysis, benchmarking RNAi technologies, based on supplier power (in terms of in terms of company size and years of experience) and key technology specifications. The analysis was designed to enable stakeholder companies to compare their existing capabilities within and beyond their respective peer groups and identify opportunities to achieve a competitive edge in the industry.
Chapter 10 highlights the potential target indications (segregated by various therapeutic areas, including oncological disorders, infectious diseases, metabolic disorders, ophthalmic diseases and genetic disorders) that are currently the prime focus of companies engaged in the development of RNAi therapeutics.
Chapter 11 is an analysis of completed, ongoing and planned clinical studies, based on several relevant parameters, such as trial registration year, current status, phase of development, type of RNAi molecule, enrolled patient population and regional distribution of trials.
Chapter 12 presents an analysis highlighting the key opinion leaders (KOLs) in this domain. It features a 2X2 analysis to assess the relative experience of certain KOLs who were shortlisted based on their contributions (in terms of involvement in various clinical studies) in this field.
Chapter 13 provides insights from a detailed patent analysis, presenting an overview of the filed / granted patents related to RNAi therapeutics since 2016, based on type of patent (granted patents, patent applications and others), publication year, regional applicability, CPC symbols, emerging focus areas and the leading industry / academic players (in terms of the number of patents filed / granted) , and patent valuation. The chapter also includes a patent benchmarking analysis and a detailed valuation analysis.
Chapter 14 provides a detailed review of around 3,000 peer-reviewed, scientific articles related to research on RNAi therapeutics, based on several relevant parameters, such as year of publication, type of publication, popular keywords, top journals, top publishers, key copyright holders and key funding institutes.
Chapter 15 features an elaborate analysis the various partnerships related to RNAi therapeutics inked by players engaged in this domain, based on various parameters, such as the type of partnership, year of partnership, target disease indication, therapeutic area, type of RNAi molecule, financial details (wherever applicable), focus area of collaboration and most active players (in terms of number of partnerships) .
Chapter 16 presents details on various investments various investments made by players engaged in this domain, during the period 2016-2021, based on several relevant parameters, such as year of funding, type of funding (seed financing, venture capital financing, IPOs, secondary offerings, debt financing, grants and other offerings), amount invested, type of RNAi molecule, most active players (in terms of number and amount of funding instances) and key investors (in terms of number of instances) .
Chapter 17 highlights various commercialization strategies that can be adopted by drug developers engaged in this domain, across different stages of therapy development, including prior to drug launch, at / during drug launch and post-marketing of the drug. The aspects covered in the chapter include details provided on the product website (covering key messages for patients and healthcare professionals), patient support offerings and informative downloadable content.
Chapter 18 discusses the use of miRNAs as potential biomarkers and enlists several miRNA biomarkers currently under investigation. In addition, the chapter provides the pipeline of diagnostic kits that have already been approved or are under development.
Chapter 19 provides information on the companies that are actively supporting the development of RNAi therapeutics market. These include contract manufacturers, contract researcher organizations and other service providers. In addition, the chapter includes an analysis based on parameters such as type of service provider, location of their headquarters and type of RNA molecule.
Chapter 20 provides an informed estimate of the annual clinical and commercial demand for RNAi therapeutics, taking into account the target patient population in ongoing and planned clinical trials of RNAi therapeutics, sponsored by both industry and non-industry players.
Chapter 21 presents an informed forecast analysis, highlighting the future potential of the market, till the year 2035. It also includes future sales projections of RNAi therapeutics that are either marketed or in advanced stages of clinical development (phase II/III and above). Sales potential and growth opportunity were estimated based on the target patient population, likely adoption rates, existing / future competition from other drug classes and the likely price of products. The chapter also presents a detailed market segmentation on the basis of [A] key therapeutic areas (oncological disorders, genetic disorders, metabolic disorders, hematological disorders, ophthalmic disorders and other disorders), [B] route of administration (subcutaneous, intravenous, topical and intradermal), [C] share of leading industry players, [D] type of RNAi molecule (siRNA and shRNA) and [E] key geographical regions (North America, Europe and Asia-Pacific).
Chapter 22 provides a detailed discussion on affiliated trends, key drivers and challenges, under a comprehensive SWOT framework, featuring a Harvey ball analysis, highlighting the relative impact of each SWOT parameter on the RNAi therapeutics market.
Chapter 23 summarizes the entire report. It presents the list of key takeaways and offers our independent opinion on the current market scenario.
Chapter 24 is a collection of interview transcripts of the discussions that were held with key stakeholders in this market.
Chapter 25 is an appendix, which provides tabulated data and numbers for all the figures included in the report.
Chapter 26 is an appendix, which provides the list of companies and organizations mentioned in the report.
TABLE OF CONTENTS
1. PREFACE
- 1.1. Scope of the Report
- 1.2. Research Methodology
- 1.3. Key Questions Answered
- 1.4. Chapter Outlines
2. EXECUTIVE SUMMARY
3. INTRODUCTION
- 3.1. Chapter Overview
- 3.2. Key Milestones and Historical Trends Related to RNAi
- 3.2.1. Discovery of RNAi
- 3.2.2. Development Efforts Focused on RNAi Therapies
- 3.3. Mechanism of RNAi
- 3.3.1. Components of RNAi
- 3.3.2. Cellular Mechanism
- 3.4. Types of RNAi Molecules
- 3.4.1. siRNA
- 3.4.2. miRNA
- 3.4.3. shRNA
- 3.5. Applications of RNAi
- 3.5.1 Functional Genomics
- 3.5.2 Therapeutics
- 3.5.3. Biotechnology
- 3.5.4. Genome-scale Screening
- 3.6. Advantages and Disadvantages of RNAi
- 3.6.1 Advantages of RNAi
- 3.6.2 Disadvantages of RNAi
- 3.6.3 Key Concerns Discussed During Regulatory Submissions (A Case Study)
- 3.7. Future Perspectives
4. MARKET OVERVIEW
- 4.1. Chapter Overview
- 4.2. RNAi Therapeutics: Marketed and Development Pipeline
- 4.2.1. Analysis by Type of RNAi Molecule
- 4.2.2. Analysis by Phase of Development
- 4.2.3. Analysis by Type of Molecule and Phase of Development
- 4.2.4. Analysis by Target Gene
- 4.2.5. Analysis by Therapeutic Area
- 4.2.6. Analysis by Route of Administration
- 4.2.7. Analysis by Special Drug Designation
- 4.2.8. Key Players
5. COMPETITIVE LANDSCAPE
- 5.1. Chapter Overview
- 5.2. RNAi Therapeutics: List of Developers
- 5.2.1. Analysis by Year of Establishment
- 5.2.2. Analysis by Company Size
- 5.2.3. Analysis by Location of Headquarters
- 5.2.4. Most Active Players: Analysis by Number of Drug Candidates
- 5.3 RNAi Therapeutics: Regional Landscape
6. COMPANY COMPETITIVENESS ANALYSIS
- 6.1. Chapter Overview
- 6.2. Assumptions and Key Parameters
- 6.3. Methodology
- 6.4. RNAi Therapeutics Developers: Company Competitive Analysis
- 6.4. RNAi Therapeutics Developers based in North America
- 6.5. RNAi Therapeutics Developers based in Europe
- 6.6. RNAi Therapeutics Developers based in Asia-Pacific and Rest of the World
7. APPROVED AND LATE STAGE RNAi THERAPEUTICS
- 7.1. Chapter Overview
- 7.2. Onpattro®
- 7.2.1. Drug Overview
- 7.2.2. Technology Overview
- 7.2.3. Current Development Status
- 7.2.4. Recent Clinical Trial Results
- 7.2.5. Recent Partnerships
- 7.3. Givlaari®
- 7.3.1. Drug Overview
- 7.3.2. Technology Overview
- 7.3.3. Current Development Status
- 7.3.4. Recent Clinical Trial Results
- 7.3.5. Recent Partnerships
- 7.4. Leqvio®
- 7.4.1. Drug Overview
- 7.4.2. Technology Overview
- 7.4.3. Current Development Status
- 7.4.4. Recent Clinical Trial Results
- 7.4.5. Recent Partnerships
- 7.5. Oxlumo™
- 7.5.1. Drug Overview
- 7.5.2. Technology Overview
- 7.5.3. Current Development Status
- 7.5.4. Recent Clinical Trial Results
- 7.5.5. Recent Partnerships
- 7.6. Fitusiran
- 7.6.1. Drug Overview
- 7.6.2. Technology Overview
- 7.6.3. Current Development Status
- 7.6.4. Recent Clinical Trial Results
- 7.7. Vutrisiran
- 7.7.1. Drug Overview
- 7.7.2. Technology Overview
- 7.7.3. Current Development Status
- 6.7.4. Recent Clinical Trial Results
- 7.8. SYL 1001
- 7.8.1. Drug Overview
- 7.8.2. Technology Overview
- 7.8.3. Current Development Status
- 7.8.4. Recent Clinical Trial Results
- 7.9. Vigil-EWS
- 7.9.1. Drug Overview
- 7.9.2. Technology Overview
- 7.9.3. Current Development Status
- 7.9.4. Recent Clinical Trial Results
- 7.10. SR-061
- 7.10.1. Drug Overview
- 7.10.2. Technology Overview
- 7.10.3. Current Development Status
- 7.11. Nedosiran
- 7.11.1. Drug Overview
- 7.11.2. Technology Overview
- 7.11.3. Current Development Status
- 7.11.4. Recent Clinical Trial Results
8. TECHNOLOGY PLATFORMS AND DELIVERY SYSTEMS
- 8.1. Chapter Overview
- 8.2. Components of RNAi Delivery Systems
- 8.2.1. RNAi Triggers
- 8.2.1.1. Asymmetric siRNA (cp-siRNA)
- 8.2.1.2. DNA Directed RNAi (ddRNAi)
- 8.2.1.3. Dicer Substrate siRNA (DsiRNA)
- 8.2.1.4. Naked siRNA
- 8.2.1.5. Self-Deliverable RNA (sd-RNA)
- 8.2.1.6. Self-Deliverable rxRNA (sd-rxRNA)
- 8.2.1.7. Unlocked Nucleobase Analog (UNA) Containing siRNA (UsiRNA)
- 8.2.2. Technology Platforms and Delivery Systems
- 8.2.2.1. Analysis by Purpose of Technology
- 8.2.2.2. Analysis by Type of Molecule (s) Delivered
- 8.2.2.3. Analysis by Type of Cell (s) / Tissue (s) Targeted
- 8.2.3. Technology Platforms: List of Developers
- 8.2.3.1. Analysis by Year of Establishment
- 8.2.3.2. Analysis by Company Size
- 8.2.3.3. Analysis by Location of Headquarters (Continent-wise)
- 8.2.3.4. Analysis by Location of Headquarters (Country-wise)
- 8.2.4. Technology Platform: Profiles
- 8.2.4.1. Conjugated Delivery Technologies
- 8.2.4.1.1. GalNAc Conjugate Delivery System, Alnylam Pharmaceuticals
- 8.2.4.1.1.1. Technology Overview
- 8.2.4.1.1.2 Pipeline Molecules in Development
- 8.2.4.1.1.3 Analyst's Perspective
- 8.2.4.1.2. Protein Nanoparticle (PNP) Delivery Technology, Ariz Precision Medicine
- 8.2.4.1.2.1. Technology Overview
- 8.2.4.1.2.2. Pipeline Molecules in Development
- 8.2.4.1.2.3 Analyst's Perspective
- 8.2.4.2.3 Targeted RNAi Molecule (TRiM) Platform, Arrowhead Pharmaceuticals
- 8.2.4.2.3.1. Technology Overview
- 8.2.4.2.3.2 Pipeline Molecules in Development
- 8.2.4.2.3.3 Analyst's Perspective
- 8.2.4.1.1. GalNAc Conjugate Delivery System, Alnylam Pharmaceuticals
- 8.2.4.2. Drug Discovery and Development Technologies
- 8.2.4.2.1. GalXC Conjugated RNAi Technology Platform, Dicerna Pharmaceuticals
- 8.2.4.2.1.1. Technology Overview
- 8.2.4.2.1.2 Pipeline Molecules in Development
- 8.2.4.2.1.3 Analyst's Perspective
- 8.2.4.2.2. The Vigil Platform, Gradalis
- 8.2.4.2.2.1. Technology Overview
- 8.2.4.2.2.2 Pipeline Molecules in Development
- 8.2.4.2.2.3 Analyst's Perspective
- 8.2.4.2.3. mRNAi GOLD Platform, Silence Therapeutics
- 8.2.4.2.3.1. Technology Overview
- 8.2.4.2.3.2 Pipeline Molecules in Development
- 8.2.4.2.3.3 Analyst's Perspective
- 8.2.4.2.1. GalXC Conjugated RNAi Technology Platform, Dicerna Pharmaceuticals
- 8.2.4.1. Conjugated Delivery Technologies
- 8.2.1. RNAi Triggers
9. TECHNOLOGY COMPETITIVENESS ANALYSIS
- 9.1. Chapter Overview
- 9.2. Key Assumptions and Parameters
- 9.3. Methodology
- 9.4. Technology Competitiveness Analysis
- 9.4.1. Technology Competitiveness Analysis: Drug Delivery Technologies
- 9.4.2. Technology Competitiveness Analysis: Drug Discovery and Development Technologies
10. KEY THERAPEUTIC INDICATIONS
- 10.1. Chapter Overview
- 10.2. Oncological Disorders
- 10.2.1. Analysis by Target Indication and Phase of Development
- 10.2.2. Analysis by Type of RNAi Molecule
- 10.3. Infectious Diseases
- 10.3.1. Analysis by Target Indication and Phase of Development
- 10.3.2. Analysis by Type of RNAi Molecule
- 10.4. Metabolic Disorders
- 10.4.1. Analysis by Target Indication and Phase of Development
- 10.4.2. Analysis by Type of RNAi Molecule
- 10.5. Ophthalmic Diseases
- 10.5.1. Analysis by Target Indication and Phase of Development
- 10.5.2. Analysis by Type of RNAi Molecule
- 10.6. Genetic Disorders
- 10.6.1. Analysis by Target Indication and Phase of Development
- 10.6.2. Analysis by Type of RNAi Molecule
11. CLINICAL TRIAL ANALYSIS
- 11.1. Chapter Overview
- 11.2. Scope and Methodology
- 11.3. RNAi Therapeutics: Clinical Trial Analysis
- 11.3.1. Analysis by Trial Registration Year
- 11.3.2. Analysis by Trial Phase
- 11.3.3. Analysis by Trial Recruitment Status
- 11.3.4. Analysis by Type of Sponsor / Collaborator
- 11.3.5. Analysis by Type of RNAi Molecule
- 11.3.6. Analysis by Therapeutic Area
- 11.3.7. Geographical Analysis by Number of Clinical Trials
- 11.3.8. Geographical Analysis by Number of Clinical Trials, Trial Phase and Recruitment Status
- 11.3.9. Geographical Analysis by Number of Clinical Trials and Type of RNAi Molecule
- 11.3.10. Geographical Analysis by Number of Clinical Trials, Type of RNAi Molecule and Trial Phase
- 11.3.11. Geographical Analysis by Number of Clinical Trials and Therapeutic Area
- 11.3.12. Geographical Analysis by Number of Clinical Trials, Therapeutic Area and Trial Phase
- 11.3.13. Geographical Analysis of Enrolled Patient Population
- 11.3.14. Geographical Analysis of Enrolled Patient Population by Trial Phase and Trial Recruitment Status
- 11.3.15. Geographical Analysis of Enrolled Patient Population by Type of RNAi Molecule
- 11.3.16. Geographical Analysis of Enrolled Patient Population by Trial Phase and Type of RNAi Molecule
- 11.3.17. Geographical Analysis of Enrolled Patient Population by Therapeutic Area
- 11.3.18. Geographical Analysis of Enrolled Patient Population by Trial Phase and Therapeutic Area
- 11.4. Concluding Remarks
- 11.4.1. Key Therapeutic Candidates
- 11.4.2. Key Clinical Trials
12. KEY OPINION LEADERS
- 12.1. Chapter Overview
- 12.2. RNAi Therapeutics: Key Opinion Leaders
- 12.3. Analysis by Type of Organization
- 12.3.1. Analysis by Qualification of Key Opinion Leaders
- 12.3.2. Analysis by Geographical Location of KOLs
- 12.3.3. Analysis by Number of Affiliations
- 12.3.4. KOL Activeness v/s KOL Strength
- 12.4. Most Prominent KOLs: Analysis by KOL Strength
- 12.5. Benchmarking of Key Opinion Leaders (Roots Analysis versus Third Party Scoring)
13. PATENT ANALYSIS
- 13.1. Chapter Overview
- 13.2. Scope and Methodology
- 13.3. RNAi Therapeutics: Patent Analysis
- 13.3.1. Analysis by Type of Patent
- 13.3.2. Analysis by Publication Year
- 13.3.3. Analysis by Patent Status
- 13.3.4. Analysis by CPC Code
- 13.3.5. Analysis by Type of Organization
- 13.3.6. Analysis by Geography
- 13.3.5.1. North American Scenario
- 13.3.5.2. European Scenario
- 13.3.5.3 Asia-Pacific Scenario
- 13.3.6. Emerging Focus Areas
- 13.3.7. Leading Players: Analysis by Number of Patents
- 13.4. RNAi Therapeutics: Patent Benchmarking Analysis
- 13.4.1. Analysis by Key Patent Characteristics
- 13.5. RNAi Therapeutics: Patent Valuation Analysis
14. PUBLICATION ANALYSIS
- 14.1. Chapter Overview
- 14.2. Analysis Methodology and Key Parameters
- 14.3. RNAi Therapeutics: List of Publications
- 14.3.1. Analysis by Year of Publication
- 14.3.2. Analysis by Type of Publication
- 14.3.3. Most Popular Keywords
- 14.3.4. Top Journals: Analysis by Number of Publications
- 14.3.5. Top Publisher: Analysis by Number of Publications
- 14.3.6. Key Copyright Holders: Analysis by Number of Publications
- 14.3.7. Key Funding Institutes: Analysis by Number of Publications
15. RECENT PARTNERSHIPS
- 15.1. Chapter Overview
- 15.2. Partnership Models
- 15.3. RNAi Therapeutics: List of Partnerships
- 15.3.1. Analysis by Year of Partnership
- 15.3.2. Analysis by Type of Partnership
- 15.3.3. Analysis by Type of RNAi Molecule
- 15.3.4. Analysis by Scale of Partnership
- 15.3.5. Analysis by Therapeutic Area
- 15.3.6. Most Active Players: Analysis by Number of Partnerships
- 15.3.7. Analysis by Geography
- 15.3.7.1. Local and International Deals
- 15.3.7.2. Intercontinental and Intracontinental Deals
16. FUNDING AND INVESTMENT ANALYSIS
- 16.1. Chapter Overview
- 16.2. Types of Funding
- 16.3. RNAi Therapeutics: Funding and Investment Analysis
- 16.3.1. Analysis by Cumulative Funding Instances, 2016-2021
- 16.3.2. Analysis by Amount Invested
- 16.3.3. Analysis by Type of Funding
- 16.3.4. Analysis by Year and Type of Funding
- 16.3.5. Analysis of Amount Invested by Type of RNAi Molecule
- 16.3.6. Analysis of Amount Invested by Geography
- 16.3.7. Most Active Players
- 16.3.8. Key Investors
- 16.4. Concluding Remarks
17. KEY COMMERCIALIZATION STRATEGIES
- 17.1. Chapter Overview
- 17.2. Successful Drug Launch Strategy: ROOTS Framework
- 17.3. Successful Drug Launch Strategy: Product Differentiation
- 17.4. Commonly Adopted Commercialization Strategies based on Stage of Development of the Product
- 17.5. Approved RNAi Therapeutics
- 17.6. Key Commercialization Strategies Adopted by RNAi-based Therapy Developers
- 17.6.1. Strategies Adopted Before Therapy Approval
- 17.6.1.1. Participation in Global Events
- 17.6.1.2. Collaboration with Stakeholders and Pharmaceutical Firms
- 17.6.1.3. Indication Expansion
- 17.6.2. Strategies Adopted During / Post Therapy Approval
- 17.6.2.1. Participation in Global Events
- 17.6.2.2. Geographical Expansion
- 17.6.2.3. Patient Assistance Programs
- 17.6.2.4. Awareness Through Product Websites
- 17.6.2.5. Collaboration with Stakeholders and Pharmaceutical Firms
- 17.6.2.6. Aligning with Government Initiatives to Ensure High Adoption Rate
- 17.6.1. Strategies Adopted Before Therapy Approval
- 17.7. Concluding Remarks
18. RNAi IN DIAGNOSTICS
- 18.1. Chapter Overview
- 18.2. Key Characteristics of Biomarkers
- 18.3. Circulating miRNA Biomarkers
- 18.4. miRNA Biomarkers in Oncological Disorders
- 18.4.1. Importance of Early Cancer Detection
- 18.4.2. Cancer Screening and Diagnosis
- 18.4.3. Conventional Cancer Diagnostics
- 18.4.3.1. Biopsy
- 18.4.4. Need for Non-Invasive Approaches
- 18.4.5. Key Indications
- 18.4.5.1. Breast Cancer
- 18.4.5.2. Colorectal Cancer
- 18.4.5.3. Gastric Cancer
- 18.4.5.4. Hematological Cancer
- 18.4.5.4.1. Acute Myeloid Leukemia
- 18.4.5.4.2 Lymphoma
- 18.4.5.5. Lung Cancer
- 18.4.5.6. Prostate Cancer
- 18.5. miRNA Biomarkers in Cardiovascular Diseases
- 18.5.1. Key Indications
- 18.5.1.1. Coronary Artery Disease
- 18.5.1.2. Myocardial Infarction
- 18.5.1. Key Indications
- 18.6. miRNA Based Diagnostic Tests
19. SERVICE PROVIDERS FOR RNAi THERAPEUTICS
- 19.1. Chapter Overview
- 19.2. Analysis by Types of Service Providers
- 19.3. RNAi Therapeutics: List of CROs
- 19.3.1. Analysis by Year of Establishment
- 19.3.2. Analysis by Location of Headquarters
- 19.3.3. Analysis by Company Size
- 19.3.4. Analysis by Type of RNAi Molecule
- 19.4. RNAi Therapeutics: List of CMOs
- 19.4.1. Analysis by Year of Establishment
- 19.4.2. Analysis by Location of Headquarters
- 19.4.3. Analysis by Company Size
- 19.4.4. Analysis by Type of RNAi Molecule
- 19.5. RNAi Therapeutics: List of Consumables and Other Service Providers
- 19.5.1. Analysis by Year of Establishment
- 19.5.2. Analysis by Location of Headquarters
- 19.5.3. Analysis by Company Size
- 19.5.4. Analysis by Type of RNAi Molecule
20. DEMAND ANALYSIS
- 20.1. Chapter Overview
- 20.2. Assumptions and Methodology
- 20.3. Clinical Demand for RNAi Therapeutics
- 20.4. Commercial Demand for RNAi Therapeutics
21. MARKET SIZING AND OPPORTUNITY ANALYSIS
- 21.1. Chapter Overview
- 21.2. Scope and Limitations
- 21.3. Key Assumptions and Forecast Methodology
- 21.4. Global RNAi Therapeutics Market, 2022-2035
- 21.4.1. RNAi Therapeutics Market: Analysis by Type of RNAi Molecule
- 21.4.2. RNAi Therapeutics Market: Analysis by Therapeutic Area
- 21.4.3. RNAi Therapeutics Market: Analysis by Route of Administration
- 21.4.4. RNAi Therapeutics Market: Share of Leading Players
- 21.4.5. RNAi Therapeutics Market: Analysis by Geography
- 21.5. RNAi Therapeutics Market: Value Creation Analysis
- 21.6. RNAi Therapeutics Market: Product-wise Sales Forecasts
- 21.6.1. Onpattro®
- 21.6.1.1. Target Patient Population
- 21.6.1.2. Sales Forecast
- 21.6.1.3. Net Present Value
- 21.6.1.4. Value Creation Analysis
- 21.6.2. Givlaari™
- 21.6.2.1. Target Patient Population
- 21.6.2.2. Sales Forecast
- 21.6.2.3. Net Present Value
- 21.6.2.4. Value Creation Analysis
- 21.6.3. Leqvio®
- 21.6.3.1. Target Patient Population
- 21.6.3.2. Sales Forecast
- 21.6.3.3. Net Present Value
- 21.6.3.4. Value Creation Analysis
- 21.6.4. Oxlumo™
- 21.6.4.1. Target Patient Population
- 21.6.4.2. Sales Forecast
- 21.6.4.3. Net Present Value
- 21.6.4.4. Value Creation Analysis
- 21.6.5. Fitusiran
- 21.6.5.1. Target Patient Population
- 21.6.5.2. Sales Forecast
- 21.6.5.3. Net Present Value
- 21.6.5.4. Value Creation Analysis
- 21.6.6. Vutrisiran
- 21.6.6.1. Target Patient Population
- 21.6.6.2. Sales Forecast
- 21.6.6.3. Net Present Value
- 21.6.6.4. Value Creation Analysis
- 21.6.7. SYL-1001
- 21.6.7.1. Target Patient Population
- 21.6.7.2. Sales Forecast
- 21.6.7.3. Net Present Value
- 21.6.7.4. Value Creation Analysis
- 21.6.8. Vigil-EWS
- 21.6.8.1. Target Patient Population
- 21.6.8.2. Sales Forecast
- 21.6.8.3. Net Present Value
- 21.6.8.4. Value Creation Analysis
- 21.6.9. Nedosiran
- 21.6.9.1. Target Patient Population
- 21.6.9.2. Sales Forecast
- 21.6.9.3. Net Present Value
- 21.6.9.4. Value Creation Analysis
- 21.6.1. Onpattro®
22. SWOT ANALYSIS
- 22.1. Chapter Overview
- 22.2. Strengths
- 22.3. Weaknesses
- 22.4. Opportunities
- 22.5. Threats
- 22.6 Comparison of SWOT Factors
- 22.6.1 Concluding Remarks
23. INTERVIEW TRANSCRIPT(S)
24. CONCLUSION
- 24.1. Chapter Overview
- 24.2. Key Takeaways
25. APPENDIX 1: TABULATED DATA
26. APPENDIX 2: LIST OF COMPANIES AND ORGANIZATIONS
List OfFigures
- Figure 2.1 Executive Summary: Market Landscape
- Figure 2.2 Executive Summary: Technology Platforms and Delivery Systems
- Figure 2.3 Executive Summary: Clinical Trial Analysis
- Figure 2.4 Executive Summary: Key Opinion Leaders
- Figure 2.5 Executive Summary: Patent Analysis
- Figure 2.6 Executive Summary: Publication Analysis
- Figure 2.7 Executive Summary: Recent Partnerships
- Figure 2.8 Executive Summary: Funding and Investment Analysis
- Figure 2.9 Executive Summary: Demand Analysis
- Figure 2.10 Executive Summary: Market Sizing and Opportunity Analysis
- Figure 3.1 RNA Interference: Key Milestones and Historical Trends Related to RNAi
- Figure 3.2 RNA Interference: Key Components
- Figure 3.3 RNA Interference: Working Mechanism
- Figure 3.4 RNA Interference: Types of Delivery Systems
- Figure 3.5 RNA Interference: Applications
- Figure 3.6 RNA Interference: Advantages and Disadvantages
- Figure 4.1 RNAi Therapeutics: Distribution by Type of RNAi Molecule
- Figure 4.2 RNAi Therapeutics: Distribution by Phase of Development
- Figure 4.3 RNAi Therapeutics: Distribution by Type of Molecule and Phase of Development
- Figure 4.4 RNAi Therapeutics: Distribution by Target Gene
- Figure 4.5 RNAi Therapeutics: Distribution by Therapeutic Area
- Figure 4.6 RNAi Therapeutics: Distribution by Route of Administration
- Figure 4.7 RNAi Therapeutics: Distribution by Special Drug Designation
- Figure 4.8 RNAi Therapeutics: Distribution by Special Drug Designation and Therapeutic Area
- Figure 4.9 RNAi Therapeutics: Key Players
- Figure 5.1 RNAi Therapeutics Developers: Distribution by Year of Establishment
- Figure 5.2 RNAi Therapeutics Developers: Distribution by Company Size
- Figure 5.3 RNAi Therapeutics Developers: Distribution by Location of Headquarters (Continent-wise)
- Figure 5.4 RNAi Therapeutics Developers: Distribution by Location of Headquarters (Country-wise)
- Figure 5.5 Most Active Players: Distribution by Number of Drug Candidates
- Figure 5.6 RNAi Therapeutics: Regional Landscape
- Figure 6.1 Company Competitiveness Analysis: RNAi Therapeutic Developers based in North America
- Figure 6.2 Company Competitiveness Analysis: RNAi Therapeutic Developers based in Europe
- Figure 6.3 Company Competitiveness Analysis: RNAi Therapeutic Developers based in Asia-Pacific and Rest of the World
- Figure 7.1 Onpattro® (Alnylam Pharmaceuticals): Regulatory Approval Timeline across Regions
- Figure 7.2 Lipid Nanoparticles Delivery System: Mode of Action
- Figure 7.3 Givlaari® (Alnylam Pharmaceuticals): Regulatory Approval Timeline across Regions
- Figure 7.4 Givlaari® (Alnylam Pharmaceuticals): Mechanism of Action
- Figure 7.5 Leqvio® (Alnyalm Pharmaceuticals): Regulatory Approval Timeline across Regions
- Figure 8.1 RNAi Technology Platforms: Distribution by Purpose of Technology / Platform
- Figure 8.2 RNAi Technology Platforms: Distribution by Type of Molecule(s) Delivered
- Figure 8.3 RNAi Technology Platforms: Distribution by Type of Cell(s) / Tissue(s) Targeted
- Figure 8.4 RNAi Technology Developers: Distribution by Year of Establishment
- Figure 8.5 RNAi Technology Developers: Distribution by Company Size
- Figure 8.6 RNAi Technology Developers: Distribution by Location of Headquarters
- Figure 8.7 RNAi Technology Developers: Distribution by Location of Headquarters (Country-wise)
- Figure 8.8 Protein Nanoparticle Delivery System: Technology Components and Their Assembly
- Figure 8.9 mRNAi GOLD Platform: Advantages
- Figure 9.1 RNAi Technology Competitiveness Analysis: Drug Delivery Technologies
- Figure 9.2 RNAi Technology Competitiveness Analysis: Drug Discovery and Development Technologies
- Figure 10.1 RNAi Therapeutics for Oncological Disorders: Distribution by Target Indication and Phase of Development
- Figure 10.2 RNAi Therapeutics for Oncological Disorders: Distribution by Type of RNAi Molecule
- Figure 10.3 RNAi Therapeutics for Infectious Diseases: Distribution by Target Indication and Phase of Development
- Figure 10.4 RNAi Therapeutics for Infectious Diseases: Distribution by Type of RNAi Molecule
- Figure 10.5 RNAi Therapeutics for Metabolic Disorders: Distribution by Target Indication and Phase of Development
- Figure 10.6 RNAi Therapeutics for Metabolic Disorders: Distribution by Type of RNAi Molecule
- Figure 10.7 RNAi Therapeutics for Ophthalmic Diseases: Distribution by Target Indication and Phase of Development
- Figure 10.8 RNAi Therapeutics for Ophthalmic Diseases: Distribution by Type of RNAi Molecule
- Figure 10.9 RNAi Therapeutics for Genetic Disorders: Distribution by Target Indication and Phase of Development
- Figure 10.10 RNAi Therapeutics for Genetic Disorders: Distribution by Type of RNAi Molecule
- Figure 11.1 Clinical Trial Analysis: Methodology
- Figure 11.2 Clinical Trial Analysis: Cumulative Distribution by Trial Registration Year, Pre-2014-2022
- Figure 11.3 Clinical Trial Analysis: Geographical Distribution of Trials by Start Year, Pre-2014 - 2022
- Figure 11.4 Clinical Trial Analysis: Cumulative Distribution of Enrolled Patient Population by Start Year, Pre-2014 - 2022
- Figure 11.5 Clinical Trial Analysis: Distribution of Enrolled Patient Population by Trial Phase
- Figure 11.6 Clinical Trial Analysis: Distribution by Trial Recruitment Status and Phase of Development
- Figure 11.7 Clinical Trial Analysis: Distribution by Type of Sponsor / Collaborator
- Figure 11.8 Clinical Trial Analysis: Distribution by Type of RNAi Molecule and Trial Registration Year
- Figure 11.9 Clinical Trial Analysis: Distribution by Type of RNAi Molecule and Trial Recruitment Status
- Figure 11.10 Clinical Trial Analysis: Distribution by Type of RNAi Molecule and Phase of Development
- Figure 11.11 Clinical Trial Analysis: Distribution by Therapeutic Area
- Figure 11.12 Clinical Trial Analysis: Distribution by Therapeutic Area and Phase of Development
- Figure 11.13 Clinical Trial Analysis: Geographical Distribution of Trials
- Figure 11.14 Clinical Trial Analysis: Geographical Distribution of Trials by Trial Phase and Trial Recruitment Status
- Figure 11.15 Clinical Trial Analysis: Geographical Distribution of Clinical Trials by Type of RNAi Molecule
- Figure 11.16 Clinical Trial Analysis: Geographical Distribution of Clinical Trials by Trial Phase and Type of RNAi Molecule
- Figure 11.17 Clinical Trial Analysis: Geographical Distribution of Clinical Trials by Therapeutic Area
- Figure 11.18 Clinical Trial Analysis: Geographical Distribution of Clinical Trials by Trial Phase and Therapeutic Area
- Figure 11.19 Clinical Trial Analysis: Geographical Distribution of Enrolled Patient Population
- Figure 11.20 Clinical Trial Analysis: Geographical Distribution of Enrolled Patient Population by Trial Phase and Trial Recruitment Status
- Figure 11.21 Clinical Trial Analysis: Geographical Distribution of Enrolled Patient Population by Type of RNAi Molecule
- Figure 11.22 Clinical Trial Analysis: Geographical Distribution of Enrolled Patient Population by Trial Phase and Type of RNAi Molecule
- Figure 11.23 Clinical Trial Analysis: Geographical Distribution of Enrolled Patient Population by Therapeutic Area
- Figure 11.24 Clinical Trial Analysis: Geographical Distribution of Enrolled Patient Population by Trial Phase and Therapeutic Area
- Figure 12.1 Key Opinion Leaders: Distribution by Type of Organization
- Figure 12.2 Key Opinion Leaders: Distribution by Qualification of KOLs
- Figure 12.3 Key Opinion Leaders: Distribution by Geography
- Figure 12.4 Key Opinion Leaders: Distribution by Number of Affiliations
- Figure 12.5 Scatter Plot: KOL Activeness v/s KOL Strength
- Figure 12.6 Most Prominent KOLs: Distribution by KOL Strength
- Figure 12.7 Most Prominent KOLs: Comparison of RA Score with Third-Party Score
- Figure 12.8 Most Prominent KOLs: Benchmarking Analysis
- Figure 12.9 Most Prominent KOLs: KOL Activeness v/s KOL Strength
- Figure 13.1 Patent Analysis: Distribution by Type of Patent
- Figure 13.2 Patent Analysis: Cumulative Distribution by Publication Year, 2016-2022
- Figure 13.3 Patent Analysis: Distribution by Patent Status
- Figure 13.4 Patent Analysis: Distribution by CPC Code
- Figure 13.5 Patent Analysis: Distribution by Type of Organization
- Figure 13.6 Patent Analysis: Distribution by Geography
- Figure 13.7 Patent Analysis: North America Scenario
- Figure 13.8 Patent Analysis: Europe Scenario
- Figure 13.9 Patent Analysis: Asia-Pacific Scenario
- Figure 13.10 Patent Analysis: Emerging Focus Areas
- Figure 13.11 Leading Players (Industry): Distribution by Number of Patents
- Figure 13.12 Leading Players (Non-Industry): Distribution by Number of Patents
- Figure 13.13 Patent Analysis: Benchmarking by Patent Characteristics
- Figure 13.14 Patent Analysis: Distribution by Patent Age, 2016-2022
- Figure 13.15 Patent Analysis: Patent Valuation
- Figure 14.1 Publication Analysis: Distribution by Year of Publication
- Figure 14.2 Publication Analysis: Distribution by Type of Publication
- Figure 14.3 Most Popular Keywords: Distribution by Key Focus Area
- Figure 14.4 Top Journals: Distribution by Number of Publications
- Figure 14.5 Top Publisher: Distribution by Number of Publications
- Figure 14.6 Key Copyright Holders: Distribution by Number of Instances
- Figure 14.7 Key Funding Institutes: Distribution by Number of Instances
- Figure 15.1 Recent Partnerships: Cumulative Year-Wise Trend, 2014-2022
- Figure 15.2 Recent Partnerships: Distribution by Type of Partnership
- Figure 15.3 Recent Partnerships: Year-wise Trend by Type of Partnership
- Figure 15.4 Recent Partnerships: Distribution by Type of RNA Molecule
- Figure 15.5 Recent Partnerships: Distribution by Scale of Partnership
- Figure 15.6 Recent Partnerships: Distribution by Therapeutic Area
- Figure 15.7 Most Active Players: Distribution by Number of Partnerships
- Figure 15.8 Recent Partnerships: Local and International Distribution
- Figure 15.9 Recent Partnerships: Intercontinental and Intracontinental Distribution
- Figure 16.1 Funding and Investment Analysis: Distribution by Type of Funding and Year of Establishment, 2014-2021
- Figure 16.2 Funding and Investment Analysis: Cumulative Distribution of Number of Instances by Year, 2014-2021
- Figure 16.3 Funding and Investment Analysis: Cumulative Amount Invested, 2014-2021 (USD Million)
- Figure 16.4 Funding and Investment Analysis: Distribution by Type of Funding and Year, 2014-2021
- Figure 16.5 Funding and Investment Analysis: Distribution of Instances by Type of Funding, 2014-2021
- Figure 16.6 Funding and Investment Analysis: Distribution of the Total Amount Invested by Type of Funding, 2014-2021 (USD Million)
- Figure 16.7 Funding and Investment Analysis: Distribution of Instances by Year and Type of Funding
- Figure 16.8 Funding and Investments Analysis: Distribution of Amount Invested by Type of RNAi Molecule
- Figure 16.9 Funding and Investment Analysis: Distribution by Geography
- Figure 16.10 Funding and Investment Analysis: Regional Distribution of Funding Instances
- Figure 16.11 Most Active Players: Distribution by Number of Instances, 2014-2021
- Figure 16.12 Most Active Players: Distribution by Amount Invested, 2014-2021 (USD Million)
- Figure 16.13 Key Investors: Distribution by Number of Instances
- Figure 16.14 Funding and Investment Summary, 2014-2021 (USD Million)
- Figure 17.1 Successful Drug Lauch Strategy: ROOTS Framework
- Figure 17.2 Successful Drug Lauch Strategy: Product Differentiation
- Figure 17.3 Commonly Adopted Commercialization Strategies based on Stage of Development of the Product
- Figure 17.4 Harvey Ball Analysis: Commercialization Strategies Adopted by RNAi-based Therapy Developers
- Figure 17.5 Approved RNAi Therapies: Snapshot of Promotional Activities on Product Websites
- Figure 17.6 Key Commercialization Strategies: Harvey Ball Analysis by Ease of Implementation, Value Addition and Current Adoption
- Figure 18.1 Circulating miRNA Biomarkers: Key Criteria
- Figure 18.2 Factors Influencing Cancer Screening
- Figure 18.3 Conventional Methods Used for Cancer Diagnosis
- Figure 18.4 Demerits of Biopsy
- Figure 19.1 RNAi Therapeutics: Types of Service Providers
- Figure 19.2 RNAi Therapeutic CROs: Distribution by Year of Establishment
- Figure 19.3 RNAi Therapeutic CROs: Distribution by Location of Headquarters
- Figure 19.4 RNAi Therapeutic CROs: Distribution by Company Size
- Figure 19.5 RNAi Therapeutic CROs: Distribution by Type of RNAi Molecule
- Figure 19.6 RNAi Therapeutic CMOs: Distribution by Year of Establishment
- Figure 19.7 RNAi Therapeutic CMOs: Distribution by Location of Headquarters
- Figure 19.8 RNAi Therapeutic CMOs: Distribution by Company Size
- Figure 19.9 RNAi Therapeutic CMOs: Distribution by Type of RNAi Molecule
- Figure 19.10 RNAi Therapeutic Consumable Providers and Other Service Providers: Distribution by Year of Establishment
- Figure 19.11 RNAi Therapeutic Consumable Providers: Distribution by Location of Headquarters
- Figure 19.12 RNAi Therapeutic Consumable Providers: Distribution by Company Size
- Figure 19.13 RNAi Therapeutic Consumable Providers: Distribution by Type of RNAi Molecule
- Figure 20.1 Global Demand for RNAi Therapeutics (Number of Patients)
- Figure 20.2 Global Clinical Demand for RNAi Therapeutics (Number of Patients)
- Figure 20.3 Global Clinical Demand for RNAi Therapeutics: Distribution by Type of RNAi Molecule (Number of Patients)
- Figure 20.4 Global Clinical Demand for RNAi Therapeutics: Distribution by Target Therapeutic Area (Number of Patients)
- Figure 20.5 Global Clinical Demand for RNAi Therapeutics: Distribution by Route of Administration (Number of Patients)
- Figure 20.6 Global Clinical Demand for RNAi Therapeutics: Distribution by Geography (Number of Patients)
- Figure 20.7 Global Commercial Demand for RNAi Therapeutics (Number of Patients)
- Figure 20.8 Global Commercial Demand for RNAi Therapeutics: Distribution by Type of RNAi Molecule (Number of Patients)
- Figure 20.9 Global Commercial Demand for RNAi Therapeutics: Distribution by Target Therapeutic Area (Number of Patients)
- Figure 20.10 Global Commercial Demand for RNAi Therapeutics: Distribution by Route of Administration (Number of Patients)
- Figure 20.11 Global Commercial Demand for RNAi Therapeutics: Distribution by Geography (Number of Patients)
- Figure 21.1 Global RNAi Therapeutics Market, 2022-2035 (USD Million)
- Figure 21.2 RNAi Therapeutics Market: Distribution by Type of RNAi Molecule, 2022, 2030 and 2035 (USD Million)
- Figure 21.3 RNAi Therapeutics Market: Distribution by Therapeutic Area, 2022, 2030 and 2035 (USD Million)
- Figure 21.4 RNAi Therapeutics Market: Distribution by Route of Administration, 2022, 2030 and 2035 (USD Million)
- Figure 21.5 RNAi Therapeutics Market: Distribution by Share of Leading Players, 2022, 2030 and 2035 (USD Million)
- Figure 21.6 RNAi Therapeutics Market: Distribution by Geography, 2022, 2030 and 2035 (USD Million)
- Figure 21.7 Onpattro Sales Forecast (Till 2035): Base Scenario (USD Million)
- Figure 21.8 Givlaari Sales Forecast (Till 2035): Base Scenario (USD Million)
- Figure 21.9 Leqvio Sales Forecast (Till 2035): Base Scenario (USD Million)
- Figure 21.10 Oxlumo Sales Forecast (Till 2035): Base Scenario (USD Million)
- Figure 21.11 Fitusiran Sales Forecast (Till 2035): Base Scenario (USD Million)
- Figure 21.12 Vutrisiran Sales Forecast (Till 2035): Base Scenario (USD Million)
- Figure 21.13 SYL 1001 Sales Forecast (Till 2035): Base Scenario (USD Million)
- Figure 21.14 Vigil-EWS Sales Forecast (Till 2035): Base Scenario (USD Million)
- Figure 21.15 Nedosiran Sales Forecast (Till 2035): Base Scenario (USD Million)
- Figure 22.1 RNAi Therapeutics: SWOT Analysis
- Figure 22.2 Comparison of SWOT Factors: Harvey Ball Analysis
- Figure 24.1 Concluding Remarks: Market Overview
- Figure 24.2 Concluding Remarks: Competitive Landscape
- Figure 24.3 Concluding Remarks: Company Competitiveness Analysis
- Figure 24.4 Concluding Remarks: Technology Competitiveness Analysis
- Figure 24.5 Concluding Remarks: Clinical Trial Analysis
- Figure 24.6 Concluding Remarks: Key Opinion Leaders
- Figure 24.7 Concluding Remarks: Patent Analysis
- Figure 24.8 Concluding Remarks: Publication Analysis
- Figure 24.9 Concluding Remarks: Recent Partnerships
- Figure 24.10 Concluding Remarks: Funding and Investment Analysis
- Figure 24.11 Concluding Remarks: Demand Analysis
- Figure 24.12 Concluding Remarks: Market Sizing and Opportunity Analysis
List OfTables
- Table 3.1 Merits and Demerits of RNAi Delivery Systems
- Table 3.2 Comparison between siRNA, miRNA and shRNA
- Table 4.1 RNAi Therapeutics: Marketed and Development Pipeline
- Table 4.2 RNAi Therapeutics: Information on Special Drug Designation
- Table 5.1 RNAi Therapeutics: List of Developers
- Table 7.1 RNAi Therapeutics: List of Marketed and Approved Products
- Table 7.2 Onpattro® (Patisiran): Drug Overview
- Table 7.3 Onpattro® (Patisiran): Information on Completed and Active Clinical Trials
- Table 7.4 Givlaari® (ALN-AS1): Drug Overview
- Table 7.5 Givlaari®: Information on Completed and Active Clinical Trials
- Table 7.6 Leqvio® (Inclisiran): Drug Overview
- Table 7.7 Leqvio® (Inclisiran): Information on Completed and Active Clinical Trials
- Table 7.8 Oxlumo® (Lumasiran): Drug Overview
- Table 7.9 Oxlumo® (Lumasiran): Information on Completed and Active Clinical Trials
- Table 7.10 Fitusiran (ALN-AT3): Drug Overview
- Table 7.11 Fitusiran (ALN-AT3): Information on Completed and Active Clinical Trials
- Table 7.12 Vutrisiran (ALN-TTRsc02): Drug Overview
- Table 7.13 Vutrisiran (ALN-TTRsc02): Information on Completed and Active Clinical Trials
- Table 7.14 SYL1001(Tivanisiran): Drug Overview
- Table 7.15 SYL1001(Tivanisiran): Information on Completed and Active Clinical Trials
- Table 7.16 Vigil-EWS: Drug Overview
- Table 7.17 Vigil-EWS: Information on Completed and Active Clinical Trials
- Table 7.18 Nedosiran: Drug Overview
- Table 7.19 Nedosiran: Completed and Active Clinical Trials
- Table 8.1 Self-deliverable RNA molecules
- Table 8.2 List of RNAi Technology / Platforms
- Table 8.3 List of RNAi Technology Developers
- Table 8.4 ESC-GalNAc: Pipeline Molecules
- Table 8.5 Protein Nanoparticle Delivery Technology: Pipeline Molecules
- Table 8.6 TRiM: Pipeline Molecules
- Table 8.7 GalXC: Pipeline Molecules
- Table 8.8 Vigil: Pipeline Molecules
- Table 8.9 mRNAi GOLD Platform: Pipeline Molecules
- Table 11.1 Clinical Trial Analysis: Key Therapeutic Candidates
- Table 11.2 Clinical Trial Analysis: Key Clinical Trials
- Table 12.1 Key Opinion Leaders: List of Principal Investigators Involved in Clinical Trials
- Table 13.1 Patent Analysis: CPC Code Definitions
- Table 13.2 Patent Analysis: Most Popular CPC Codes
- Table 13.3 Patent Analysis: List of Top CPC Codes
- Table 13.4 Patent Analysis: Summary of Benchmarking Analysis
- Table 13.5 Patent Analysis: List of Leading Patents (by Highest Relative Valuation)
- Table 14.1 RNAi Therapeutics: List of Publications
- Table 15.1 RNAi Therapeutics: List of Partnerships, 2014-2022
- Table 16.1 RNAi Therapeutics: List of Funding and Investments, 2014-2021
- Table 16.2 Funding and Investment Analysis: Summary of Investments
- Table 17.1 Onpattro®: Presentations in Conferences Before Product Approval
- Table 17.2 Givlaari®: Presentations in Conferences Before Product Approval
- Table 17.3 Oxlumo®: Presentations in Conferences Before Product Approval
- Table 17.4 Onpattro®: Presentations in Conferences After Product Approval
- Table 17.5 Leqvio®: Presentations in Conferences Before Product Approval
- Table 17.6 Approved RNAi Therapies: Patient Support Services Available on Product Websites (Comparative Analysis)
- Table 18.1 Cancer Survival Rate: Importance of / Information on Early Diagnosis
- Table 18.2 Cost of Biopsy for Different Cancer Indications (in USD)
- Table 18.3 Breast Cancer: Reported miRNA Biomarkers
- Table 18.4 Colorectal Cancer: Reported miRNA Biomarkers
- Table 18.5 Gastric Cancer: Reported miRNA Biomarkers
- Table 18.6 AML: Reported miRNA Biomarkers
- Table 18.7 de novo DLBCL: Reported miRNA Biomarkers
- Table 18.8 Lung Cancer: Reported miRNA Biomarkers
- Table 18.9 Prostate Cancer: Reported miRNA Biomarkers
- Table 18.10 Coronary Artery Disease: Reported miRNA Biomarkers
- Table 18.11 Myocardial Infarction: Reported miRNA Biomarkers
- Table 18.12 miRNA Diagnostic Tests: Pipeline
- Table 19.1 RNAi Therapeutics: List of CROs
- Table 19.2 RNAi Therapeutics: List of CMOs
- Table 19.3 RNAi Therapeutics: List of Consumables Providers and Other Service Providers
- Table 21.1 RNAi Therapeutics: Expected Launch Year of Advanced Stage Drug Candidates
- Table 21.2 Onpattro®: Target Patient Population
- Table 21.3 Onpattro®: Net Present Value (USD Million)
- Table 21.4 Onpattro®: Value Creation Analysis (USD Million)
- Table 21.5 Givlaari®: Target Patient Population
- Table 21.6 Givlaari®: Net Present Value (USD Million)
- Table 21.7 Givlaari®: Value Creation Analysis (USD Million)
- Table 21.8 Leqvio®: Target Patient Population
- Table 21.9 Leqvio®: Net Present Value (USD Million)
- Table 21.10 Leqvio®: Value Creation Analysis (USD Million)
- Table 21.11 Oxlumo®: Target Patient Population
- Table 21.12 Oxlumo®: Net Present Value (USD Million)
- Table 21.13 Oxlumo®: Value Creation Analysis (USD Million)
- Table 21.14 Fitusiran: Target Patient Population
- Table 21.15 Fitusiran: Net Present Value (USD Million)
- Table 21.16 Fitusiran: Value Creation Analysis (USD Million)
- Table 21.17 Vutrisiran: Target Patient Population
- Table 21.18 Vutrisiran: Net Present Value (USD Million)
- Table 21.19 Vutrisiran: Value Creation Analysis (USD Million)
- Table 21.20 SYL 1001: Target Patient Population
- Table 21.21 SYL 1001: Net Present Value (USD Million)
- Table 21.22 SYL 1001: Value Creation Analysis (USD Million)
- Table 21.23 Vigil-EWS: Target Patient Population
- Table 21.24 Vigil-EWS: Net Present Value (USD Million)
- Table 21.25 Vigil-EWS: Value Creation Analysis (USD Million)
- Table 21.26 Nedosiran: Target Patient Population
- Table 21.27 Nedosiran: Net Present Value (USD Million)
- Table 21.28 Nedosiran: Value Creation Analysis (USD Million)
- Table 22.1 RNAi Therapeutics: SWOT Analysis
- Table 22.2 Comparison of SWOT Factors: Harvey Ball Analysis
- Table 24.1 Concluding Remarks: Market Overview
- Table 24.2 Concluding Remarks: Competitive Landscape
- Table 24.3 Concluding Remarks: Company Competitiveness Analysis
- Table 24.4 Concluding Remarks: Technology Competitiveness Analysis
- Table 24.5 Concluding Remarks: Clinical Trial Analysis
- Table 24.6 Concluding Remarks: Key Opinion Leaders
- Table 24.7 Concluding Remarks: Patent Analysis
- Table 24.8 Concluding Remarks: Publication Analysis
- Table 24.9 Concluding Remarks: Recent Partnerships
- Table 24.10 Concluding Remarks: Funding and Investment Analysis
- Table 24.11 Concluding Remarks: Demand Analysis
- Table 24.12 Concluding Remarks: Market Sizing and Opportunity Analysis
- Table 25.1 RNAi Therapeutics: Distribution by Type of RNAi Molecule
- Table 25.2 RNAi Therapeutics: Distribution by Phase of Development
- Table 25.3 RNAi Therapeutics: Distribution by Type of Molecule and Phase of Development
- Table 25.4 RNAi Therapeutics: Distribution by Target Gene
- Table 25.5 RNAi Therapeutics: Distribution by Therapeutic Area
- Table 25.6 RNAi Therapeutics: Distribution by Route of Administration
- Table 25.7 RNAi Therapeutics: Distribution by Special Drug Designation
- Table 25.8 RNAi Therapeutics: Distribution by Special Drug Designation and Therapeutic Area
- Table 25.9 RNAi Therapeutics: Key Players
- Table 25.10 RNAi Therapeutics Developers: Distribution by Year of Establishment
- Table 25.11 RNAi Therapeutics Developers: Distribution by Company Size
- Table 25.12 RNAi Therapeutics Developers: Distribution by Location of Headquarters (Continent-wise)
- Table 25.13 RNAi Therapeutics Developers: Distribution by Location of Headquarters (Country-wise)
- Table 25.14 Most Active Players: Distribution by Number of Drug Candidates
- Table 25.15 RNAi Therapeutics: Regional Landscape
- Table 25.16 RNAi Technology Platforms: Distribution by Purpose of Technology / Platform
- Table 25.17 RNAi Technology Platforms: Distribution by Type of Molecule(s) Delivered
- Table 25.18 RNAi Technology Platforms: Distribution by Type of Cell(s) / Tissue(s) Targeted
- Table 25.19 RNAi Technology Developers: Distribution by Year of Establishment
- Table 25.20 RNAi Technology Developers: Distribution by Company Size
- Table 25.21 RNAi Technology Developers: Distribution by Location of Headquarters
- Table 25.22 RNAi Technology Developers: Distribution by Location of Headquarters (Country-wise)
- Table 25.23 RNAi Therapeutics for Oncological Disorders: Distribution by Target Indication and Phase of Development
- Table 25.24 RNAi Therapeutics for Oncological Disorders: Distribution by Type of RNAi Molecule
- Table 25.25 RNAi Therapeutics for Infectious Diseases: Distribution by Target Indication and Phase of Development
- Table 25.26 RNAi Therapeutics for Infectious Diseases: Distribution by Type of RNAi Molecule
- Table 25.27 RNAi Therapeutics for Metabolic Disorders: Distribution by Target Indication and Phase of Development
- Table 25.28 RNAi Therapeutics for Metabolic Disorders: Distribution by Type of RNAi Molecule
- Table 25.29 RNAi Therapeutics for Ophthalmic Diseases: Distribution by Target Indication and Phase of Development
- Table 25.30 RNAi Therapeutics for Ophthalmic Diseases: Distribution by Type of RNAi Molecule
- Table 25.31 RNAi Therapeutics for Genetic Disorders: Distribution by Target Indication and Phase of Development
- Table 25.32 RNAi Therapeutics for Genetic Disorders: Distribution by Type of RNAi Molecule
- Table 25.33 Clinical Trial Analysis: Cumulative Distribution by Trial Registration Year, Pre-2014-2022
- Table 25.34 Clinical Trial Analysis: Geographical Distribution of Trials by Start Year, Pre-2014 - 2022
- Table 25.35 Clinical Trial Analysis: Cumulative Distribution of Enrolled Patient Population by Start Year, Pre-2014 - 2022
- Table 25.36 Clinical Trial Analysis: Distribution of Enrolled Patient Population by Trial Phase
- Table 25.37 Clinical Trial Analysis: Distribution by Trial Recruitment Status and Phase of Development
- Table 25.38 Clinical Trial Analysis: Distribution by Type of Sponsor / Collaborator
- Table 25.39 Clinical Trial Analysis: Distribution by Type of RNAi Molecule and Trial Registration Year
- Table 25.40 Clinical Trial Analysis: Distribution by Type of RNAi Molecule and Trial Recruitment Status
- Table 25.41 Clinical Trial Analysis: Distribution by Type of RNAi Molecule and Phase of Development
- Table 25.42 Clinical Trial Analysis: Distribution by Therapeutic Area
- Table 25.43 Clinical Trial Analysis: Distribution by Therapeutic Area and Phase of Development
- Table 25.44 Clinical Trial Analysis: Geographical Distribution of Trials
- Table 25.45 Clinical Trial Analysis: Geographical Distribution of Trials by Trial Phase and Trial Recruitment Status
- Table 25.46 Clinical Trial Analysis: Geographical Distribution of Clinical Trials by Type of RNAi Molecule
- Table 25.47 Clinical Trial Analysis: Geographical Distribution of Clinical Trials by Trial Phase and Type of RNAi Molecule
- Table 25.48 Clinical Trial Analysis: Geographical Distribution of Clinical Trials by Therapeutic Area
- Table 25.49 Clinical Trial Analysis: Geographical Distribution of Clinical Trials by Trial Phase and Therapeutic Area
- Table 25.50 Clinical Trial Analysis: Geographical Distribution of Enrolled Patient Population
- Table 25.51 Clinical Trial Analysis: Geographical Distribution of Enrolled Patient Population by Trial Phase and Trial Recruitment Status
- Table 25.52 Clinical Trial Analysis: Geographical Distribution of Enrolled Patient Population by Type of RNAi Molecule
- Table 25.53 Clinical Trial Analysis: Geographical Distribution of Enrolled Patient Population by Trial Phase and Type of RNAi Molecule
- Table 25.54 Clinical Trial Analysis: Geographical Distribution of Enrolled Patient Population by Therapeutic Area
- Table 25.55 Clinical Trial Analysis: Geographical Distribution of Enrolled Patient Population by Trial Phase and Therapeutic Area
- Table 25.56 Key Opinion Leaders: Distribution by Type of Organization
- Table 25.57 Key Opinion Leaders: Distribution by Qualification of KOLs
- Table 25.58 Key Opinion Leaders: Distribution by Geography
- Table 25.59 Key Opinion Leaders: Distribution by Number of Affiliations
- Table 25.60 Most Prominent KOLs: Distribution by KOL Strength
- Table 25.61 Patent Analysis: Distribution by Type of Patent
- Table 25.62 Patent Analysis: Cumulative Distribution by Publication Year, 2016-2022
- Table 25.63 Patent Analysis: Distribution by Patent Status
- Table 25.64 Patent Analysis: Distribution by CPC Code
- Table 25.65 Patent Analysis: Distribution by Type of Organization
- Table 25.66 Patent Analysis: Distribution by Geography
- Table 25.67 Patent Analysis: North America Scenario
- Table 25.68 Patent Analysis: Europe Scenario
- Table 25.69 Patent Analysis: Asia-Pacific Scenario
- Table 25.70 Leading Players (Industry): Distribution by Number of Patents
- Table 25.71 Leading Players (Non-Industry): Distribution by Number of Patents
- Table 25.72 Patent Analysis: Distribution by Patent Age, 2016-2022
- Table 25.73 Patent Analysis: Patent Valuation
- Table 25.74 Publication Analysis: Distribution by Year of Publication
- Table 25.75 Publication Analysis: Distribution by Type of Publication
- Table 25.76 Most Popular Keywords: Distribution by Key Focus Area
- Table 25.77 Top Journals: Distribution by Number of Publications
- Table 25.78 Top Publisher: Distribution by Number of Publications
- Table 25.79 Key Copyright Holders: Distribution by Number of Instances
- Table 25.80 Key Funding Institutes: Distribution by Number of Instances
- Table 25.81 Recent Partnerships: Cumulative Year-Wise Trend, 2014-2022
- Table 25.82 Recent Partnerships: Distribution by Type of Partnership
- Table 25.83 Recent Partnerships: Year-wise Trend by Type of Partnership
- Table 25.84 Recent Partnerships: Distribution by Type of RNA Molecule
- Table 25.85 Recent Partnerships: Distribution by Scale of Partnership
- Table 25.86 Recent Partnerships: Distribution by Therapeutic Area
- Table 25.87 Most Active Players: Distribution by Number of Partnerships
- Table 25.88 Recent Partnerships: Local and International Distribution
- Table 25.89 Recent Partnerships: Intercontinental and Intracontinental Distribution
- Table 25.90 Funding and Investment Analysis: Distribution by Type of Funding and Year of Establishment, 2014-2021
- Table 25.91 Funding and Investment Analysis: Cumulative Distribution of Number of Instances by Year, 2014-2021
- Table 25.92 Funding and Investment Analysis: Cumulative Amount Invested, 2014-2021 (USD Million)
- Table 25.93 Funding and Investment Analysis: Distribution by Type of Funding and Year, 2014-2021
- Table 25.94 Funding and Investment Analysis: Distribution of Instances by Type of Funding, 2014-2021
- Table 25.95 Funding and Investment Analysis: Distribution of the Total Amount Invested by Type of Funding, 2014-2021 (USD Million)
- Table 25.96 Funding and Investment Analysis: Distribution of Instances by Year and Type of Funding
- Table 25.97 Funding and Investments Analysis: Distribution of Amount Invested by Type of RNAi Molecule
- Table 25.98 Funding and Investment Analysis: Distribution by Geography
- Table 25.99 Funding and Investment Analysis: Regional Distribution of Funding Instances
- Table 25.100 Most Active Players: Distribution by Number of Instances, 2014-2021
- Table 25.101 Most Active Players: Distribution by Amount Invested, 2014-2021 (USD Million)
- Table 25.102 Key Investors: Distribution by Number of Instances
- Table 25.103 RNAi Therapeutics: Types of Service Providers
- Table 25.104 RNAi Therapeutic CROs: Distribution by Year of Establishment
- Table 25.105 RNAi Therapeutic CROs: Distribution by Location of Headquarters
- Table 25.106 RNAi Therapeutic CROs: Distribution by Company Size
- Table 25.107 RNAi Therapeutic CROs: Distribution by Type of RNAi Molecule
- Table 25.108 RNAi Therapeutic CMOs: Distribution by Year of Establishment
- Table 25.109 RNAi Therapeutic CMOs: Distribution by Location of Headquarters
- Table 25.110 RNAi Therapeutic CMOs: Distribution by Company Size
- Table 25.111 RNAi Therapeutic CMOs: Distribution by Type of RNAi Molecule
- Table 25.112 RNAi Therapeutic Consumable Providers and Other Service Providers: Distribution by Year of Establishment
- Table 25.113 RNAi Therapeutic Consumable Providers: Distribution by Location of Headquarters
- Table 25.114 RNAi Therapeutic Consumable Providers: Distribution by Company Size
- Table 25.115 RNAi Therapeutic Consumable Providers: Distribution by Type of RNAi Molecule
- Table 25.116 Global Demand for RNAi Therapeutics (Number of Patients)
- Table 25.117 Global Clinical Demand for RNAi Therapeutics (Number of Patients)
- Table 25.118 Global Clinical Demand for RNAi Therapeutics: Distribution by Type of RNAi Molecule (Number of Patients)
- Table 25.119 Global Clinical Demand for RNAi Therapeutics: Distribution by Target Therapeutic Area (Number of Patients)
- Table 25.120 Global Clinical Demand for RNAi Therapeutics: Distribution by Route of Administration (Number of Patients)
- Table 25.121 Global Clinical Demand for RNAi Therapeutics: Distribution by Geography (Number of Patients)
- Table 25.122 Global Commercial Demand for RNAi Therapeutics (Number of Patients)
- Table 25.123 Global Commercial Demand for RNAi Therapeutics: Distribution by Type of RNAi Molecule (Number of Patients)
- Table 25.124 Global Commercial Demand for RNAi Therapeutics: Distribution by Target Therapeutic Area (Number of Patients)
- Table 25.125 Global Commercial Demand for RNAi Therapeutics: Distribution by Route of Administration (Number of Patients)
- Table 25.126 Global Commercial Demand for RNAi Therapeutics: Distribution by Geography (Number of Patients)
- Table 25.127 Global RNAi Therapeutics Market, 2022-2035 (USD Million)
- Table 25.128 RNAi Therapeutics Market: Distribution by Type of RNAi Molecule, 2022, 2030 and 2035 (USD Million)
- Table 25.129 RNAi Therapeutics Market: Distribution by Therapeutic Area, 2022, 2030 and 2035 (USD Million)
- Table 25.130 RNAi Therapeutics Market: Distribution by Route of Administration, 2022, 2030 and 2035 (USD Million)
- Table 25.131 RNAi Therapeutics Market: Distribution by Share of Leading Players, 2022, 2030 and 2035 (USD Million)
- Table 25.132 RNAi Therapeutics Market: Distribution by Geography, 2022, 2030 and 2035 (USD Million)
- Table 25.133 Onpattro Sales Forecast (Till 2035): Base Scenario (USD Million)
- Table 25.134 Givlaari Sales Forecast (Till 2035): Base Scenario (USD Million)
- Table 25.135 Leqvio Sales Forecast (Till 2035): Base Scenario (USD Million)
- Table 25.136 Oxlumo Sales Forecast (Till 2035): Base Scenario (USD Million)
- Table 25.137 Fitusiran Sales Forecast (Till 2035): Base Scenario (USD Million)
- Table 25.138 Vutrisiran Sales Forecast (Till 2035): Base Scenario (USD Million)
- Table 25.139 SYL 1001 Sales Forecast (Till 2035): Base Scenario (USD Million)
- Table 25.140 Vigil-EWS Sales Forecast (Till 2035): Base Scenario (USD Million)
- Table 25.141 Nedosiran Sales Forecast (Till 2035): Base Scenario (USD Million)
List OfCompanies
The following companies and organizations have been mentioned in the report
- 1. 1Globe Health Institute
- 2. 20Med Therapeutics
- 3. Adhera Therapeutics
- 4. Advirna
- 5. Ajinomoto Bio-Pharma Services
- 6. Alexion Pharmaceuticals
- 7. Allele Biotechnology
- 8. Alnylam Pharmaceuticals
- 9. Altogen Labs
- 10. AM Chemicals
- 11. Amgen
- 12. AMSBIO
- 13. Anjarium Biosciences
- 14. Applied Biological Materials (abm)
- 15. Arbutus Biopharma
- 16. Arcturus Therapeutics
- 17. ARIZ Precision Medicine
- 18. Aro Biotherapeutics
- 19. Arrowhead Pharmaceuticals
- 20. Ascletis Pharma
- 21. AstraZeneca
- 22. Atlanta Therapeutics
- 23. AUM LifeTech
- 24. Avidity Biosciences
- 25. Benitec Biopharma
- 26. BianoScience
- 27. Bioasis Technologies
- 28. BioAxone BioSciences
- 29. Biomics Biopharma
- 30. Bioneer
- 31. Biosettia
- 32. BioSpring
- 33. Bio-Synthesis
- 34. bluebird bio
- 35. Boehringer Ingelheim
- 36. Boston Children's Hospital
- 37. BR Biochem Life Sciences
- 38. Bristol-Myers Squibb
- 39. Calimmune (Acquired by CSL Behring)
- 40. Cell Signaling Technology
- 41. Cellecta
- 42. Celsion
- 43. Certara
- 44. Charles River Laboratories
- 45. CMIC Group
- 46. CordenPharma
- 47. Creative Animodel
- 48. Creative Biogene
- 49. Creative Biolabs
- 50. CUSABIO TECHNOLOGY
- 51. Dharmacon (Acquired by Horizon Discovery)
- 52. Dicerna Pharmaceuticals
- 53. Eli Lilly
- 54. Entos Pharmaceuticals
- 55. Eurofins Genomics
- 56. Eurogentec
- 57. Evotec
- 58. Exiqon
- 59. GCC Biotech
- 60. GeneCopoeia
- 61. GeneCust
- 62. GeneDesign (Acquired by Ajinomoto Bio-Pharma Services)
- 63. Genel
- 64. GenePharma
- 65. Genevant Sciences
- 66. GlaxoSmithKline
- 67. Gradalis
- 68. Halo-Bio RNAi Therapeutics
- 69. Hansoh Pharma
- 70. HISTALIM
- 71. Horizon Therapeutics
- 72. Hugel
- 73. IIDong Pharmaceutical
- 74. Integrated DNA Technologies
- 75. InteRNA Technologies
- 76. iTherapeutics
- 77. Janssen Pharmaceuticals
- 78. Kanglin Biotec
- 79. LC Sciences
- 80. Lemonex
- 81. LGC, Biosearch Technologies
- 82. Mallinckrodt Pharmaceuticals
- 83. MD Anderson Cancer Center
- 84. Microsynth
- 85. miReven
- 86. Mirimus
- 87. Mirus Bio
- 88. MultiplexDX
- 89. NanoDe Therapeutics
- 90. NantWorks
- 91. National Cancer Institute (NCI)
- 92. Netherlands Organisation for Health Research and Development (ZonMw)
- 93. Nitto BioPharma
- 94. Nitto Denko
- 95. Nitto Denko Avecia
- 96. Novartis (The Medicines Company)
- 97. Novo Nordisk
- 98. Nucleome Informatics
- 99. Oligoengine
- 100. OliX Pharmaceuticals
- 101. OriGene Technologies
- 102. OZ Biosciences
- 103. PCI Biotech
- 104. Phalanx Biotech
- 105. Pharmaron
- 106. Phio Pharmaceuticals (previously Rxi Pharmaceuticals)
- 107. Phyzat
- 108. Polyplus-transfection
- 109. Promega
- 110. QIAGEN
- 111. Quark Pharmaceuticals
- 112. Radboud University
- 113. Regen BioPharma
- 114. Regeneron
- 115. Regulus Therapeutics
- 116. RiboBio
- 117. Roche
- 118. Sanofi Genzyme
- 119. Santa Cruz Biotechnology
- 120. Shanghai Biotechnology
- 121. Shanghai Public Health Clinical Center
- 122. Sigma-Aldrich
- 123. Silence Therapeutics
- 124. Silenseed
- 125. SIRION Biotech
- 126. Sirnaomics
- 127. siTools Biotech
- 128. Soluventis
- 129. SomaGenics
- 130. Sumitomo Chemical
- 131. Suzhou Ribo Life Science
- 132. Sylentis
- 133. Syngene
- 134. Takara Bio
- 135. Takeda Pharmaceuticals
- 136. tebu-bio
- 137. Théa Open Innovation
- 138. Thermo Fisher Scientific
- 139. Transgene Biotek
- 140. Translate Bio (Acquired by Sanofi)
- 141. Transomic Technologies
- 142. TriPhos Therapeutics
- 143. UCSF Diabetes Research Center (DRC) Lentiviral RNAi Core
- 144. University of Virginia School of Medicine
- 145. Vector Biolabs
- 146. Vir Biotechnology
- 147. Viridian Therapeutics
- 148. ViThera
- 149. Westen Biotechnology

