
PUBLISHER: Tariff Consultancy Ltd | PRODUCT CODE: 1163417

PUBLISHER: Tariff Consultancy Ltd | PRODUCT CODE: 1163417
The Asia-Pacific Data Centre Landscape 2022 to 2026: Covers Australia, China, Hong Kong, Indonesia, Japan, Korea (South), Malaysia, New Zealand, Philippines, Singapore, Thailand and Vietnam
Data Centre growth rates in the Asia Pacific remain strong with average rate of growth in Data Centre space, power and revenue forecast for the 4-year period to the end of 2026 is to be 50 per cent.
Datacentrepricing latest research covering the Asia-Pacific region reveals that the Data Centre growth rates in the Asia Pacific remain strong with average rate of growth in Data Centre space, power and revenue forecast for the four-year period to the end of 2026 is to be 50 per cent.
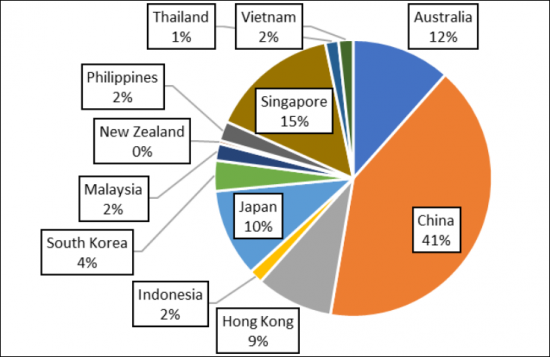
Datacentrepricing forecasts that China will account for 41 per cent of Data Centre revenues in the Asia Pacific region, followed by Singapore, Australia and Japan being the next highest markets (in percentage terms), table below shows the Data Centre revenues forecast for each of the twelve surveyed countries.
This 120+ page report covers twelve countries namely Australia, China, Hong Kong, Indonesia, Japan, Korea (South), Malaysia, New Zealand, Philippines, Singapore, Thailand and Vietnam.
Some of the key findings include:
- Data Centre growth rates in the Asia-Pacific region remains strong. The average rate of growth in Data Centre space, power and revenue forecast for the four-year period to the end of 2026 is to be 50 per cent, with South Korea to have a growth rate of over 100 per cent for the same period - with Australia and Singapore to have among the lowest growth rates. Australia and Singapore are both mature markets with over 400,000 m2 of installed Data Centre space, and have attracted a range of hyperscale and cloud investments. Singapore is constrained by a shortage of power and land for Data Centre development with power being rationed by the Government.
- New Data Centres are mostly being built in Metro city areas: The Metro city area is attractive as it is close to large population centres - with around half of the Data Centre power in the 12 Asia Pacific country markets being located in 17 Data Centre city clusters.
- The existing Data Centre locations (particularly Singapore & Hong Kong) face challenges: Singapore and Hong Kong both face power constraints, with most power being imported with limited renewable power capacity. The constraints on developments in Singapore & Hong Kong provides an opportunity for other markets:
- The Australian Data Centre market has become one of the largest in Asia: Australia has benefitted from the creation of large campus Data Centres in the Melbourne and Sydney areas, with AirTrunk (Melbourne) developing three campuses with up to 370 MW of power in total and NEXT DC (Melbourne) also developing two campuses with up to 120 MW of power.
- The Asia Pacific market is being powered by demand for the cloud: Cloud expansion is underpinning the business case for Data Centre construction leading to demand for new hyperscale facilities. The entry of new investors including private equity investors and Data Centre Providers is spurring development in new hyperscale facilities.
- There is some uncertainty about future Data Centre pricing and the revenue outlook: Overall Datacentrepricing forecasts that Asia Pacific Data Centre pricing will continue to rise despite the increase in new space and facilities taking place.
“Data Centre Asia-Pacific Landscape report - 2022 to 2026” provides a unique survey of the third-party Data Centre market in twelve Asia-Pacific countries.
Part I examinies the top ten in the region from the end of 2022 to the end of 2026, with Part II providing Data Centre space, power, key providers & new developments with Part III providing a forecast for each surveyed country.
Geographical coverage:
|
|
Table of Contents
Methodology used in the report
Executive Summary
Part 1 - The Top Ten key Asia Pacific Data Centre Trends from the end of 2022 to the end of 2026 - A qualitative survey of the Top Ten Data Centre Trends in the Asia Pacific Region from the end of 2022 to the end of 2026
Summary Box - The Top 10 Data Centre Trends in the Asia Pacific region
- Trend 1 - The continued rise of China as the 2nd largest Data Centre market in the world
- Trend 2 - The rise of new investment from private equity investors
- Trend 3 - The constraints on new Data Centre investments in Singapore
- Trend 4 - The new Asia Pacific Data Centre markets are out-performing the rest (Indonesia, Malaysia & the Philippines)
- Trend 5 - The impact of Acquisition and Mergers in the Asia Pacific Region
- Trend 6 - The challenge of providing sufficient power in the Asia Pacific Region
- Trend 7 - The importance of providing sustainable or renewable energy in the region
- Trend 8 - The emergence of new Data Centre Metro city markets in the Asia Pacific region
- Trend 9 - The changes in new technology required to support more sustainable Data Centres in the region
- Trend 10 - The key changes in the Asia Pacific Data Centre market as of 2030
Part 2 - The Data Centre Landscape for each of the 12 Data Centre countries in the Asia Pacific region
DCP provides an overview of the Data Centre Landscape in each of the 12 Asia Pacific Data Centre markets. The overview for each of the 12 country markets include:
- Details of the Data Centre facilities with floor space and power in each country market
- Details of the new Data Centre developments planned
- Summary of each Asia Pacific Country Market
Part 3 - Asia Pacific Data Centre Trends - The key conclusions, trends & forecasts from the Asia Pacific Data Centre Trends report - from the end of 2022 to the end of 2026
- The key trends in the Asia Pacific region for Data Centres
- A forecast for Data Centre raised floor space from the end of 2022 to the end of 2026
- A forecast for Data Centre Customer Power from the end of 2022 to the end of 2026
- A forecast for Data Centre utilisation in the Asia Pacific region
- A forecast for Data Centre pricing in the Asia Pacific region
- A forecast for Data Centre revenues from the end of 2022 to the end of 2026
- The Key Conclusions for the Asia Pacific Data Centre Trends report
A list of Figures - The DCP Asia Pacific Data Centre Trends report
- Figure 1 - A Pie Chart showing Data Centre raised floor space by Asia Pacific country as of the end of 2022
- Figure 2 - A Pie Chart showing the populations of the twelve countries in the Asia Pacific shown in per cent
- Figure 3 - A chart showing the Data Centre stages of evolution worldwide (Brookfield Investment Partners)
- Figure 4 - A table showing the Digital Edge Data Centre investments being made in the Asia Pacific region
- Figure 5 - A table showing the PDG XL Data Centre facilities in Indonesia
- Figure 6 - A picture showing the proposed PDG JC2 Indonesia Data Centre facility
- Figure 7 - A table summarising the major investments in Data Centres by Private Equity groups in millions of USD - up to the end of October 2021
- Figure 8 - A map showing the locations of the GDS Data Centres at Johor Bahau (Malaysia) & Batam (Indonesia)
- Figure 9 - A chart showing the percentage growth in Asia Pacific region Data Centre revenues by country market - forecast from the end of 2022 to the end of 2026
- Figure 10 - An impression of the proposed Dreamline Co. Data Centre facility, South Korea
- Figure 11 - A table showing the key Asia Pacific Data Centre city metros in the Asia Pacific region
- Figure 12 - A picture showing the proposed FDCP project in Singapore
- Figure 13 - A table showing a summary of the Australian third-party Data Centre market
- Figure 14 - A table showing the forecast third-party Australian Data Centre as of the end of 2022
- Figure 15 - A screenshot showing the AirTrunk Australia SYD-02 Data Centre facility
- Figure 16 - A picture showing the proposed CDC EC4 Data Centre facility
- Figure 17 - A picture showing the proposed DC Two Collie Data Centre facility with greenhouses
- Figure 18 - A picture showing the proposed DCI Data Centers Sydney SYD-02 facility
- Figure 19 - A picture showing the proposed Equinix Perth PE-03 Data Centre facility
- Figure 20 - A table showing the proposed Stack Infrastructure Australia Data Centre facilities
- Figure 21 - A picture showing the proposed Next DC Darwin (D1) Data Centre facility
- Figure 22 - A picture showing a picture of the xScale Sydney SY09x Data Centre facility
- Figure 23 - A table showing a summary of the Chinese third-party Data Centre market
- Figure 24 - A picture showing the GDS Holdings Shanghai Pujiang area Data Centre campus
- Figure 25 - A table showing a summary of the Hong Kong Data Centre market
- Figure 26 - A table showing the forecast Hong Kong third-party Data Centre market as of the end of 2022
- Figure 27 - A map showing the location of the proposed and existing i-advantage Data Centres
- Figure 28 - A picture showing the proposed i-advantage Mega-IDC facility at TKO
- Figure 29 - A table showing a summary of the Indonesian Data Centre market
- Figure 30 - A table showing the forecast Indonesian third-party Data Centre market as of the end of 2022
- Figure 31 - A table showing a summary of the Japanese Data Centre market
- Figure 32 - A table showing the forecast Japanese third-party Data Centre market as of the end of 2022
- Figure 33 - A picture showing the proposed development of the AirTrunk TOK-1 and TOK-2 Data Centre facilities
- Figure 34 - A table showing a summary of the South Korean Data Centre market
- Figure 35 - A table showing the forecast South Korean third-party Data Centre market as of the end of 2022
- Figure 36 - A table showing a summary of the Malaysia Data Centre market
- Figure 37 - A table showing the forecast Malaysian third-party Data Centre market as of the end of 2022
- Figure 38 - A table showing a summary of the New Zealand Data Centre market
- Figure 39 - A table showing the forecast New Zealand third-party Data Centre market as of the end of 2022
- Figure 40 - A picture showing the proposed DC Data Centres AKL02 facility, New Zealand
- Figure 41 - A table showing a summary of the Philippines Data Centre market
- Figure 42 - A table showing the forecast Philippines third-party Data Centre market as of the end of 2022
- Figure 43 - A picture showing the proposed SpaceDC MNL-1 Data Centre facility, the Philippines
- Figure 44 - A table showing the Singaporean Data Centre market
- Figure 45 - A table showing the forecast Singaporean third-party Data Centre market as of the end of 2022
- Figure 46 - A picture showing the Facebook (Meta) Data Centre in Singapore
- Figure 47 - A table showing a summary of the Thai Data Centre market
- Figure 48 - A table showing the forecast Thai third-party Data Centre market as of the end of 2022
- Figure 49 - A table showing a summary of the Vietnamese Data Centre market
- Figure 50 - A table showing the forecast Vietnamese third-party Data Centre market as of the end of 2022
- Figure 51 - A picture showing the NTT Global Data Centers HCMC1 facility (Vietnam)
- Figure 52 - A chart showing the growth in Data Centre raised floor space by Asia Pacific country market
- Figure 53 - A pie chart showing the country market share of Data Centre space as of the end of 2022 in per cent
- Figure 54 - A chart showing forecast Australian Data Centre raised floor space from the end of 2022 to the end of 2026 in m2
- Figure 55 - A chart showing forecast Chinese Data Centre raised floor space from the end of 2022 to the end of 2026 in m2
- Figure 56 - A chart showing forecast Hong Kong Data Centre raised floor space from the end of 2022 to the end of 2026 in m2
- Figure 57 - A chart showing forecast Indonesian Data Centre raised floor space from the end of 2022 to the end of 2026 in m2
- Figure 58 - A chart showing forecast Japanese Data Centre raised floor space from the end of 2022 to the end of 2026 in m2
- Figure 59 - A chart showing forecast South Korean Data Centre raised floor space from the end of 2022 to the end of 2026 in m2
- Figure 60 - A chart showing forecast Malaysian Data Centre raised floor space from the end of 2022 to the end of 2026 in m2
- Figure 61 - A chart showing forecast New Zealand Data Centre raised floor space from the end of 2022 to the end of 2026 in m2
- Figure 62 - A chart showing forecast Philippines Data Centre raised floor space from the end of 2022 to the end of 2026 in m2
- Figure 63 - A chart showing forecast Singaporean Data Centre raised floor space from the end of 2022 to the end of 2026 in m2
- Figure 64 - A chart showing forecast Thai Data Centre raised floor space from the end of 2022 to the end of 2026 in m2
- Figure 65 - A chart showing forecast Vietnamese Data Centre raised floor space from the end of 2022 to the end of 2026 in m2
- Figure 66 - A table showing a Data Centre raised floor forecast for the Asia Pacific region from the end of 2022 to the end of 2026 in m2
- Figure 67 - A chart showing the forecast increase in Data Centre space by country market from the end of 2022 to the end of 2026 in m2
- Figure 68 - A chart showing the percentage increase in Data Centre space by country market from the end of 2022 to the end of 2026
- Figure 69 - A chart showing forecast Australian DCCP from the end of 2022 to the end of 2026 in MW
- Figure 70 - A chart showing forecast Chinese DCCP from the end of 2022 to the end of 2026 in MW
- Figure 71 - A chart showing forecast Hong Kong DCCP from the end of 2022 to the end of 2026 in MW
- Figure 72 - A chart showing forecast Indonesian DCCP from the end of 2022 to the end of 2026 in MW
- Figure 73 - A chart showing forecast Japanese DCCP from the end of 2022 to the end of 2026 in MW
- Figure 74 - A chart showing forecast South Korean DCCP from the end of 2022 to the end of 2026 in MW
- Figure 75 - A chart showing forecast Malaysian DCCP from the end of 2022 to the end of 2026 in MW
- Figure 76 - A chart showing forecast New Zealand DCCP from the end of 2022 to the end of 2026 in MW
- Figure 77 - A chart showing forecast Philippines DCCP from the end of 2022 to the end of 2026 in MW
- Figure 78 - A chart showing forecast Singaporean DCCP from the end of 2022 to the end of 2026 in MW
- Figure 79 - A chart showing forecast Thai DCCP from the end of 2022 to the end of 2026 in MW
- Figure 80 - A chart showing forecast Vietnamese DCCP from the end of 2022 to the end of 2026 in MW
- Figure 81 - A table showing DCCP forecast for the Asia Pacific region from the end of 2022 to the end of 2026 in MW
- Figure 82 - A chart showing the forecast percentage growth in DCCP by country market from the end of 2022 to the end of 2026
- Figure 83 - A table showing Australian average rack space, m2 & kw pricing forecast from the end of 2022 to the end of 2026 in USD/m
- Figure 84 - A table showing Chinese average rack space, m2 & kw pricing forecast from the end of 2022 to the end of 2026 in USD/m
- Figure 85 - A table showing Hong Kong average rack space, m2 & kw pricing forecast from the end of 2022 to the end of 2026 in USD/m
- Figure 86 - A table showing Indonesian average rack space, m2 & kw pricing forecast from the end of 2022 to the end of 2026 in USD/m
- Figure 87 - A table showing Japanese average rack space, m2 & kw pricing forecast from the end of 2022 to the end of 2026 in USD/m
- Figure 88 - A table showing Korean average rack space, m2 & kw pricing forecast from the end of 2022 to the end of 2026 in USD/m
- Figure 89 - A table showing Malaysian average rack space, m2 & kw pricing forecast from the end of 2022 to the end of 2026 in USD/m
- Figure 90 - A table showing New Zealand average rack space, m2 & kw pricing forecast from the end of 2022 to the end of 2026 in USD/m
- Figure 91 - A table showing Filipino average rack space, m2 & kw pricing forecast from the end of 2022 to the end of 2026 in USD/m
- Figure 92 - A table showing Singaporean average rack space, m2 & kw pricing forecast from the end of 2022 to the end of 2026 in USD/m
- Figure 93 - A table showing Thai average rack space, m2 & kw pricing forecast from the end of 2022 to the end of 2026 in USD/m
- Figure 94 - A table showing Vietnamese average rack space, m2 & kw pricing forecast from the end of 2022 to the end of 2026 in USD/m
- Figure 95 - A table showing the forecast average Data Centre utilisation level by each of the 12 Asia Pacific Countries from the end of 2022 to the end of 2026 in per cent
- Figure 96 - A chart showing forecast Australian Data Centre revenues from the end of 2022 to the end of 2026 in millions of USD per annum
- Figure 97 - A chart showing forecast Chinese Data Centre revenues from the end of 2022 to the end of 2026 in millions of USD per annum
- Figure 98 - A chart showing forecast Hong Kong Data Centre revenues from the end of 2022 to the end of 2026 in millions of USD per annum
- Figure 99 - A chart showing forecast Indonesian Data Centre revenues from the end of 2022 to the end of 2026 in millions of USD per annum
- Figure 100 - A chart showing forecast Japanese Data Centre revenues from the end of 2022 to the end of 2026 in millions of USD per annum
- Figure 101 - A chart showing forecast Korean Data Centre revenues from the end of 2022 to the end of 2026 in millions of USD per annum
- Figure 102 - A chart showing forecast Malaysian Data Centre revenues from the end of 2022 to the end of 2026 in millions of USD per annum
- Figure 103 - A chart showing forecast New Zealand Data Centre revenues from the end of 2022 to the end of 2026 in millions of USD per annum
- Figure 104 - A chart showing forecast Filipino Data Centre revenues from the end of 2022 to the end of 2026 in millions of USD per annum
- Figure 105 - A chart showing forecast Singaporean Data Centre revenues from the end of 2022 to the end of 2026 in millions of USD per annum
- Figure 106 - A chart showing forecast Thai Data Centre revenues from the end of 2022 to the end of 2026 in millions of USD per annum
- Figure 107 - A chart showing forecast Vietnamese Data Centre revenues from the end of 2022 to the end of 2026 in millions of USD per annum
- Figure 108 - A table showing a revenue forecast for Asia Pacific region Data Centres from the end of 2022 to the end of 2026 in millions of USD per annum
- Figure 109 - A chart showing a revenue forecast for Asia Pacific region Data Centres from the end of 2022 to the end of 2026 in per cent
- Figure 110 - A pie chart showing Data Centre revenues by country market in per cent
- Figure 111 - A chart showing the percentage increase in Asia Pacific Data Centre revenues from the end of 2022 to the end of 2026
- Figure 112 - A table showing a summary of the Chinese Data Centre market
- Figure 113 - A table showing the Data Centre Providers included in the report
- Figure 114 - A table showing the exchange rates used in the report converted into USD $1

