
PUBLISHER: Allied Market Research | PRODUCT CODE: 1414739

PUBLISHER: Allied Market Research | PRODUCT CODE: 1414739
Carbon Graphite Market By Product (Carbon and Graphite Electrodes, Carbon and Graphite Fibers, Carbon and Graphite Powder, Others), By End-user Industry (Industrial, Aerospace, Others): Global Opportunity Analysis and Industry Forecast, 2023-2032
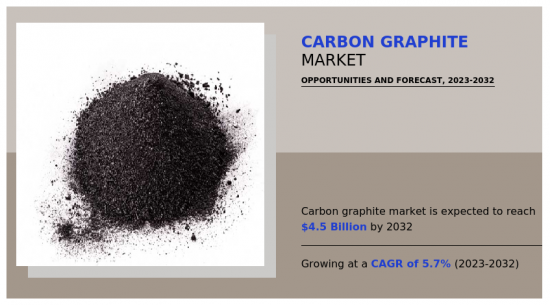
According to a new report published by Allied Market Research, titled, "Carbon Graphite Market," The carbon graphite market was valued at $2.6 billion in 2022, and is estimated to reach $4.5 billion by 2032, growing at a CAGR of 5.7% from 2023 to 2032.
The report provides competitive dynamics by evaluating business segments, product portfolios, target market revenue, geographical presence and key strategic developments by prominent manufacturers.
The study contains qualitative information such as
1) the market dynamics (drivers, restraints, challenges, and opportunities), key regulation analysis, pricing analysis, and Porter's Five Force Analysis across North America, Europe, Asia-Pacific, LAMEA regions.
Latest trends in global carbon graphite market such as
1) undergoing R&D activities, public policies, and government initiatives are analyzed across 16 countries in 4 different regions.
More than 3,000 carbon graphite-related product literatures, industry releases, annual reports, and other such documents of key industry participants along with authentic industry journals and government websites have been reviewed for generating high-value industry insights for global carbon graphite market.
Carbon graphite, also known as graphite, is a crystalline form of the chemical element carbon. It is composed of carbon atoms arranged in a hexagonal lattice structure, and it is one of the allotropic forms of carbon, along with diamond and amorphous carbon. Graphite is characterized by its distinct properties, including lubrication, electrical conductivity, and thermal conductivity. It is a solid material with a layered structure, where individual layers of carbon atoms are weakly bonded together. This unique structure gives graphite its slippery and solid lubricant properties. Graphite has a wide range of industrial and commercial applications, such as
1) in the production of electrodes, lubricants, refractory materials, heat sinks, and various other products in industries such as
1) aerospace, automotive, and electronics.
Carbon graphite is used in wind turbines and solar panels due to its electrical conductivity and mechanical strength. The expansion of renewable energy sources contributes to the growth of the carbon graphite market.
Moreover, carbon graphite materials are used in various automotive applications, including brake pads, clutches, and gaskets. As the automotive industry continues to grow and evolve, the demand for lightweight and high-performance materials such as
1) carbon graphite is on the rise.
However, the availability of high-quality graphite feedstock can be limited, and the extraction and processing of such materials can face environmental and sustainability challenges, impacting the supply chain.
On the contrary, the development and adoption of green technologies, such as
1) carbon capture and storage (CCS) systems, present opportunities for carbon graphite in CO2 capture and transport.
The carbon graphite market is segmented on the basis of product, end-user industry, and region. On the basis of product, the market is categorized into carbon and graphite electrodes, carbon and graphite fibers, carbon and graphite powder, and others. On the basis of end-user industry, it is divided into industrial, aerospace, and others. Region-wise, the market is studied across North America, Europe, Asia-Pacific, and LAMEA.
The global carbon graphite market profiles leading players that include IBIDEN, Entegris, Nippon Carbon, SEC Carbon, GrafTech International Limited, Graphite India Ltd., Schunk, Fangda Carbon New Material Co., Ltd, Datong XinCheng, and Sinosteel Engineering and Technology Co., Ltd.
The global caron graphite market report provides in-depth competitive analysis as well as profiles of these major players.
Key Benefits For Stakeholders
- This report provides a quantitative analysis of the market segments, current trends, estimations, and dynamics of the carbon graphite market analysis from 2022 to 2032 to identify the prevailing carbon graphite market opportunities.
- The market research is offered along with information related to key drivers, restraints, and opportunities.
- Porter's five forces analysis highlights the potency of buyers and suppliers to enable stakeholders make profit-oriented business decisions and strengthen their supplier-buyer network.
- In-depth analysis of the carbon graphite market segmentation assists to determine the prevailing market opportunities.
- Major countries in each region are mapped according to their revenue contribution to the global market.
- Market player positioning facilitates benchmarking and provides a clear understanding of the present position of the market players.
- The report includes the analysis of the regional as well as global carbon graphite market trends, key players, market segments, application areas, and market growth strategies.
Additional benefits you will get with this purchase are:
- Quarterly Update and* (only available with a corporate license, on listed price)
- 5 additional Company Profile of client Choice pre- or Post-purchase, as a free update.
- Free Upcoming Version on the Purchase of Five and Enterprise User License.
- 16 analyst hours of support* (post-purchase, if you find additional data requirements upon review of the report, you may receive support amounting to 16 analyst hours to solve questions, and post-sale queries)
- 15% Free Customization* (in case the scope or segment of the report does not match your requirements, 15% is equivalent to 3 working days of free work, applicable once)
- Free data Pack on the Five and Enterprise User License. (Excel version of the report)
- Free Updated report if the report is 6-12 months old or older.
- 24-hour priority response*
- Free Industry updates and white papers.
Possible Customization with this report (with additional cost and timeline, please talk to the sales executive to know more)
- Manufacturing Capacity
- Investment Opportunities
- Senario Analysis & Growth Trend Comparision
- Technology Trend Analysis
- Market share analysis of players by products/segments
- New Product Development/ Product Matrix of Key Players
- Regulatory Guidelines
- Additional company profiles with specific to client's interest
- Additional country or region analysis- market size and forecast
- Expanded list for Company Profiles
- Historic market data
- Import Export Analysis/Data
- List of customers/consumers/raw material suppliers- value chain analysis
- Market share analysis of players at global/region/country level
- SWOT Analysis
- Volume Market Size and Forecast
Key Market Segments
By Product
- Carbon and Graphite Electrodes
- Carbon and Graphite Fibers
- Carbon and Graphite Powder
- Others
By End-user Industry
- Industrial
- Aerospace
- Others
By Region
- North America
- U.S.
- Canada
- Mexico
- Europe
- Germany
- UK
- France
- Spain
- Italy
- Rest of Europe
- Asia-Pacific
- China
- India
- Japan
- South Korea
- Australia
- Rest of Asia-Pacific
- LAMEA
- Brazil
- Saudi Arabia
- South Africa
- Rest of LAMEA
Key Market Players:
- Entegris
- IBIDEN
- Nippon Carbon Co Ltd.
- SEC CARBON, LIMITED
- Datong Xincheng New Material Co.,Ltd
- Graphite India Limited
- GrafTech International Limited
- Sinosteel Engineering and Technology Co., Ltd.
- SCHUNK SE & Co. KG
- Fangda Carbon New Material Co., Ltd.
TABLE OF CONTENTS
CHAPTER 1: INTRODUCTION
- 1.1. Report description
- 1.2. Key market segments
- 1.3. Key benefits to the stakeholders
- 1.4. Research methodology
- 1.4.1. Primary research
- 1.4.2. Secondary research
- 1.4.3. Analyst tools and models
CHAPTER 2: EXECUTIVE SUMMARY
- 2.1. CXO Perspective
CHAPTER 3: MARKET OVERVIEW
- 3.1. Market definition and scope
- 3.2. Key findings
- 3.2.1. Top impacting factors
- 3.2.2. Top investment pockets
- 3.3. Porter's five forces analysis
- 3.3.1. Moderate bargaining power of suppliers
- 3.3.2. Moderate threat of new entrants
- 3.3.3. Moderate threat of substitutes
- 3.3.4. Moderate intensity of rivalry
- 3.3.5. Moderate bargaining power of buyers
- 3.4. Market dynamics
- 3.4.1. Drivers
- 3.4.1.1. Growing demand in the automotive industry
- 3.4.1.2. Robust demand from aerospace & defense sector
- 3.4.1.3. Rise in renewable energy applications
- 3.4.1.4. Growth in energy storage applications
- 3.4.1.5. Escalating demand for industrial equipment
- 3.4.1.6. Rise in demand for chemical processing and corrosion resistance applications
- 3.4.1.7. Growth in electronics and semiconductors
- 3.4.2. Restraints
- 3.4.2.1. High production costs
- 3.4.2.2. Limited availability of high-quality raw materials
- 3.4.2.3. Environmental concerns
- 3.4.2.4. Competition from alternatives
- 3.4.3. Opportunities
- 3.4.3.1. Emerging applications in 3D printing and additive manufacturing
- 3.4.3.2. Rise in green technologies
- 3.4.3.3. High temperature applications
- 3.4.1. Drivers
- 3.5. Value Chain Analysis
- 3.6. Pricing Analysis
- 3.7. Patent Landscape
- 3.8. Key Regulation Analysis
CHAPTER 4: CARBON GRAPHITE MARKET, BY PRODUCT
- 4.1. Overview
- 4.1.1. Market size and forecast
- 4.2. Carbon and Graphite Electrodes
- 4.2.1. Key market trends, growth factors and opportunities
- 4.2.2. Market size and forecast, by region
- 4.2.3. Market share analysis by country
- 4.3. Carbon and Graphite Fibers
- 4.3.1. Key market trends, growth factors and opportunities
- 4.3.2. Market size and forecast, by region
- 4.3.3. Market share analysis by country
- 4.4. Carbon and Graphite Powder
- 4.4.1. Key market trends, growth factors and opportunities
- 4.4.2. Market size and forecast, by region
- 4.4.3. Market share analysis by country
- 4.5. Others
- 4.5.1. Key market trends, growth factors and opportunities
- 4.5.2. Market size and forecast, by region
- 4.5.3. Market share analysis by country
CHAPTER 5: CARBON GRAPHITE MARKET, BY END-USER INDUSTRY
- 5.1. Overview
- 5.1.1. Market size and forecast
- 5.2. Industrial
- 5.2.1. Key market trends, growth factors and opportunities
- 5.2.2. Market size and forecast, by region
- 5.2.3. Market share analysis by country
- 5.3. Aerospace
- 5.3.1. Key market trends, growth factors and opportunities
- 5.3.2. Market size and forecast, by region
- 5.3.3. Market share analysis by country
- 5.4. Others
- 5.4.1. Key market trends, growth factors and opportunities
- 5.4.2. Market size and forecast, by region
- 5.4.3. Market share analysis by country
CHAPTER 6: CARBON GRAPHITE MARKET, BY REGION
- 6.1. Overview
- 6.1.1. Market size and forecast By Region
- 6.2. North America
- 6.2.1. Key market trends, growth factors and opportunities
- 6.2.2. Market size and forecast, by Product
- 6.2.3. Market size and forecast, by End-user Industry
- 6.2.4. Market size and forecast, by country
- 6.2.4.1. U.S.
- 6.2.4.1.1. Market size and forecast, by Product
- 6.2.4.1.2. Market size and forecast, by End-user Industry
- 6.2.4.2. Canada
- 6.2.4.2.1. Market size and forecast, by Product
- 6.2.4.2.2. Market size and forecast, by End-user Industry
- 6.2.4.3. Mexico
- 6.2.4.3.1. Market size and forecast, by Product
- 6.2.4.3.2. Market size and forecast, by End-user Industry
- 6.3. Europe
- 6.3.1. Key market trends, growth factors and opportunities
- 6.3.2. Market size and forecast, by Product
- 6.3.3. Market size and forecast, by End-user Industry
- 6.3.4. Market size and forecast, by country
- 6.3.4.1. Germany
- 6.3.4.1.1. Market size and forecast, by Product
- 6.3.4.1.2. Market size and forecast, by End-user Industry
- 6.3.4.2. UK
- 6.3.4.2.1. Market size and forecast, by Product
- 6.3.4.2.2. Market size and forecast, by End-user Industry
- 6.3.4.3. France
- 6.3.4.3.1. Market size and forecast, by Product
- 6.3.4.3.2. Market size and forecast, by End-user Industry
- 6.3.4.4. Spain
- 6.3.4.4.1. Market size and forecast, by Product
- 6.3.4.4.2. Market size and forecast, by End-user Industry
- 6.3.4.5. Italy
- 6.3.4.5.1. Market size and forecast, by Product
- 6.3.4.5.2. Market size and forecast, by End-user Industry
- 6.3.4.6. Rest of Europe
- 6.3.4.6.1. Market size and forecast, by Product
- 6.3.4.6.2. Market size and forecast, by End-user Industry
- 6.4. Asia-Pacific
- 6.4.1. Key market trends, growth factors and opportunities
- 6.4.2. Market size and forecast, by Product
- 6.4.3. Market size and forecast, by End-user Industry
- 6.4.4. Market size and forecast, by country
- 6.4.4.1. China
- 6.4.4.1.1. Market size and forecast, by Product
- 6.4.4.1.2. Market size and forecast, by End-user Industry
- 6.4.4.2. India
- 6.4.4.2.1. Market size and forecast, by Product
- 6.4.4.2.2. Market size and forecast, by End-user Industry
- 6.4.4.3. Japan
- 6.4.4.3.1. Market size and forecast, by Product
- 6.4.4.3.2. Market size and forecast, by End-user Industry
- 6.4.4.4. South Korea
- 6.4.4.4.1. Market size and forecast, by Product
- 6.4.4.4.2. Market size and forecast, by End-user Industry
- 6.4.4.5. Australia
- 6.4.4.5.1. Market size and forecast, by Product
- 6.4.4.5.2. Market size and forecast, by End-user Industry
- 6.4.4.6. Rest of Asia-Pacific
- 6.4.4.6.1. Market size and forecast, by Product
- 6.4.4.6.2. Market size and forecast, by End-user Industry
- 6.5. LAMEA
- 6.5.1. Key market trends, growth factors and opportunities
- 6.5.2. Market size and forecast, by Product
- 6.5.3. Market size and forecast, by End-user Industry
- 6.5.4. Market size and forecast, by country
- 6.5.4.1. Brazil
- 6.5.4.1.1. Market size and forecast, by Product
- 6.5.4.1.2. Market size and forecast, by End-user Industry
- 6.5.4.2. Saudi Arabia
- 6.5.4.2.1. Market size and forecast, by Product
- 6.5.4.2.2. Market size and forecast, by End-user Industry
- 6.5.4.3. South Africa
- 6.5.4.3.1. Market size and forecast, by Product
- 6.5.4.3.2. Market size and forecast, by End-user Industry
- 6.5.4.4. Rest of LAMEA
- 6.5.4.4.1. Market size and forecast, by Product
- 6.5.4.4.2. Market size and forecast, by End-user Industry
CHAPTER 7: COMPETITIVE LANDSCAPE
- 7.1. Introduction
- 7.2. Top winning strategies
- 7.3. Product mapping of top 10 player
- 7.4. Competitive dashboard
- 7.5. Competitive heatmap
- 7.6. Top player positioning, 2022
CHAPTER 8: COMPANY PROFILES
- 8.1. IBIDEN
- 8.1.1. Company overview
- 8.1.2. Key executives
- 8.1.3. Company snapshot
- 8.1.4. Operating business segments
- 8.1.5. Product portfolio
- 8.1.6. Business performance
- 8.2. Entegris
- 8.2.1. Company overview
- 8.2.2. Key executives
- 8.2.3. Company snapshot
- 8.2.4. Operating business segments
- 8.2.5. Product portfolio
- 8.2.6. Business performance
- 8.3. Nippon Carbon Co Ltd.
- 8.3.1. Company overview
- 8.3.2. Key executives
- 8.3.3. Company snapshot
- 8.3.4. Operating business segments
- 8.3.5. Product portfolio
- 8.3.6. Business performance
- 8.4. SEC CARBON, LIMITED
- 8.4.1. Company overview
- 8.4.2. Key executives
- 8.4.3. Company snapshot
- 8.4.4. Operating business segments
- 8.4.5. Product portfolio
- 8.5. GrafTech International Limited
- 8.5.1. Company overview
- 8.5.2. Key executives
- 8.5.3. Company snapshot
- 8.5.4. Operating business segments
- 8.5.5. Product portfolio
- 8.5.6. Business performance
- 8.6. Graphite India Limited
- 8.6.1. Company overview
- 8.6.2. Key executives
- 8.6.3. Company snapshot
- 8.6.4. Operating business segments
- 8.6.5. Product portfolio
- 8.6.6. Business performance
- 8.7. SCHUNK SE & Co. KG
- 8.7.1. Company overview
- 8.7.2. Key executives
- 8.7.3. Company snapshot
- 8.7.4. Operating business segments
- 8.7.5. Product portfolio
- 8.8. Fangda Carbon New Material Co., Ltd.
- 8.8.1. Company overview
- 8.8.2. Key executives
- 8.8.3. Company snapshot
- 8.8.4. Operating business segments
- 8.8.5. Product portfolio
- 8.9. Datong Xincheng New Material Co.,Ltd
- 8.9.1. Company overview
- 8.9.2. Key executives
- 8.9.3. Company snapshot
- 8.9.4. Operating business segments
- 8.9.5. Product portfolio
- 8.10. Sinosteel Engineering and Technology Co., Ltd.
- 8.10.1. Company overview
- 8.10.2. Key executives
- 8.10.3. Company snapshot
- 8.10.4. Operating business segments
- 8.10.5. Product portfolio
LIST OF TABLES
- TABLE 01. GLOBAL CARBON GRAPHITE MARKET, BY PRODUCT, 2022-2032 ($MILLION)
- TABLE 02. GLOBAL CARBON GRAPHITE MARKET, BY PRODUCT, 2022-2032 (KILOTON)
- TABLE 03. CARBON GRAPHITE MARKET FOR CARBON AND GRAPHITE ELECTRODES, BY REGION, 2022-2032 ($MILLION)
- TABLE 04. CARBON GRAPHITE MARKET FOR CARBON AND GRAPHITE ELECTRODES, BY REGION, 2022-2032 (KILOTON)
- TABLE 05. CARBON GRAPHITE MARKET FOR CARBON AND GRAPHITE FIBERS, BY REGION, 2022-2032 ($MILLION)
- TABLE 06. CARBON GRAPHITE MARKET FOR CARBON AND GRAPHITE FIBERS, BY REGION, 2022-2032 (KILOTON)
- TABLE 07. CARBON GRAPHITE MARKET FOR CARBON AND GRAPHITE POWDER, BY REGION, 2022-2032 ($MILLION)
- TABLE 08. CARBON GRAPHITE MARKET FOR CARBON AND GRAPHITE POWDER, BY REGION, 2022-2032 (KILOTON)
- TABLE 09. CARBON GRAPHITE MARKET FOR OTHERS, BY REGION, 2022-2032 ($MILLION)
- TABLE 10. CARBON GRAPHITE MARKET FOR OTHERS, BY REGION, 2022-2032 (KILOTON)
- TABLE 11. GLOBAL CARBON GRAPHITE MARKET, BY END-USER INDUSTRY, 2022-2032 ($MILLION)
- TABLE 12. GLOBAL CARBON GRAPHITE MARKET, BY END-USER INDUSTRY, 2022-2032 (KILOTON)
- TABLE 13. CARBON GRAPHITE MARKET FOR INDUSTRIAL, BY REGION, 2022-2032 ($MILLION)
- TABLE 14. CARBON GRAPHITE MARKET FOR INDUSTRIAL, BY REGION, 2022-2032 (KILOTON)
- TABLE 15. CARBON GRAPHITE MARKET FOR AEROSPACE, BY REGION, 2022-2032 ($MILLION)
- TABLE 16. CARBON GRAPHITE MARKET FOR AEROSPACE, BY REGION, 2022-2032 (KILOTON)
- TABLE 17. CARBON GRAPHITE MARKET FOR OTHERS, BY REGION, 2022-2032 ($MILLION)
- TABLE 18. CARBON GRAPHITE MARKET FOR OTHERS, BY REGION, 2022-2032 (KILOTON)
- TABLE 19. CARBON GRAPHITE MARKET, BY REGION, 2022-2032 ($MILLION)
- TABLE 20. CARBON GRAPHITE MARKET, BY REGION, 2022-2032 (KILOTON)
- TABLE 21. NORTH AMERICA CARBON GRAPHITE MARKET, BY PRODUCT, 2022-2032 ($MILLION)
- TABLE 22. NORTH AMERICA CARBON GRAPHITE MARKET, BY PRODUCT, 2022-2032 (KILOTON)
- TABLE 23. NORTH AMERICA CARBON GRAPHITE MARKET, BY END-USER INDUSTRY, 2022-2032 ($MILLION)
- TABLE 24. NORTH AMERICA CARBON GRAPHITE MARKET, BY END-USER INDUSTRY, 2022-2032 (KILOTON)
- TABLE 25. NORTH AMERICA CARBON GRAPHITE MARKET, BY COUNTRY, 2022-2032 ($MILLION)
- TABLE 26. NORTH AMERICA CARBON GRAPHITE MARKET, BY COUNTRY, 2022-2032 (KILOTON)
- TABLE 27. U.S. CARBON GRAPHITE MARKET, BY PRODUCT, 2022-2032 ($MILLION)
- TABLE 28. U.S. CARBON GRAPHITE MARKET, BY PRODUCT, 2022-2032 (KILOTON)
- TABLE 29. U.S. CARBON GRAPHITE MARKET, BY END-USER INDUSTRY, 2022-2032 ($MILLION)
- TABLE 30. U.S. CARBON GRAPHITE MARKET, BY END-USER INDUSTRY, 2022-2032 (KILOTON)
- TABLE 31. CANADA CARBON GRAPHITE MARKET, BY PRODUCT, 2022-2032 ($MILLION)
- TABLE 32. CANADA CARBON GRAPHITE MARKET, BY PRODUCT, 2022-2032 (KILOTON)
- TABLE 33. CANADA CARBON GRAPHITE MARKET, BY END-USER INDUSTRY, 2022-2032 ($MILLION)
- TABLE 34. CANADA CARBON GRAPHITE MARKET, BY END-USER INDUSTRY, 2022-2032 (KILOTON)
- TABLE 35. MEXICO CARBON GRAPHITE MARKET, BY PRODUCT, 2022-2032 ($MILLION)
- TABLE 36. MEXICO CARBON GRAPHITE MARKET, BY PRODUCT, 2022-2032 (KILOTON)
- TABLE 37. MEXICO CARBON GRAPHITE MARKET, BY END-USER INDUSTRY, 2022-2032 ($MILLION)
- TABLE 38. MEXICO CARBON GRAPHITE MARKET, BY END-USER INDUSTRY, 2022-2032 (KILOTON)
- TABLE 39. EUROPE CARBON GRAPHITE MARKET, BY PRODUCT, 2022-2032 ($MILLION)
- TABLE 40. EUROPE CARBON GRAPHITE MARKET, BY PRODUCT, 2022-2032 (KILOTON)
- TABLE 41. EUROPE CARBON GRAPHITE MARKET, BY END-USER INDUSTRY, 2022-2032 ($MILLION)
- TABLE 42. EUROPE CARBON GRAPHITE MARKET, BY END-USER INDUSTRY, 2022-2032 (KILOTON)
- TABLE 43. EUROPE CARBON GRAPHITE MARKET, BY COUNTRY, 2022-2032 ($MILLION)
- TABLE 44. EUROPE CARBON GRAPHITE MARKET, BY COUNTRY, 2022-2032 (KILOTON)
- TABLE 45. GERMANY CARBON GRAPHITE MARKET, BY PRODUCT, 2022-2032 ($MILLION)
- TABLE 46. GERMANY CARBON GRAPHITE MARKET, BY PRODUCT, 2022-2032 (KILOTON)
- TABLE 47. GERMANY CARBON GRAPHITE MARKET, BY END-USER INDUSTRY, 2022-2032 ($MILLION)
- TABLE 48. GERMANY CARBON GRAPHITE MARKET, BY END-USER INDUSTRY, 2022-2032 (KILOTON)
- TABLE 49. UK CARBON GRAPHITE MARKET, BY PRODUCT, 2022-2032 ($MILLION)
- TABLE 50. UK CARBON GRAPHITE MARKET, BY PRODUCT, 2022-2032 (KILOTON)
- TABLE 51. UK CARBON GRAPHITE MARKET, BY END-USER INDUSTRY, 2022-2032 ($MILLION)
- TABLE 52. UK CARBON GRAPHITE MARKET, BY END-USER INDUSTRY, 2022-2032 (KILOTON)
- TABLE 53. FRANCE CARBON GRAPHITE MARKET, BY PRODUCT, 2022-2032 ($MILLION)
- TABLE 54. FRANCE CARBON GRAPHITE MARKET, BY PRODUCT, 2022-2032 (KILOTON)
- TABLE 55. FRANCE CARBON GRAPHITE MARKET, BY END-USER INDUSTRY, 2022-2032 ($MILLION)
- TABLE 56. FRANCE CARBON GRAPHITE MARKET, BY END-USER INDUSTRY, 2022-2032 (KILOTON)
- TABLE 57. SPAIN CARBON GRAPHITE MARKET, BY PRODUCT, 2022-2032 ($MILLION)
- TABLE 58. SPAIN CARBON GRAPHITE MARKET, BY PRODUCT, 2022-2032 (KILOTON)
- TABLE 59. SPAIN CARBON GRAPHITE MARKET, BY END-USER INDUSTRY, 2022-2032 ($MILLION)
- TABLE 60. SPAIN CARBON GRAPHITE MARKET, BY END-USER INDUSTRY, 2022-2032 (KILOTON)
- TABLE 61. ITALY CARBON GRAPHITE MARKET, BY PRODUCT, 2022-2032 ($MILLION)
- TABLE 62. ITALY CARBON GRAPHITE MARKET, BY PRODUCT, 2022-2032 (KILOTON)
- TABLE 63. ITALY CARBON GRAPHITE MARKET, BY END-USER INDUSTRY, 2022-2032 ($MILLION)
- TABLE 64. ITALY CARBON GRAPHITE MARKET, BY END-USER INDUSTRY, 2022-2032 (KILOTON)
- TABLE 65. REST OF EUROPE CARBON GRAPHITE MARKET, BY PRODUCT, 2022-2032 ($MILLION)
- TABLE 66. REST OF EUROPE CARBON GRAPHITE MARKET, BY PRODUCT, 2022-2032 (KILOTON)
- TABLE 67. REST OF EUROPE CARBON GRAPHITE MARKET, BY END-USER INDUSTRY, 2022-2032 ($MILLION)
- TABLE 68. REST OF EUROPE CARBON GRAPHITE MARKET, BY END-USER INDUSTRY, 2022-2032 (KILOTON)
- TABLE 69. ASIA-PACIFIC CARBON GRAPHITE MARKET, BY PRODUCT, 2022-2032 ($MILLION)
- TABLE 70. ASIA-PACIFIC CARBON GRAPHITE MARKET, BY PRODUCT, 2022-2032 (KILOTON)
- TABLE 71. ASIA-PACIFIC CARBON GRAPHITE MARKET, BY END-USER INDUSTRY, 2022-2032 ($MILLION)
- TABLE 72. ASIA-PACIFIC CARBON GRAPHITE MARKET, BY END-USER INDUSTRY, 2022-2032 (KILOTON)
- TABLE 73. ASIA-PACIFIC CARBON GRAPHITE MARKET, BY COUNTRY, 2022-2032 ($MILLION)
- TABLE 74. ASIA-PACIFIC CARBON GRAPHITE MARKET, BY COUNTRY, 2022-2032 (KILOTON)
- TABLE 75. CHINA CARBON GRAPHITE MARKET, BY PRODUCT, 2022-2032 ($MILLION)
- TABLE 76. CHINA CARBON GRAPHITE MARKET, BY PRODUCT, 2022-2032 (KILOTON)
- TABLE 77. CHINA CARBON GRAPHITE MARKET, BY END-USER INDUSTRY, 2022-2032 ($MILLION)
- TABLE 78. CHINA CARBON GRAPHITE MARKET, BY END-USER INDUSTRY, 2022-2032 (KILOTON)
- TABLE 79. INDIA CARBON GRAPHITE MARKET, BY PRODUCT, 2022-2032 ($MILLION)
- TABLE 80. INDIA CARBON GRAPHITE MARKET, BY PRODUCT, 2022-2032 (KILOTON)
- TABLE 81. INDIA CARBON GRAPHITE MARKET, BY END-USER INDUSTRY, 2022-2032 ($MILLION)
- TABLE 82. INDIA CARBON GRAPHITE MARKET, BY END-USER INDUSTRY, 2022-2032 (KILOTON)
- TABLE 83. JAPAN CARBON GRAPHITE MARKET, BY PRODUCT, 2022-2032 ($MILLION)
- TABLE 84. JAPAN CARBON GRAPHITE MARKET, BY PRODUCT, 2022-2032 (KILOTON)
- TABLE 85. JAPAN CARBON GRAPHITE MARKET, BY END-USER INDUSTRY, 2022-2032 ($MILLION)
- TABLE 86. JAPAN CARBON GRAPHITE MARKET, BY END-USER INDUSTRY, 2022-2032 (KILOTON)
- TABLE 87. SOUTH KOREA CARBON GRAPHITE MARKET, BY PRODUCT, 2022-2032 ($MILLION)
- TABLE 88. SOUTH KOREA CARBON GRAPHITE MARKET, BY PRODUCT, 2022-2032 (KILOTON)
- TABLE 89. SOUTH KOREA CARBON GRAPHITE MARKET, BY END-USER INDUSTRY, 2022-2032 ($MILLION)
- TABLE 90. SOUTH KOREA CARBON GRAPHITE MARKET, BY END-USER INDUSTRY, 2022-2032 (KILOTON)
- TABLE 91. AUSTRALIA CARBON GRAPHITE MARKET, BY PRODUCT, 2022-2032 ($MILLION)
- TABLE 92. AUSTRALIA CARBON GRAPHITE MARKET, BY PRODUCT, 2022-2032 (KILOTON)
- TABLE 93. AUSTRALIA CARBON GRAPHITE MARKET, BY END-USER INDUSTRY, 2022-2032 ($MILLION)
- TABLE 94. AUSTRALIA CARBON GRAPHITE MARKET, BY END-USER INDUSTRY, 2022-2032 (KILOTON)
- TABLE 95. REST OF ASIA-PACIFIC CARBON GRAPHITE MARKET, BY PRODUCT, 2022-2032 ($MILLION)
- TABLE 96. REST OF ASIA-PACIFIC CARBON GRAPHITE MARKET, BY PRODUCT, 2022-2032 (KILOTON)
- TABLE 97. REST OF ASIA-PACIFIC CARBON GRAPHITE MARKET, BY END-USER INDUSTRY, 2022-2032 ($MILLION)
- TABLE 98. REST OF ASIA-PACIFIC CARBON GRAPHITE MARKET, BY END-USER INDUSTRY, 2022-2032 (KILOTON)
- TABLE 99. LAMEA CARBON GRAPHITE MARKET, BY PRODUCT, 2022-2032 ($MILLION)
- TABLE 100. LAMEA CARBON GRAPHITE MARKET, BY PRODUCT, 2022-2032 (KILOTON)
- TABLE 101. LAMEA CARBON GRAPHITE MARKET, BY END-USER INDUSTRY, 2022-2032 ($MILLION)
- TABLE 102. LAMEA CARBON GRAPHITE MARKET, BY END-USER INDUSTRY, 2022-2032 (KILOTON)
- TABLE 103. LAMEA CARBON GRAPHITE MARKET, BY COUNTRY, 2022-2032 ($MILLION)
- TABLE 104. LAMEA CARBON GRAPHITE MARKET, BY COUNTRY, 2022-2032 (KILOTON)
- TABLE 105. BRAZIL CARBON GRAPHITE MARKET, BY PRODUCT, 2022-2032 ($MILLION)
- TABLE 106. BRAZIL CARBON GRAPHITE MARKET, BY PRODUCT, 2022-2032 (KILOTON)
- TABLE 107. BRAZIL CARBON GRAPHITE MARKET, BY END-USER INDUSTRY, 2022-2032 ($MILLION)
- TABLE 108. BRAZIL CARBON GRAPHITE MARKET, BY END-USER INDUSTRY, 2022-2032 (KILOTON)
- TABLE 109. SAUDI ARABIA CARBON GRAPHITE MARKET, BY PRODUCT, 2022-2032 ($MILLION)
- TABLE 110. SAUDI ARABIA CARBON GRAPHITE MARKET, BY PRODUCT, 2022-2032 (KILOTON)
- TABLE 111. SAUDI ARABIA CARBON GRAPHITE MARKET, BY END-USER INDUSTRY, 2022-2032 ($MILLION)
- TABLE 112. SAUDI ARABIA CARBON GRAPHITE MARKET, BY END-USER INDUSTRY, 2022-2032 (KILOTON)
- TABLE 113. SOUTH AFRICA CARBON GRAPHITE MARKET, BY PRODUCT, 2022-2032 ($MILLION)
- TABLE 114. SOUTH AFRICA CARBON GRAPHITE MARKET, BY PRODUCT, 2022-2032 (KILOTON)
- TABLE 115. SOUTH AFRICA CARBON GRAPHITE MARKET, BY END-USER INDUSTRY, 2022-2032 ($MILLION)
- TABLE 116. SOUTH AFRICA CARBON GRAPHITE MARKET, BY END-USER INDUSTRY, 2022-2032 (KILOTON)
- TABLE 117. REST OF LAMEA CARBON GRAPHITE MARKET, BY PRODUCT, 2022-2032 ($MILLION)
- TABLE 118. REST OF LAMEA CARBON GRAPHITE MARKET, BY PRODUCT, 2022-2032 (KILOTON)
- TABLE 119. REST OF LAMEA CARBON GRAPHITE MARKET, BY END-USER INDUSTRY, 2022-2032 ($MILLION)
- TABLE 120. REST OF LAMEA CARBON GRAPHITE MARKET, BY END-USER INDUSTRY, 2022-2032 (KILOTON)
- TABLE 121. IBIDEN: KEY EXECUTIVES
- TABLE 122. IBIDEN: COMPANY SNAPSHOT
- TABLE 123. IBIDEN: SERVICE SEGMENTS
- TABLE 124. IBIDEN: PRODUCT PORTFOLIO
- TABLE 125. ENTEGRIS: KEY EXECUTIVES
- TABLE 126. ENTEGRIS: COMPANY SNAPSHOT
- TABLE 127. ENTEGRIS: SERVICE SEGMENTS
- TABLE 128. ENTEGRIS: PRODUCT PORTFOLIO
- TABLE 129. NIPPON CARBON CO LTD.: KEY EXECUTIVES
- TABLE 130. NIPPON CARBON CO LTD.: COMPANY SNAPSHOT
- TABLE 131. NIPPON CARBON CO LTD.: PRODUCT SEGMENTS
- TABLE 132. NIPPON CARBON CO LTD.: PRODUCT PORTFOLIO
- TABLE 133. SEC CARBON, LIMITED: KEY EXECUTIVES
- TABLE 134. SEC CARBON, LIMITED: COMPANY SNAPSHOT
- TABLE 135. SEC CARBON, LIMITED: PRODUCT SEGMENTS
- TABLE 136. SEC CARBON, LIMITED: PRODUCT PORTFOLIO
- TABLE 137. GRAFTECH INTERNATIONAL LIMITED: KEY EXECUTIVES
- TABLE 138. GRAFTECH INTERNATIONAL LIMITED: COMPANY SNAPSHOT
- TABLE 139. GRAFTECH INTERNATIONAL LIMITED: PRODUCT SEGMENTS
- TABLE 140. GRAFTECH INTERNATIONAL LIMITED: PRODUCT PORTFOLIO
- TABLE 141. GRAPHITE INDIA LIMITED: KEY EXECUTIVES
- TABLE 142. GRAPHITE INDIA LIMITED: COMPANY SNAPSHOT
- TABLE 143. GRAPHITE INDIA LIMITED: PRODUCT SEGMENTS
- TABLE 144. GRAPHITE INDIA LIMITED: PRODUCT PORTFOLIO
- TABLE 145. SCHUNK SE & CO. KG: KEY EXECUTIVES
- TABLE 146. SCHUNK SE & CO. KG: COMPANY SNAPSHOT
- TABLE 147. SCHUNK SE & CO. KG: PRODUCT SEGMENTS
- TABLE 148. SCHUNK SE & CO. KG: SERVICE SEGMENTS
- TABLE 149. SCHUNK SE & CO. KG: PRODUCT PORTFOLIO
- TABLE 150. FANGDA CARBON NEW MATERIAL CO., LTD.: KEY EXECUTIVES
- TABLE 151. FANGDA CARBON NEW MATERIAL CO., LTD.: COMPANY SNAPSHOT
- TABLE 152. FANGDA CARBON NEW MATERIAL CO., LTD.: PRODUCT SEGMENTS
- TABLE 153. FANGDA CARBON NEW MATERIAL CO., LTD.: PRODUCT PORTFOLIO
- TABLE 154. DATONG XINCHENG NEW MATERIAL CO.,LTD: KEY EXECUTIVES
- TABLE 155. DATONG XINCHENG NEW MATERIAL CO.,LTD: COMPANY SNAPSHOT
- TABLE 156. DATONG XINCHENG NEW MATERIAL CO.,LTD: PRODUCT SEGMENTS
- TABLE 157. DATONG XINCHENG NEW MATERIAL CO.,LTD: PRODUCT PORTFOLIO
- TABLE 158. SINOSTEEL ENGINEERING AND TECHNOLOGY CO., LTD.: KEY EXECUTIVES
- TABLE 159. SINOSTEEL ENGINEERING AND TECHNOLOGY CO., LTD.: COMPANY SNAPSHOT
- TABLE 160. SINOSTEEL ENGINEERING AND TECHNOLOGY CO., LTD.: PRODUCT SEGMENTS
- TABLE 161. SINOSTEEL ENGINEERING AND TECHNOLOGY CO., LTD.: PRODUCT PORTFOLIO
LIST OF FIGURES
- FIGURE 01. CARBON GRAPHITE MARKET, 2022-2032
- FIGURE 02. SEGMENTATION OF CARBON GRAPHITE MARKET,2022-2032
- FIGURE 03. TOP IMPACTING FACTORS IN CARBON GRAPHITE MARKET (2022 TO 2032)
- FIGURE 04. TOP INVESTMENT POCKETS IN CARBON GRAPHITE MARKET (2023-2032)
- FIGURE 05. MODERATE BARGAINING POWER OF SUPPLIERS
- FIGURE 06. MODERATE THREAT OF NEW ENTRANTS
- FIGURE 07. MODERATE THREAT OF SUBSTITUTES
- FIGURE 08. MODERATE INTENSITY OF RIVALRY
- FIGURE 09. MODERATE BARGAINING POWER OF BUYERS
- FIGURE 10. GLOBAL CARBON GRAPHITE MARKET:DRIVERS, RESTRAINTS AND OPPORTUNITIES
- FIGURE 11. PRICING ANALYSIS: CARBON GRAPHITE MARKET 2022 AND 2032
- FIGURE 12. PATENT ANALYSIS BY COMPANY
- FIGURE 13. PATENT ANALYSIS BY COUNTRY
- FIGURE 14. IMPACT OF KEY REGULATION: CARBON GRAPHITE MARKET
- FIGURE 15. CARBON GRAPHITE MARKET, BY PRODUCT, 2022 AND 2032(%)
- FIGURE 16. COMPARATIVE SHARE ANALYSIS OF CARBON GRAPHITE MARKET FOR CARBON AND GRAPHITE ELECTRODES, BY COUNTRY 2022 AND 2032(%)
- FIGURE 17. COMPARATIVE SHARE ANALYSIS OF CARBON GRAPHITE MARKET FOR CARBON AND GRAPHITE FIBERS, BY COUNTRY 2022 AND 2032(%)
- FIGURE 18. COMPARATIVE SHARE ANALYSIS OF CARBON GRAPHITE MARKET FOR CARBON AND GRAPHITE POWDER, BY COUNTRY 2022 AND 2032(%)
- FIGURE 19. COMPARATIVE SHARE ANALYSIS OF CARBON GRAPHITE MARKET FOR OTHERS, BY COUNTRY 2022 AND 2032(%)
- FIGURE 20. CARBON GRAPHITE MARKET, BY END-USER INDUSTRY, 2022 AND 2032(%)
- FIGURE 21. COMPARATIVE SHARE ANALYSIS OF CARBON GRAPHITE MARKET FOR INDUSTRIAL, BY COUNTRY 2022 AND 2032(%)
- FIGURE 22. COMPARATIVE SHARE ANALYSIS OF CARBON GRAPHITE MARKET FOR AEROSPACE, BY COUNTRY 2022 AND 2032(%)
- FIGURE 23. COMPARATIVE SHARE ANALYSIS OF CARBON GRAPHITE MARKET FOR OTHERS, BY COUNTRY 2022 AND 2032(%)
- FIGURE 24. CARBON GRAPHITE MARKET BY REGION, 2022 AND 2032(%)
- FIGURE 25. U.S. CARBON GRAPHITE MARKET, 2022-2032 ($MILLION)
- FIGURE 26. CANADA CARBON GRAPHITE MARKET, 2022-2032 ($MILLION)
- FIGURE 27. MEXICO CARBON GRAPHITE MARKET, 2022-2032 ($MILLION)
- FIGURE 28. GERMANY CARBON GRAPHITE MARKET, 2022-2032 ($MILLION)
- FIGURE 29. UK CARBON GRAPHITE MARKET, 2022-2032 ($MILLION)
- FIGURE 30. FRANCE CARBON GRAPHITE MARKET, 2022-2032 ($MILLION)
- FIGURE 31. SPAIN CARBON GRAPHITE MARKET, 2022-2032 ($MILLION)
- FIGURE 32. ITALY CARBON GRAPHITE MARKET, 2022-2032 ($MILLION)
- FIGURE 33. REST OF EUROPE CARBON GRAPHITE MARKET, 2022-2032 ($MILLION)
- FIGURE 34. CHINA CARBON GRAPHITE MARKET, 2022-2032 ($MILLION)
- FIGURE 35. INDIA CARBON GRAPHITE MARKET, 2022-2032 ($MILLION)
- FIGURE 36. JAPAN CARBON GRAPHITE MARKET, 2022-2032 ($MILLION)
- FIGURE 37. SOUTH KOREA CARBON GRAPHITE MARKET, 2022-2032 ($MILLION)
- FIGURE 38. AUSTRALIA CARBON GRAPHITE MARKET, 2022-2032 ($MILLION)
- FIGURE 39. REST OF ASIA-PACIFIC CARBON GRAPHITE MARKET, 2022-2032 ($MILLION)
- FIGURE 40. BRAZIL CARBON GRAPHITE MARKET, 2022-2032 ($MILLION)
- FIGURE 41. SAUDI ARABIA CARBON GRAPHITE MARKET, 2022-2032 ($MILLION)
- FIGURE 42. SOUTH AFRICA CARBON GRAPHITE MARKET, 2022-2032 ($MILLION)
- FIGURE 43. REST OF LAMEA CARBON GRAPHITE MARKET, 2022-2032 ($MILLION)
- FIGURE 44. TOP WINNING STRATEGIES, BY YEAR
- FIGURE 45. TOP WINNING STRATEGIES, BY DEVELOPMENT
- FIGURE 46. TOP WINNING STRATEGIES, BY COMPANY
- FIGURE 47. PRODUCT MAPPING OF TOP 10 PLAYERS
- FIGURE 48. COMPETITIVE DASHBOARD
- FIGURE 49. COMPETITIVE HEATMAP: CARBON GRAPHITE MARKET
- FIGURE 50. TOP PLAYER POSITIONING, 2022
- FIGURE 51. ENTEGRIS: RESEARCH & DEVELOPMENT EXPENDITURE, 2020-2022 ($MILLION)
- FIGURE 52. ENTEGRIS: NET REVENUE, 2020-2022 ($MILLION)
- FIGURE 53. ENTEGRIS: REVENUE SHARE BY SEGMENT, 2022 (%)
- FIGURE 54. ENTEGRIS: REVENUE SHARE BY REGION, 2022 (%)
- FIGURE 55. NIPPON CARBON CO LTD.: NET SALES, 2020-2022 ($MILLION)
- FIGURE 56. GRAFTECH INTERNATIONAL LIMITED: NET REVENUE, 2020-2022 ($MILLION)
- FIGURE 57. GRAFTECH INTERNATIONAL LIMITED: RESEARCH & DEVELOPMENT EXPENDITURE, 2020-2022 ($MILLION)
- FIGURE 58. GRAFTECH INTERNATIONAL LIMITED: REVENUE SHARE BY REGION, 2022 (%)
- FIGURE 59. GRAPHITE INDIA LIMITED: NET REVENUE, 2020-2022 ($MILLION)
- FIGURE 60. GRAPHITE INDIA LIMITED: REVENUE SHARE BY SEGMENT, 2022 (%)

