
PUBLISHER: Allied Market Research | PRODUCT CODE: 1472340

PUBLISHER: Allied Market Research | PRODUCT CODE: 1472340
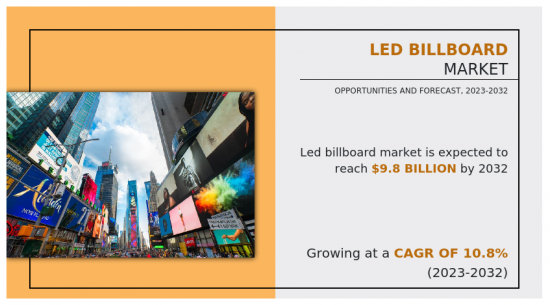
LED Billboard Market By Type (Monochrome, Full Color), By Application (Indoor, Outdoor), By End User (Advertising and Media, Government, Sports and Entertainment, Others): Global Opportunity Analysis and Industry Forecast, 2023-2032
The LED billboard market was valued at $3,554.2 million in 2022 and is projected to reach $9,795.2 million by 2032, registering a CAGR of 10.8% from 2023 to 2032.
LED billboards, also known as digital billboards, are outdoor advertising displays that use light-emitting diodes (LEDs) for showing digital pictures, movies, or animations. Unlike typical static billboards, which use printed content, LED billboards are interactive and modify their information remotely and in real time. These billboards are made up of a series of LED light bulbs or panels organized to create a big display screen. LED billboards have several benefits over traditional billboards, such as increased visibility throughout the day as well as during night owing to their high luminescence levels, their capacity to showcase multiple advertisements or messages in succession, and the ability for marketers to target particular audiences with customized advertisements. Furthermore, LED billboards are environmentally friendly as well as affordable in the long term since they require fewer repairs and use less energy than traditional billboards. Overall, LED billboards are increasing in popularity as an outdoor advertising medium due to their adaptability, efficacy, and ability to attract passersby's attention in today's increasingly competitive marketing scene.
Concerns about the environment and regulatory regulations are emerging as strong motivations for the deployment of LED billboards, fueling market development. With a growing worldwide emphasis on sustainability and lowering emissions, businesses are under obligation to adopt eco-friendly practices in all parts of activities, including advertising. LED billboards are more sustainable alternatives to traditional billboards, using much less energy and emitting less carbon emissions. Furthermore, the lifespan and sturdiness of LED technology eliminates the need for regular replacements, hence reducing environmental effect. Furthermore, regulatory organizations are enacting stricter laws to reduce illumination and energy consumption, promoting the adoption of energy-efficient and directed lighting solutions such as LED billboards. Businesses are thus required to keep up with these laws by shifting to LED-based advertising platforms. As a result, the confluence of environmental concerns and regulatory demands is encouraging the use of LED billboards, establishing them as a green and socially responsible alternative to outdoor advertising. As these factors continue to influence business dynamics, the LED billboard market is positioned for long-term growth, fueled by a trend toward environmentally friendly advertising alternatives.
Technical constraints with LED billboards are significant development restraints for the LED billboard business. While LED technology has various advantages, such as dynamic information display and energy economy, it also introduces its own set of challenges. Maintenance needs, such as frequent cleaning, monitoring, and repairs, are time-consuming and expensive, especially for enormous scale LED billboard systems. Furthermore, LED billboards experience technical challenges with weather resistance, such as deterioration from severe temperatures, dampness, or environmental contaminants, which cause a negative impact and reduce the billboard's durability. Furthermore, guaranteeing the smooth operation and synchronization of LED panels in big displays presents technological hurdles that need specialized knowledge and resources. These technological challenges dissuade prospective financiers and marketers from fully adopting LED billboard technology, impeding industry development. Addressing these difficulties requires continual advancements in research and development to improve the dependability, longevity, and use of LED billboard systems.
The LED billboard market is segmented into type, application, end user, and region. Depending on the type, the market is segregated into monochrome and full color. Based on application, the market is bifurcated into indoor and outdoor. On the basis of end user, it is fragmented into advertising & media, government, sports & entertainment, and others. Region wise, it is analyzed across North America (the U.S., Canada, and Mexico), Europe (Germany, UK, France, Italy, Spain, and rest of Europe), Asia-Pacific (China, Japan, India, Australia, South Korea, and rest of Asia-Pacific), Latin America (Brazil, Argentina, and rest of Latin America), and Middle East & Africa (Saudi Arabia, South Africa, United Arab Emirates, and rest of Middle East & Africa).
Players operating in the LED billboard market have adopted various developmental strategies to expand their LED billboard market share, increase profitability, and remain competitive in the market. The key players profiled in this report include Daktronics, Barco, Absen, Unilumin, Watchfire, Liantronics, Leyard, Sansitech, Lighthouse, and Ledman
Key Benefits for Stakeholders
- This report provides a quantitative analysis of the market segments, current trends, estimations, and dynamics of the led billboard market analysis from 2022 to 2032 to identify the prevailing led billboard market opportunities.
- The market research is offered along with information related to key drivers, restraints, and opportunities.
- Porter's five forces analysis highlights the potency of buyers and suppliers to enable stakeholders make profit-oriented business decisions and strengthen their supplier-buyer network.
- In-depth analysis of the led billboard market segmentation assists to determine the prevailing market opportunities.
- Major countries in each region are mapped according to their revenue contribution to the global market.
- Market player positioning facilitates benchmarking and provides a clear understanding of the present position of the market players.
- The report includes the analysis of the regional as well as global led billboard market trends, key players, market segments, application areas, and market growth strategies.
Additional benefits you will get with this purchase are:
- Quarterly Update and* (only available with a corporate license, on listed price)
- 5 additional Company Profile of client Choice pre- or Post-purchase, as a free update.
- Free Upcoming Version on the Purchase of Five and Enterprise User License.
- 16 analyst hours of support* (post-purchase, if you find additional data requirements upon review of the report, you may receive support amounting to 16 analyst hours to solve questions, and post-sale queries)
- 15% Free Customization* (in case the scope or segment of the report does not match your requirements, 15% is equivalent to 3 working days of free work, applicable once)
- Free data Pack on the Five and Enterprise User License. (Excel version of the report)
- Free Updated report if the report is 6-12 months old or older.
- 24-hour priority response*
- Free Industry updates and white papers.
Possible Customization with this report (with additional cost and timeline, please talk to the sales executive to know more)
- Product Benchmarking / Product specification and applications
- Market share analysis of players by products/segments
- Additional company profiles with specific to client's interest
- Additional country or region analysis- market size and forecast
- Criss-cross segment analysis- market size and forecast
- Expanded list for Company Profiles
- Historic market data
- Key player details (including location, contact details, supplier/vendor network etc. in excel format)
- List of customers/consumers/raw material suppliers- value chain analysis
- SWOT Analysis
Key Market Segments
By Type
- Monochrome
- Full Color
By Application
- Indoor
- Outdoor
By End User
- Advertising and Media
- Government
- Sports and Entertainment
- Others
By Region
- North America
- U.S.
- Canada
- Mexico
- Europe
- Germany
- UK
- France
- Italy
- Spain
- Rest of Europe
- Asia-Pacific
- China
- Japan
- India
- South Korea
- Australia
- Rest of Asia-Pacific
- Latin America
- Brazil
- Argentina
- Rest of Latin America
- Middle East and Africa
- Saudi Arabia
- South Africa
- UAE
- Rest of Middle East And Africa
Key Market Players:
- Daktronics
- Barco
- Absen
- Unilumin
- Watchfire
- Liantronics
- Leyard
- Sansitech
- Lighthouse
- Ledman
TABLE OF CONTENTS
CHAPTER 1: INTRODUCTION
- 1.1. Report description
- 1.2. Key market segments
- 1.3. Key benefits to the stakeholders
- 1.4. Research methodology
- 1.4.1. Primary research
- 1.4.2. Secondary research
- 1.4.3. Analyst tools and models
CHAPTER 2: EXECUTIVE SUMMARY
- 2.1. CXO perspective
CHAPTER 3: MARKET OVERVIEW
- 3.1. Market definition and scope
- 3.2. Key findings
- 3.2.1. Top impacting factors
- 3.2.2. Top investment pockets
- 3.3. Porter's five forces analysis
- 3.4. Market dynamics
- 3.4.1. Drivers
- 3.4.2. Restraints
- 3.4.3. Opportunities
CHAPTER 4: LED BILLBOARD MARKET, BY TYPE
- 4.1. Overview
- 4.1.1. Market size and forecast
- 4.2. Monochrome
- 4.2.1. Key market trends, growth factors and opportunities
- 4.2.2. Market size and forecast, by region
- 4.2.3. Market share analysis by country
- 4.3. Full Color
- 4.3.1. Key market trends, growth factors and opportunities
- 4.3.2. Market size and forecast, by region
- 4.3.3. Market share analysis by country
CHAPTER 5: LED BILLBOARD MARKET, BY APPLICATION
- 5.1. Overview
- 5.1.1. Market size and forecast
- 5.2. Indoor
- 5.2.1. Key market trends, growth factors and opportunities
- 5.2.2. Market size and forecast, by region
- 5.2.3. Market share analysis by country
- 5.3. Outdoor
- 5.3.1. Key market trends, growth factors and opportunities
- 5.3.2. Market size and forecast, by region
- 5.3.3. Market share analysis by country
CHAPTER 6: LED BILLBOARD MARKET, BY END USER
- 6.1. Overview
- 6.1.1. Market size and forecast
- 6.2. Advertising and Media
- 6.2.1. Key market trends, growth factors and opportunities
- 6.2.2. Market size and forecast, by region
- 6.2.3. Market share analysis by country
- 6.3. Government
- 6.3.1. Key market trends, growth factors and opportunities
- 6.3.2. Market size and forecast, by region
- 6.3.3. Market share analysis by country
- 6.4. Sports and Entertainment
- 6.4.1. Key market trends, growth factors and opportunities
- 6.4.2. Market size and forecast, by region
- 6.4.3. Market share analysis by country
- 6.5. Others
- 6.5.1. Key market trends, growth factors and opportunities
- 6.5.2. Market size and forecast, by region
- 6.5.3. Market share analysis by country
CHAPTER 7: LED BILLBOARD MARKET, BY REGION
- 7.1. Overview
- 7.1.1. Market size and forecast By Region
- 7.2. North America
- 7.2.1. Key market trends, growth factors and opportunities
- 7.2.2. Market size and forecast, by Type
- 7.2.3. Market size and forecast, by Application
- 7.2.4. Market size and forecast, by End User
- 7.2.5. Market size and forecast, by country
- 7.2.5.1. U.S.
- 7.2.5.1.1. Market size and forecast, by Type
- 7.2.5.1.2. Market size and forecast, by Application
- 7.2.5.1.3. Market size and forecast, by End User
- 7.2.5.2. Canada
- 7.2.5.2.1. Market size and forecast, by Type
- 7.2.5.2.2. Market size and forecast, by Application
- 7.2.5.2.3. Market size and forecast, by End User
- 7.2.5.3. Mexico
- 7.2.5.3.1. Market size and forecast, by Type
- 7.2.5.3.2. Market size and forecast, by Application
- 7.2.5.3.3. Market size and forecast, by End User
- 7.3. Europe
- 7.3.1. Key market trends, growth factors and opportunities
- 7.3.2. Market size and forecast, by Type
- 7.3.3. Market size and forecast, by Application
- 7.3.4. Market size and forecast, by End User
- 7.3.5. Market size and forecast, by country
- 7.3.5.1. Germany
- 7.3.5.1.1. Market size and forecast, by Type
- 7.3.5.1.2. Market size and forecast, by Application
- 7.3.5.1.3. Market size and forecast, by End User
- 7.3.5.2. UK
- 7.3.5.2.1. Market size and forecast, by Type
- 7.3.5.2.2. Market size and forecast, by Application
- 7.3.5.2.3. Market size and forecast, by End User
- 7.3.5.3. France
- 7.3.5.3.1. Market size and forecast, by Type
- 7.3.5.3.2. Market size and forecast, by Application
- 7.3.5.3.3. Market size and forecast, by End User
- 7.3.5.4. Italy
- 7.3.5.4.1. Market size and forecast, by Type
- 7.3.5.4.2. Market size and forecast, by Application
- 7.3.5.4.3. Market size and forecast, by End User
- 7.3.5.5. Spain
- 7.3.5.5.1. Market size and forecast, by Type
- 7.3.5.5.2. Market size and forecast, by Application
- 7.3.5.5.3. Market size and forecast, by End User
- 7.3.5.6. Rest of Europe
- 7.3.5.6.1. Market size and forecast, by Type
- 7.3.5.6.2. Market size and forecast, by Application
- 7.3.5.6.3. Market size and forecast, by End User
- 7.4. Asia-Pacific
- 7.4.1. Key market trends, growth factors and opportunities
- 7.4.2. Market size and forecast, by Type
- 7.4.3. Market size and forecast, by Application
- 7.4.4. Market size and forecast, by End User
- 7.4.5. Market size and forecast, by country
- 7.4.5.1. China
- 7.4.5.1.1. Market size and forecast, by Type
- 7.4.5.1.2. Market size and forecast, by Application
- 7.4.5.1.3. Market size and forecast, by End User
- 7.4.5.2. Japan
- 7.4.5.2.1. Market size and forecast, by Type
- 7.4.5.2.2. Market size and forecast, by Application
- 7.4.5.2.3. Market size and forecast, by End User
- 7.4.5.3. India
- 7.4.5.3.1. Market size and forecast, by Type
- 7.4.5.3.2. Market size and forecast, by Application
- 7.4.5.3.3. Market size and forecast, by End User
- 7.4.5.4. South Korea
- 7.4.5.4.1. Market size and forecast, by Type
- 7.4.5.4.2. Market size and forecast, by Application
- 7.4.5.4.3. Market size and forecast, by End User
- 7.4.5.5. Australia
- 7.4.5.5.1. Market size and forecast, by Type
- 7.4.5.5.2. Market size and forecast, by Application
- 7.4.5.5.3. Market size and forecast, by End User
- 7.4.5.6. Rest of Asia-Pacific
- 7.4.5.6.1. Market size and forecast, by Type
- 7.4.5.6.2. Market size and forecast, by Application
- 7.4.5.6.3. Market size and forecast, by End User
- 7.5. Latin America
- 7.5.1. Key market trends, growth factors and opportunities
- 7.5.2. Market size and forecast, by Type
- 7.5.3. Market size and forecast, by Application
- 7.5.4. Market size and forecast, by End User
- 7.5.5. Market size and forecast, by country
- 7.5.5.1. Brazil
- 7.5.5.1.1. Market size and forecast, by Type
- 7.5.5.1.2. Market size and forecast, by Application
- 7.5.5.1.3. Market size and forecast, by End User
- 7.5.5.2. Argentina
- 7.5.5.2.1. Market size and forecast, by Type
- 7.5.5.2.2. Market size and forecast, by Application
- 7.5.5.2.3. Market size and forecast, by End User
- 7.5.5.3. Rest of Latin America
- 7.5.5.3.1. Market size and forecast, by Type
- 7.5.5.3.2. Market size and forecast, by Application
- 7.5.5.3.3. Market size and forecast, by End User
- 7.6. Middle East and Africa
- 7.6.1. Key market trends, growth factors and opportunities
- 7.6.2. Market size and forecast, by Type
- 7.6.3. Market size and forecast, by Application
- 7.6.4. Market size and forecast, by End User
- 7.6.5. Market size and forecast, by country
- 7.6.5.1. Saudi Arabia
- 7.6.5.1.1. Market size and forecast, by Type
- 7.6.5.1.2. Market size and forecast, by Application
- 7.6.5.1.3. Market size and forecast, by End User
- 7.6.5.2. South Africa
- 7.6.5.2.1. Market size and forecast, by Type
- 7.6.5.2.2. Market size and forecast, by Application
- 7.6.5.2.3. Market size and forecast, by End User
- 7.6.5.3. UAE
- 7.6.5.3.1. Market size and forecast, by Type
- 7.6.5.3.2. Market size and forecast, by Application
- 7.6.5.3.3. Market size and forecast, by End User
- 7.6.5.4. Rest of Middle East And Africa
- 7.6.5.4.1. Market size and forecast, by Type
- 7.6.5.4.2. Market size and forecast, by Application
- 7.6.5.4.3. Market size and forecast, by End User
CHAPTER 8: COMPETITIVE LANDSCAPE
- 8.1. Introduction
- 8.2. Top winning strategies
- 8.3. Product mapping of top 10 player
- 8.4. Competitive dashboard
- 8.5. Competitive heatmap
- 8.6. Top player positioning, 2022
CHAPTER 9: COMPANY PROFILES
- 9.1. Daktronics
- 9.1.1. Company overview
- 9.1.2. Key executives
- 9.1.3. Company snapshot
- 9.1.4. Operating business segments
- 9.1.5. Product portfolio
- 9.1.6. Business performance
- 9.1.7. Key strategic moves and developments
- 9.2. Barco
- 9.2.1. Company overview
- 9.2.2. Key executives
- 9.2.3. Company snapshot
- 9.2.4. Operating business segments
- 9.2.5. Product portfolio
- 9.2.6. Business performance
- 9.2.7. Key strategic moves and developments
- 9.3. Absen
- 9.3.1. Company overview
- 9.3.2. Key executives
- 9.3.3. Company snapshot
- 9.3.4. Operating business segments
- 9.3.5. Product portfolio
- 9.3.6. Business performance
- 9.3.7. Key strategic moves and developments
- 9.4. Unilumin
- 9.4.1. Company overview
- 9.4.2. Key executives
- 9.4.3. Company snapshot
- 9.4.4. Operating business segments
- 9.4.5. Product portfolio
- 9.4.6. Business performance
- 9.4.7. Key strategic moves and developments
- 9.5. Watchfire
- 9.5.1. Company overview
- 9.5.2. Key executives
- 9.5.3. Company snapshot
- 9.5.4. Operating business segments
- 9.5.5. Product portfolio
- 9.5.6. Business performance
- 9.5.7. Key strategic moves and developments
- 9.6. Liantronics
- 9.6.1. Company overview
- 9.6.2. Key executives
- 9.6.3. Company snapshot
- 9.6.4. Operating business segments
- 9.6.5. Product portfolio
- 9.6.6. Business performance
- 9.6.7. Key strategic moves and developments
- 9.7. Leyard
- 9.7.1. Company overview
- 9.7.2. Key executives
- 9.7.3. Company snapshot
- 9.7.4. Operating business segments
- 9.7.5. Product portfolio
- 9.7.6. Business performance
- 9.7.7. Key strategic moves and developments
- 9.8. Sansitech
- 9.8.1. Company overview
- 9.8.2. Key executives
- 9.8.3. Company snapshot
- 9.8.4. Operating business segments
- 9.8.5. Product portfolio
- 9.8.6. Business performance
- 9.8.7. Key strategic moves and developments
- 9.9. Lighthouse
- 9.9.1. Company overview
- 9.9.2. Key executives
- 9.9.3. Company snapshot
- 9.9.4. Operating business segments
- 9.9.5. Product portfolio
- 9.9.6. Business performance
- 9.9.7. Key strategic moves and developments
- 9.10. Ledman
- 9.10.1. Company overview
- 9.10.2. Key executives
- 9.10.3. Company snapshot
- 9.10.4. Operating business segments
- 9.10.5. Product portfolio
- 9.10.6. Business performance
- 9.10.7. Key strategic moves and developments
LIST OF TABLES
- TABLE 01. GLOBAL LED BILLBOARD MARKET, BY TYPE, 2022-2032 ($MILLION)
- TABLE 02. LED BILLBOARD MARKET FOR MONOCHROME, BY REGION, 2022-2032 ($MILLION)
- TABLE 03. LED BILLBOARD MARKET FOR FULL COLOR, BY REGION, 2022-2032 ($MILLION)
- TABLE 04. GLOBAL LED BILLBOARD MARKET, BY APPLICATION, 2022-2032 ($MILLION)
- TABLE 05. LED BILLBOARD MARKET FOR INDOOR, BY REGION, 2022-2032 ($MILLION)
- TABLE 06. LED BILLBOARD MARKET FOR OUTDOOR, BY REGION, 2022-2032 ($MILLION)
- TABLE 07. GLOBAL LED BILLBOARD MARKET, BY END USER, 2022-2032 ($MILLION)
- TABLE 08. LED BILLBOARD MARKET FOR ADVERTISING AND MEDIA, BY REGION, 2022-2032 ($MILLION)
- TABLE 09. LED BILLBOARD MARKET FOR GOVERNMENT, BY REGION, 2022-2032 ($MILLION)
- TABLE 10. LED BILLBOARD MARKET FOR SPORTS AND ENTERTAINMENT, BY REGION, 2022-2032 ($MILLION)
- TABLE 11. LED BILLBOARD MARKET FOR OTHERS, BY REGION, 2022-2032 ($MILLION)
- TABLE 12. LED BILLBOARD MARKET, BY REGION, 2022-2032 ($MILLION)
- TABLE 13. NORTH AMERICA LED BILLBOARD MARKET, BY TYPE, 2022-2032 ($MILLION)
- TABLE 14. NORTH AMERICA LED BILLBOARD MARKET, BY APPLICATION, 2022-2032 ($MILLION)
- TABLE 15. NORTH AMERICA LED BILLBOARD MARKET, BY END USER, 2022-2032 ($MILLION)
- TABLE 16. NORTH AMERICA LED BILLBOARD MARKET, BY COUNTRY, 2022-2032 ($MILLION)
- TABLE 17. U.S. LED BILLBOARD MARKET, BY TYPE, 2022-2032 ($MILLION)
- TABLE 18. U.S. LED BILLBOARD MARKET, BY APPLICATION, 2022-2032 ($MILLION)
- TABLE 19. U.S. LED BILLBOARD MARKET, BY END USER, 2022-2032 ($MILLION)
- TABLE 20. CANADA LED BILLBOARD MARKET, BY TYPE, 2022-2032 ($MILLION)
- TABLE 21. CANADA LED BILLBOARD MARKET, BY APPLICATION, 2022-2032 ($MILLION)
- TABLE 22. CANADA LED BILLBOARD MARKET, BY END USER, 2022-2032 ($MILLION)
- TABLE 23. MEXICO LED BILLBOARD MARKET, BY TYPE, 2022-2032 ($MILLION)
- TABLE 24. MEXICO LED BILLBOARD MARKET, BY APPLICATION, 2022-2032 ($MILLION)
- TABLE 25. MEXICO LED BILLBOARD MARKET, BY END USER, 2022-2032 ($MILLION)
- TABLE 26. EUROPE LED BILLBOARD MARKET, BY TYPE, 2022-2032 ($MILLION)
- TABLE 27. EUROPE LED BILLBOARD MARKET, BY APPLICATION, 2022-2032 ($MILLION)
- TABLE 28. EUROPE LED BILLBOARD MARKET, BY END USER, 2022-2032 ($MILLION)
- TABLE 29. EUROPE LED BILLBOARD MARKET, BY COUNTRY, 2022-2032 ($MILLION)
- TABLE 30. GERMANY LED BILLBOARD MARKET, BY TYPE, 2022-2032 ($MILLION)
- TABLE 31. GERMANY LED BILLBOARD MARKET, BY APPLICATION, 2022-2032 ($MILLION)
- TABLE 32. GERMANY LED BILLBOARD MARKET, BY END USER, 2022-2032 ($MILLION)
- TABLE 33. UK LED BILLBOARD MARKET, BY TYPE, 2022-2032 ($MILLION)
- TABLE 34. UK LED BILLBOARD MARKET, BY APPLICATION, 2022-2032 ($MILLION)
- TABLE 35. UK LED BILLBOARD MARKET, BY END USER, 2022-2032 ($MILLION)
- TABLE 36. FRANCE LED BILLBOARD MARKET, BY TYPE, 2022-2032 ($MILLION)
- TABLE 37. FRANCE LED BILLBOARD MARKET, BY APPLICATION, 2022-2032 ($MILLION)
- TABLE 38. FRANCE LED BILLBOARD MARKET, BY END USER, 2022-2032 ($MILLION)
- TABLE 39. ITALY LED BILLBOARD MARKET, BY TYPE, 2022-2032 ($MILLION)
- TABLE 40. ITALY LED BILLBOARD MARKET, BY APPLICATION, 2022-2032 ($MILLION)
- TABLE 41. ITALY LED BILLBOARD MARKET, BY END USER, 2022-2032 ($MILLION)
- TABLE 42. SPAIN LED BILLBOARD MARKET, BY TYPE, 2022-2032 ($MILLION)
- TABLE 43. SPAIN LED BILLBOARD MARKET, BY APPLICATION, 2022-2032 ($MILLION)
- TABLE 44. SPAIN LED BILLBOARD MARKET, BY END USER, 2022-2032 ($MILLION)
- TABLE 45. REST OF EUROPE LED BILLBOARD MARKET, BY TYPE, 2022-2032 ($MILLION)
- TABLE 46. REST OF EUROPE LED BILLBOARD MARKET, BY APPLICATION, 2022-2032 ($MILLION)
- TABLE 47. REST OF EUROPE LED BILLBOARD MARKET, BY END USER, 2022-2032 ($MILLION)
- TABLE 48. ASIA-PACIFIC LED BILLBOARD MARKET, BY TYPE, 2022-2032 ($MILLION)
- TABLE 49. ASIA-PACIFIC LED BILLBOARD MARKET, BY APPLICATION, 2022-2032 ($MILLION)
- TABLE 50. ASIA-PACIFIC LED BILLBOARD MARKET, BY END USER, 2022-2032 ($MILLION)
- TABLE 51. ASIA-PACIFIC LED BILLBOARD MARKET, BY COUNTRY, 2022-2032 ($MILLION)
- TABLE 52. CHINA LED BILLBOARD MARKET, BY TYPE, 2022-2032 ($MILLION)
- TABLE 53. CHINA LED BILLBOARD MARKET, BY APPLICATION, 2022-2032 ($MILLION)
- TABLE 54. CHINA LED BILLBOARD MARKET, BY END USER, 2022-2032 ($MILLION)
- TABLE 55. JAPAN LED BILLBOARD MARKET, BY TYPE, 2022-2032 ($MILLION)
- TABLE 56. JAPAN LED BILLBOARD MARKET, BY APPLICATION, 2022-2032 ($MILLION)
- TABLE 57. JAPAN LED BILLBOARD MARKET, BY END USER, 2022-2032 ($MILLION)
- TABLE 58. INDIA LED BILLBOARD MARKET, BY TYPE, 2022-2032 ($MILLION)
- TABLE 59. INDIA LED BILLBOARD MARKET, BY APPLICATION, 2022-2032 ($MILLION)
- TABLE 60. INDIA LED BILLBOARD MARKET, BY END USER, 2022-2032 ($MILLION)
- TABLE 61. SOUTH KOREA LED BILLBOARD MARKET, BY TYPE, 2022-2032 ($MILLION)
- TABLE 62. SOUTH KOREA LED BILLBOARD MARKET, BY APPLICATION, 2022-2032 ($MILLION)
- TABLE 63. SOUTH KOREA LED BILLBOARD MARKET, BY END USER, 2022-2032 ($MILLION)
- TABLE 64. AUSTRALIA LED BILLBOARD MARKET, BY TYPE, 2022-2032 ($MILLION)
- TABLE 65. AUSTRALIA LED BILLBOARD MARKET, BY APPLICATION, 2022-2032 ($MILLION)
- TABLE 66. AUSTRALIA LED BILLBOARD MARKET, BY END USER, 2022-2032 ($MILLION)
- TABLE 67. REST OF ASIA-PACIFIC LED BILLBOARD MARKET, BY TYPE, 2022-2032 ($MILLION)
- TABLE 68. REST OF ASIA-PACIFIC LED BILLBOARD MARKET, BY APPLICATION, 2022-2032 ($MILLION)
- TABLE 69. REST OF ASIA-PACIFIC LED BILLBOARD MARKET, BY END USER, 2022-2032 ($MILLION)
- TABLE 70. LATIN AMERICA LED BILLBOARD MARKET, BY TYPE, 2022-2032 ($MILLION)
- TABLE 71. LATIN AMERICA LED BILLBOARD MARKET, BY APPLICATION, 2022-2032 ($MILLION)
- TABLE 72. LATIN AMERICA LED BILLBOARD MARKET, BY END USER, 2022-2032 ($MILLION)
- TABLE 73. LATIN AMERICA LED BILLBOARD MARKET, BY COUNTRY, 2022-2032 ($MILLION)
- TABLE 74. BRAZIL LED BILLBOARD MARKET, BY TYPE, 2022-2032 ($MILLION)
- TABLE 75. BRAZIL LED BILLBOARD MARKET, BY APPLICATION, 2022-2032 ($MILLION)
- TABLE 76. BRAZIL LED BILLBOARD MARKET, BY END USER, 2022-2032 ($MILLION)
- TABLE 77. ARGENTINA LED BILLBOARD MARKET, BY TYPE, 2022-2032 ($MILLION)
- TABLE 78. ARGENTINA LED BILLBOARD MARKET, BY APPLICATION, 2022-2032 ($MILLION)
- TABLE 79. ARGENTINA LED BILLBOARD MARKET, BY END USER, 2022-2032 ($MILLION)
- TABLE 80. REST OF LATIN AMERICA LED BILLBOARD MARKET, BY TYPE, 2022-2032 ($MILLION)
- TABLE 81. REST OF LATIN AMERICA LED BILLBOARD MARKET, BY APPLICATION, 2022-2032 ($MILLION)
- TABLE 82. REST OF LATIN AMERICA LED BILLBOARD MARKET, BY END USER, 2022-2032 ($MILLION)
- TABLE 83. MIDDLE EAST AND AFRICA LED BILLBOARD MARKET, BY TYPE, 2022-2032 ($MILLION)
- TABLE 84. MIDDLE EAST AND AFRICA LED BILLBOARD MARKET, BY APPLICATION, 2022-2032 ($MILLION)
- TABLE 85. MIDDLE EAST AND AFRICA LED BILLBOARD MARKET, BY END USER, 2022-2032 ($MILLION)
- TABLE 86. MIDDLE EAST AND AFRICA LED BILLBOARD MARKET, BY COUNTRY, 2022-2032 ($MILLION)
- TABLE 87. SAUDI ARABIA LED BILLBOARD MARKET, BY TYPE, 2022-2032 ($MILLION)
- TABLE 88. SAUDI ARABIA LED BILLBOARD MARKET, BY APPLICATION, 2022-2032 ($MILLION)
- TABLE 89. SAUDI ARABIA LED BILLBOARD MARKET, BY END USER, 2022-2032 ($MILLION)
- TABLE 90. SOUTH AFRICA LED BILLBOARD MARKET, BY TYPE, 2022-2032 ($MILLION)
- TABLE 91. SOUTH AFRICA LED BILLBOARD MARKET, BY APPLICATION, 2022-2032 ($MILLION)
- TABLE 92. SOUTH AFRICA LED BILLBOARD MARKET, BY END USER, 2022-2032 ($MILLION)
- TABLE 93. UAE LED BILLBOARD MARKET, BY TYPE, 2022-2032 ($MILLION)
- TABLE 94. UAE LED BILLBOARD MARKET, BY APPLICATION, 2022-2032 ($MILLION)
- TABLE 95. UAE LED BILLBOARD MARKET, BY END USER, 2022-2032 ($MILLION)
- TABLE 96. REST OF MIDDLE EAST AND AFRICA LED BILLBOARD MARKET, BY TYPE, 2022-2032 ($MILLION)
- TABLE 97. REST OF MIDDLE EAST AND AFRICA LED BILLBOARD MARKET, BY APPLICATION, 2022-2032 ($MILLION)
- TABLE 98. REST OF MIDDLE EAST AND AFRICA LED BILLBOARD MARKET, BY END USER, 2022-2032 ($MILLION)
- TABLE 99. DAKTRONICS: KEY EXECUTIVES
- TABLE 100. DAKTRONICS: COMPANY SNAPSHOT
- TABLE 101. DAKTRONICS: PRODUCT SEGMENTS
- TABLE 102. DAKTRONICS: SERVICE SEGMENTS
- TABLE 103. DAKTRONICS: PRODUCT PORTFOLIO
- TABLE 104. DAKTRONICS: KEY STRATERGIES
- TABLE 105. BARCO: KEY EXECUTIVES
- TABLE 106. BARCO: COMPANY SNAPSHOT
- TABLE 107. BARCO: PRODUCT SEGMENTS
- TABLE 108. BARCO: SERVICE SEGMENTS
- TABLE 109. BARCO: PRODUCT PORTFOLIO
- TABLE 110. BARCO: KEY STRATERGIES
- TABLE 111. ABSEN: KEY EXECUTIVES
- TABLE 112. ABSEN: COMPANY SNAPSHOT
- TABLE 113. ABSEN: PRODUCT SEGMENTS
- TABLE 114. ABSEN: SERVICE SEGMENTS
- TABLE 115. ABSEN: PRODUCT PORTFOLIO
- TABLE 116. ABSEN: KEY STRATERGIES
- TABLE 117. UNILUMIN: KEY EXECUTIVES
- TABLE 118. UNILUMIN: COMPANY SNAPSHOT
- TABLE 119. UNILUMIN: PRODUCT SEGMENTS
- TABLE 120. UNILUMIN: SERVICE SEGMENTS
- TABLE 121. UNILUMIN: PRODUCT PORTFOLIO
- TABLE 122. UNILUMIN: KEY STRATERGIES
- TABLE 123. WATCHFIRE: KEY EXECUTIVES
- TABLE 124. WATCHFIRE: COMPANY SNAPSHOT
- TABLE 125. WATCHFIRE: PRODUCT SEGMENTS
- TABLE 126. WATCHFIRE: SERVICE SEGMENTS
- TABLE 127. WATCHFIRE: PRODUCT PORTFOLIO
- TABLE 128. WATCHFIRE: KEY STRATERGIES
- TABLE 129. LIANTRONICS: KEY EXECUTIVES
- TABLE 130. LIANTRONICS: COMPANY SNAPSHOT
- TABLE 131. LIANTRONICS: PRODUCT SEGMENTS
- TABLE 132. LIANTRONICS: SERVICE SEGMENTS
- TABLE 133. LIANTRONICS: PRODUCT PORTFOLIO
- TABLE 134. LIANTRONICS: KEY STRATERGIES
- TABLE 135. LEYARD: KEY EXECUTIVES
- TABLE 136. LEYARD: COMPANY SNAPSHOT
- TABLE 137. LEYARD: PRODUCT SEGMENTS
- TABLE 138. LEYARD: SERVICE SEGMENTS
- TABLE 139. LEYARD: PRODUCT PORTFOLIO
- TABLE 140. LEYARD: KEY STRATERGIES
- TABLE 141. SANSITECH: KEY EXECUTIVES
- TABLE 142. SANSITECH: COMPANY SNAPSHOT
- TABLE 143. SANSITECH: PRODUCT SEGMENTS
- TABLE 144. SANSITECH: SERVICE SEGMENTS
- TABLE 145. SANSITECH: PRODUCT PORTFOLIO
- TABLE 146. SANSITECH: KEY STRATERGIES
- TABLE 147. LIGHTHOUSE: KEY EXECUTIVES
- TABLE 148. LIGHTHOUSE: COMPANY SNAPSHOT
- TABLE 149. LIGHTHOUSE: PRODUCT SEGMENTS
- TABLE 150. LIGHTHOUSE: SERVICE SEGMENTS
- TABLE 151. LIGHTHOUSE: PRODUCT PORTFOLIO
- TABLE 152. LIGHTHOUSE: KEY STRATERGIES
- TABLE 153. LEDMAN: KEY EXECUTIVES
- TABLE 154. LEDMAN: COMPANY SNAPSHOT
- TABLE 155. LEDMAN: PRODUCT SEGMENTS
- TABLE 156. LEDMAN: SERVICE SEGMENTS
- TABLE 157. LEDMAN: PRODUCT PORTFOLIO
- TABLE 158. LEDMAN: KEY STRATERGIES
LIST OF FIGURES
- FIGURE 01. LED BILLBOARD MARKET, 2022-2032
- FIGURE 02. SEGMENTATION OF LED BILLBOARD MARKET,2022-2032
- FIGURE 03. TOP IMPACTING FACTORS IN LED BILLBOARD MARKET
- FIGURE 04. TOP INVESTMENT POCKETS IN LED BILLBOARD MARKET (2023-2032)
- FIGURE 05. BARGAINING POWER OF SUPPLIERS
- FIGURE 06. BARGAINING POWER OF BUYERS
- FIGURE 07. THREAT OF SUBSTITUTION
- FIGURE 08. THREAT OF SUBSTITUTION
- FIGURE 09. COMPETITIVE RIVALRY
- FIGURE 10. GLOBAL LED BILLBOARD MARKET:DRIVERS, RESTRAINTS AND OPPORTUNITIES
- FIGURE 11. LED BILLBOARD MARKET, BY TYPE, 2022 AND 2032(%)
- FIGURE 12. COMPARATIVE SHARE ANALYSIS OF LED BILLBOARD MARKET FOR MONOCHROME, BY COUNTRY 2022 AND 2032(%)
- FIGURE 13. COMPARATIVE SHARE ANALYSIS OF LED BILLBOARD MARKET FOR FULL COLOR, BY COUNTRY 2022 AND 2032(%)
- FIGURE 14. LED BILLBOARD MARKET, BY APPLICATION, 2022 AND 2032(%)
- FIGURE 15. COMPARATIVE SHARE ANALYSIS OF LED BILLBOARD MARKET FOR INDOOR, BY COUNTRY 2022 AND 2032(%)
- FIGURE 16. COMPARATIVE SHARE ANALYSIS OF LED BILLBOARD MARKET FOR OUTDOOR, BY COUNTRY 2022 AND 2032(%)
- FIGURE 17. LED BILLBOARD MARKET, BY END USER, 2022 AND 2032(%)
- FIGURE 18. COMPARATIVE SHARE ANALYSIS OF LED BILLBOARD MARKET FOR ADVERTISING AND MEDIA, BY COUNTRY 2022 AND 2032(%)
- FIGURE 19. COMPARATIVE SHARE ANALYSIS OF LED BILLBOARD MARKET FOR GOVERNMENT, BY COUNTRY 2022 AND 2032(%)
- FIGURE 20. COMPARATIVE SHARE ANALYSIS OF LED BILLBOARD MARKET FOR SPORTS AND ENTERTAINMENT, BY COUNTRY 2022 AND 2032(%)
- FIGURE 21. COMPARATIVE SHARE ANALYSIS OF LED BILLBOARD MARKET FOR OTHERS, BY COUNTRY 2022 AND 2032(%)
- FIGURE 22. LED BILLBOARD MARKET BY REGION, 2022 AND 2032(%)
- FIGURE 23. U.S. LED BILLBOARD MARKET, 2022-2032 ($MILLION)
- FIGURE 24. CANADA LED BILLBOARD MARKET, 2022-2032 ($MILLION)
- FIGURE 25. MEXICO LED BILLBOARD MARKET, 2022-2032 ($MILLION)
- FIGURE 26. GERMANY LED BILLBOARD MARKET, 2022-2032 ($MILLION)
- FIGURE 27. UK LED BILLBOARD MARKET, 2022-2032 ($MILLION)
- FIGURE 28. FRANCE LED BILLBOARD MARKET, 2022-2032 ($MILLION)
- FIGURE 29. ITALY LED BILLBOARD MARKET, 2022-2032 ($MILLION)
- FIGURE 30. SPAIN LED BILLBOARD MARKET, 2022-2032 ($MILLION)
- FIGURE 31. REST OF EUROPE LED BILLBOARD MARKET, 2022-2032 ($MILLION)
- FIGURE 32. CHINA LED BILLBOARD MARKET, 2022-2032 ($MILLION)
- FIGURE 33. JAPAN LED BILLBOARD MARKET, 2022-2032 ($MILLION)
- FIGURE 34. INDIA LED BILLBOARD MARKET, 2022-2032 ($MILLION)
- FIGURE 35. SOUTH KOREA LED BILLBOARD MARKET, 2022-2032 ($MILLION)
- FIGURE 36. AUSTRALIA LED BILLBOARD MARKET, 2022-2032 ($MILLION)
- FIGURE 37. REST OF ASIA-PACIFIC LED BILLBOARD MARKET, 2022-2032 ($MILLION)
- FIGURE 38. BRAZIL LED BILLBOARD MARKET, 2022-2032 ($MILLION)
- FIGURE 39. ARGENTINA LED BILLBOARD MARKET, 2022-2032 ($MILLION)
- FIGURE 40. REST OF LATIN AMERICA LED BILLBOARD MARKET, 2022-2032 ($MILLION)
- FIGURE 41. SAUDI ARABIA LED BILLBOARD MARKET, 2022-2032 ($MILLION)
- FIGURE 42. SOUTH AFRICA LED BILLBOARD MARKET, 2022-2032 ($MILLION)
- FIGURE 43. UAE LED BILLBOARD MARKET, 2022-2032 ($MILLION)
- FIGURE 44. REST OF MIDDLE EAST AND AFRICA LED BILLBOARD MARKET, 2022-2032 ($MILLION)
- FIGURE 45. TOP WINNING STRATEGIES, BY YEAR
- FIGURE 46. TOP WINNING STRATEGIES, BY DEVELOPMENT
- FIGURE 47. TOP WINNING STRATEGIES, BY COMPANY
- FIGURE 48. PRODUCT MAPPING OF TOP 10 PLAYERS
- FIGURE 49. COMPETITIVE DASHBOARD
- FIGURE 50. COMPETITIVE HEATMAP: LED BILLBOARD MARKET
- FIGURE 51. TOP PLAYER POSITIONING, 2022

