
PUBLISHER: 360iResearch | PRODUCT CODE: 1376405

PUBLISHER: 360iResearch | PRODUCT CODE: 1376405
Chemical Mechanical Polishing Market by Consumables (Pad, Pad Conditioners, Slurry), Application (Compound Semiconductors, Integrated Circuits, MEMS & NEMS) - Global Forecast 2023-2030
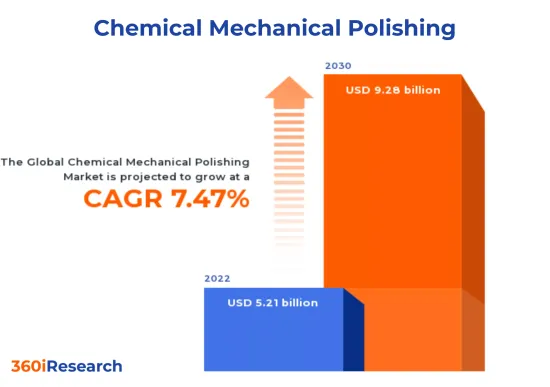
The Chemical Mechanical Polishing Market is projected to reach USD 9.28 billion by 2030 from USD 5.21 billion in 2022, at a CAGR of 7.47% during the forecast period.
Global Chemical Mechanical Polishing Market
| KEY MARKET STATISTICS | |
|---|---|
| Base Year Value [2022] | USD 5.21 billion |
| Estimated Year Value [2023] | USD 5.63 billion |
| Forecast Year Value [2030] | USD 9.28 billion |
| CAGR (%) | 7.47% |
Market Segmentation & Coverage:
This research report analyzes various sub-markets, forecasts revenues, and examines emerging trends in each category to provide a comprehensive outlook on the Chemical Mechanical Polishing Market.
Based on Consumables, market is studied across Pad, Pad Conditioners, and Slurry. The Pad Conditioners is projected to witness significant market share during forecast period.
Based on Application, market is studied across Compound Semiconductors, Integrated Circuits, and MEMS & NEMS. The Compound Semiconductors is projected to witness significant market share during forecast period.
Based on Region, market is studied across Americas, Asia-Pacific, and Europe, Middle East & Africa. The Americas is further studied across Argentina, Brazil, Canada, Mexico, and United States. The United States is further studied across California, Florida, Illinois, New York, Ohio, Pennsylvania, and Texas. The Asia-Pacific is further studied across Australia, China, India, Indonesia, Japan, Malaysia, Philippines, Singapore, South Korea, Taiwan, Thailand, and Vietnam. The Europe, Middle East & Africa is further studied across Denmark, Egypt, Finland, France, Germany, Israel, Italy, Netherlands, Nigeria, Norway, Poland, Qatar, Russia, Saudi Arabia, South Africa, Spain, Sweden, Switzerland, Turkey, United Arab Emirates, and United Kingdom. The Europe, Middle East & Africa is projected to witness significant market share during forecast period.
Market Statistics:
The report provides market sizing and forecasts across 7 major currencies - USD, EUR, JPY, GBP, AUD, CAD, and CHF; multiple currency support helps organization leaders to make well-informed decisions. In this report, 2018 to 2021 are considered as historical years, 2022 is base year, 2023 is estimated year, and years from 2024 to 2030 are considered as forecast period.
FPNV Positioning Matrix:
The FPNV Positioning Matrix is an indispensable tool for assessing the Chemical Mechanical Polishing Market. It comprehensively evaluates vendors, analyzing key metrics related to Business Strategy and Product Satisfaction. This enables users to make informed decisions tailored to their specific needs. Through advanced analysis, vendors are categorized into four distinct quadrants, each representing a different level of success: Forefront (F), Pathfinder (P), Niche (N), or Vital (V). Be assured that this insightful framework empowers decision-makers to navigate the market with confidence.
Market Share Analysis:
The Market Share Analysis offers invaluable insights into the vendor landscape Chemical Mechanical Polishing Market. By evaluating their impact on overall revenue, customer base, and other key metrics, we provide companies with a comprehensive understanding of their performance and the competitive environment they confront. This analysis also uncovers the level of competition in terms of market share acquisition, fragmentation, dominance, and industry consolidation during the study period.
Key Company Profiles:
The report delves into recent significant developments in the Chemical Mechanical Polishing Market, highlighting leading vendors and their innovative profiles. These include Applied Materials, Inc., Axus Technology, BASF SE, Cabot Corporation, DuPont de Nemours, Inc., EBARA Technologies, Inc., Entegris, Entrepix, Inc., FLP Microfinishing GmbH, Fraunhofer IPMS, Fujimi Corporation, Hitachi, Ltd., Illinois Tool Works Inc., Intel Corporation, Kakou USA, LLC, Kemet International Limited, Lapmaster Wolters, Logitech Ltd., Okamoto Singapore, Revasum, S3 Alliance, and Stahli USA.
The report offers valuable insights on the following aspects:
1. Market Penetration: It provides comprehensive information about key players' market dynamics and offerings.
2. Market Development: In-depth analysis of emerging markets and penetration across mature market segments, highlighting lucrative opportunities.
3. Market Diversification: Detailed information about new product launches, untapped geographies, recent developments, and investments.
4. Competitive Assessment & Intelligence: Exhaustive assessment of market shares, strategies, products, certifications, regulatory approvals, patent landscape, and manufacturing capabilities of leading players.
5. Product Development & Innovation: Intelligent insights on future technologies, R&D activities, and breakthrough product developments.
The report addresses key questions such as:
1. What is the market size and forecast for the Chemical Mechanical Polishing Market?
2. Which products, segments, applications, and areas hold the highest investment potential in the Chemical Mechanical Polishing Market?
3. What is the competitive strategic window for identifying opportunities in the Chemical Mechanical Polishing Market?
4. What are the latest technology trends and regulatory frameworks in the Chemical Mechanical Polishing Market?
5. What is the market share of the leading vendors in the Chemical Mechanical Polishing Market?
6. Which modes and strategic moves are suitable for entering the Chemical Mechanical Polishing Market?
Table of Contents
1. Preface
- 1.1. Objectives of the Study
- 1.2. Market Segmentation & Coverage
- 1.3. Years Considered for the Study
- 1.4. Currency & Pricing
- 1.5. Language
- 1.6. Limitations
- 1.7. Assumptions
- 1.8. Stakeholders
2. Research Methodology
- 2.1. Define: Research Objective
- 2.2. Determine: Research Design
- 2.3. Prepare: Research Instrument
- 2.4. Collect: Data Source
- 2.5. Analyze: Data Interpretation
- 2.6. Formulate: Data Verification
- 2.7. Publish: Research Report
- 2.8. Repeat: Report Update
3. Executive Summary
4. Market Overview
- 4.1. Introduction
- 4.2. Chemical Mechanical Polishing Market, by Region
5. Market Insights
- 5.1. Market Dynamics
- 5.1.1. Drivers
- 5.1.1.1. Growing demand for consumer electronics
- 5.1.1.2. Expanding application of chemical mechanical polishing (CMP) in automobile sector
- 5.1.2. Restraints
- 5.1.2.1. Problems related to complexities in the manufacturing process
- 5.1.3. Opportunities
- 5.1.3.1. Technical advancements in the fabrication and semiconductor processes
- 5.1.3.2. Increasing usage of CMP in in silica-based glasses to produce ultrasmooth glass surfaces
- 5.1.4. Challenges
- 5.1.4.1. Increasing popularity of alternative techniques, including dry etching and plasma polishing
- 5.1.1. Drivers
- 5.2. Market Segmentation Analysis
- 5.3. Market Trend Analysis
- 5.4. Cumulative Impact of High Inflation
- 5.5. Porter's Five Forces Analysis
- 5.5.1. Threat of New Entrants
- 5.5.2. Threat of Substitutes
- 5.5.3. Bargaining Power of Customers
- 5.5.4. Bargaining Power of Suppliers
- 5.5.5. Industry Rivalry
- 5.6. Value Chain & Critical Path Analysis
- 5.7. Regulatory Framework
6. Chemical Mechanical Polishing Market, by Consumables
- 6.1. Introduction
- 6.2. Pad
- 6.3. Pad Conditioners
- 6.4. Slurry
7. Chemical Mechanical Polishing Market, by Application
- 7.1. Introduction
- 7.2. Compound Semiconductors
- 7.3. Integrated Circuits
- 7.4. MEMS & NEMS
8. Americas Chemical Mechanical Polishing Market
- 8.1. Introduction
- 8.2. Argentina
- 8.3. Brazil
- 8.4. Canada
- 8.5. Mexico
- 8.6. United States
9. Asia-Pacific Chemical Mechanical Polishing Market
- 9.1. Introduction
- 9.2. Australia
- 9.3. China
- 9.4. India
- 9.5. Indonesia
- 9.6. Japan
- 9.7. Malaysia
- 9.8. Philippines
- 9.9. Singapore
- 9.10. South Korea
- 9.11. Taiwan
- 9.12. Thailand
- 9.13. Vietnam
10. Europe, Middle East & Africa Chemical Mechanical Polishing Market
- 10.1. Introduction
- 10.2. Denmark
- 10.3. Egypt
- 10.4. Finland
- 10.5. France
- 10.6. Germany
- 10.7. Israel
- 10.8. Italy
- 10.9. Netherlands
- 10.10. Nigeria
- 10.11. Norway
- 10.12. Poland
- 10.13. Qatar
- 10.14. Russia
- 10.15. Saudi Arabia
- 10.16. South Africa
- 10.17. Spain
- 10.18. Sweden
- 10.19. Switzerland
- 10.20. Turkey
- 10.21. United Arab Emirates
- 10.22. United Kingdom
11. Competitive Landscape
- 11.1. FPNV Positioning Matrix
- 11.2. Market Share Analysis, By Key Player
- 11.3. Competitive Scenario Analysis, By Key Player
12. Competitive Portfolio
- 12.1. Key Company Profiles
- 12.1.1. Applied Materials, Inc.
- 12.1.2. Axus Technology
- 12.1.3. BASF SE
- 12.1.4. Cabot Corporation
- 12.1.5. DuPont de Nemours, Inc.
- 12.1.6. EBARA Technologies, Inc.
- 12.1.7. Entegris
- 12.1.8. Entrepix, Inc.
- 12.1.9. FLP Microfinishing GmbH
- 12.1.10. Fraunhofer IPMS
- 12.1.11. Fujimi Corporation
- 12.1.12. Hitachi, Ltd.
- 12.1.13. Illinois Tool Works Inc.
- 12.1.14. Intel Corporation
- 12.1.15. Kakou USA, LLC
- 12.1.16. Kemet International Limited
- 12.1.17. Lapmaster Wolters
- 12.1.18. Logitech Ltd.
- 12.1.19. Okamoto Singapore
- 12.1.20. Revasum
- 12.1.21. S3 Alliance
- 12.1.22. Stahli USA
- 12.2. Key Product Portfolio
13. Appendix
- 13.1. Discussion Guide
- 13.2. License & Pricing
LIST OF FIGURES
- FIGURE 1. CHEMICAL MECHANICAL POLISHING MARKET RESEARCH PROCESS
- FIGURE 2. CHEMICAL MECHANICAL POLISHING MARKET SIZE, 2022 VS 2030
- FIGURE 3. CHEMICAL MECHANICAL POLISHING MARKET SIZE, 2018-2030 (USD MILLION)
- FIGURE 4. CHEMICAL MECHANICAL POLISHING MARKET SIZE, BY REGION, 2022 VS 2030 (%)
- FIGURE 5. CHEMICAL MECHANICAL POLISHING MARKET SIZE, BY REGION, 2022 VS 2023 VS 2030 (USD MILLION)
- FIGURE 6. CHEMICAL MECHANICAL POLISHING MARKET DYNAMICS
- FIGURE 7. CHEMICAL MECHANICAL POLISHING MARKET SIZE, BY CONSUMABLES, 2022 VS 2030 (%)
- FIGURE 8. CHEMICAL MECHANICAL POLISHING MARKET SIZE, BY CONSUMABLES, 2022 VS 2023 VS 2030 (USD MILLION)
- FIGURE 9. CHEMICAL MECHANICAL POLISHING MARKET SIZE, BY APPLICATION, 2022 VS 2030 (%)
- FIGURE 10. CHEMICAL MECHANICAL POLISHING MARKET SIZE, BY APPLICATION, 2022 VS 2023 VS 2030 (USD MILLION)
- FIGURE 11. AMERICAS CHEMICAL MECHANICAL POLISHING MARKET SIZE, BY COUNTRY, 2022 VS 2030 (%)
- FIGURE 12. AMERICAS CHEMICAL MECHANICAL POLISHING MARKET SIZE, BY COUNTRY, 2022 VS 2023 VS 2030 (USD MILLION)
- FIGURE 13. UNITED STATES CHEMICAL MECHANICAL POLISHING MARKET SIZE, BY STATE, 2022 VS 2030 (%)
- FIGURE 14. UNITED STATES CHEMICAL MECHANICAL POLISHING MARKET SIZE, BY STATE, 2022 VS 2023 VS 2030 (USD MILLION)
- FIGURE 15. ASIA-PACIFIC CHEMICAL MECHANICAL POLISHING MARKET SIZE, BY COUNTRY, 2022 VS 2030 (%)
- FIGURE 16. ASIA-PACIFIC CHEMICAL MECHANICAL POLISHING MARKET SIZE, BY COUNTRY, 2022 VS 2023 VS 2030 (USD MILLION)
- FIGURE 17. EUROPE, MIDDLE EAST & AFRICA CHEMICAL MECHANICAL POLISHING MARKET SIZE, BY COUNTRY, 2022 VS 2030 (%)
- FIGURE 18. EUROPE, MIDDLE EAST & AFRICA CHEMICAL MECHANICAL POLISHING MARKET SIZE, BY COUNTRY, 2022 VS 2023 VS 2030 (USD MILLION)
- FIGURE 19. CHEMICAL MECHANICAL POLISHING MARKET, FPNV POSITIONING MATRIX, 2022
- FIGURE 20. CHEMICAL MECHANICAL POLISHING MARKET SHARE, BY KEY PLAYER, 2022
LIST OF TABLES
- TABLE 1. CHEMICAL MECHANICAL POLISHING MARKET SEGMENTATION & COVERAGE
- TABLE 2. UNITED STATES DOLLAR EXCHANGE RATE, 2018-2022
- TABLE 3. CHEMICAL MECHANICAL POLISHING MARKET SIZE, 2018-2030 (USD MILLION)
- TABLE 4. GLOBAL CHEMICAL MECHANICAL POLISHING MARKET SIZE, BY REGION, 2018-2030 (USD MILLION)
- TABLE 5. CHEMICAL MECHANICAL POLISHING MARKET SIZE, BY CONSUMABLES, 2018-2030 (USD MILLION)
- TABLE 6. CHEMICAL MECHANICAL POLISHING MARKET SIZE, BY PAD, BY REGION, 2018-2030 (USD MILLION)
- TABLE 7. CHEMICAL MECHANICAL POLISHING MARKET SIZE, BY PAD CONDITIONERS, BY REGION, 2018-2030 (USD MILLION)
- TABLE 8. CHEMICAL MECHANICAL POLISHING MARKET SIZE, BY SLURRY, BY REGION, 2018-2030 (USD MILLION)
- TABLE 9. CHEMICAL MECHANICAL POLISHING MARKET SIZE, BY APPLICATION, 2018-2030 (USD MILLION)
- TABLE 10. CHEMICAL MECHANICAL POLISHING MARKET SIZE, BY COMPOUND SEMICONDUCTORS, BY REGION, 2018-2030 (USD MILLION)
- TABLE 11. CHEMICAL MECHANICAL POLISHING MARKET SIZE, BY INTEGRATED CIRCUITS, BY REGION, 2018-2030 (USD MILLION)
- TABLE 12. CHEMICAL MECHANICAL POLISHING MARKET SIZE, BY MEMS & NEMS, BY REGION, 2018-2030 (USD MILLION)
- TABLE 13. AMERICAS CHEMICAL MECHANICAL POLISHING MARKET SIZE, BY CONSUMABLES, 2018-2030 (USD MILLION)
- TABLE 14. AMERICAS CHEMICAL MECHANICAL POLISHING MARKET SIZE, BY APPLICATION, 2018-2030 (USD MILLION)
- TABLE 15. AMERICAS CHEMICAL MECHANICAL POLISHING MARKET SIZE, BY COUNTRY, 2018-2030 (USD MILLION)
- TABLE 16. ARGENTINA CHEMICAL MECHANICAL POLISHING MARKET SIZE, BY CONSUMABLES, 2018-2030 (USD MILLION)
- TABLE 17. ARGENTINA CHEMICAL MECHANICAL POLISHING MARKET SIZE, BY APPLICATION, 2018-2030 (USD MILLION)
- TABLE 18. BRAZIL CHEMICAL MECHANICAL POLISHING MARKET SIZE, BY CONSUMABLES, 2018-2030 (USD MILLION)
- TABLE 19. BRAZIL CHEMICAL MECHANICAL POLISHING MARKET SIZE, BY APPLICATION, 2018-2030 (USD MILLION)
- TABLE 20. CANADA CHEMICAL MECHANICAL POLISHING MARKET SIZE, BY CONSUMABLES, 2018-2030 (USD MILLION)
- TABLE 21. CANADA CHEMICAL MECHANICAL POLISHING MARKET SIZE, BY APPLICATION, 2018-2030 (USD MILLION)
- TABLE 22. MEXICO CHEMICAL MECHANICAL POLISHING MARKET SIZE, BY CONSUMABLES, 2018-2030 (USD MILLION)
- TABLE 23. MEXICO CHEMICAL MECHANICAL POLISHING MARKET SIZE, BY APPLICATION, 2018-2030 (USD MILLION)
- TABLE 24. UNITED STATES CHEMICAL MECHANICAL POLISHING MARKET SIZE, BY CONSUMABLES, 2018-2030 (USD MILLION)
- TABLE 25. UNITED STATES CHEMICAL MECHANICAL POLISHING MARKET SIZE, BY APPLICATION, 2018-2030 (USD MILLION)
- TABLE 26. UNITED STATES CHEMICAL MECHANICAL POLISHING MARKET SIZE, BY STATE, 2018-2030 (USD MILLION)
- TABLE 27. ASIA-PACIFIC CHEMICAL MECHANICAL POLISHING MARKET SIZE, BY CONSUMABLES, 2018-2030 (USD MILLION)
- TABLE 28. ASIA-PACIFIC CHEMICAL MECHANICAL POLISHING MARKET SIZE, BY APPLICATION, 2018-2030 (USD MILLION)
- TABLE 29. ASIA-PACIFIC CHEMICAL MECHANICAL POLISHING MARKET SIZE, BY COUNTRY, 2018-2030 (USD MILLION)
- TABLE 30. AUSTRALIA CHEMICAL MECHANICAL POLISHING MARKET SIZE, BY CONSUMABLES, 2018-2030 (USD MILLION)
- TABLE 31. AUSTRALIA CHEMICAL MECHANICAL POLISHING MARKET SIZE, BY APPLICATION, 2018-2030 (USD MILLION)
- TABLE 32. CHINA CHEMICAL MECHANICAL POLISHING MARKET SIZE, BY CONSUMABLES, 2018-2030 (USD MILLION)
- TABLE 33. CHINA CHEMICAL MECHANICAL POLISHING MARKET SIZE, BY APPLICATION, 2018-2030 (USD MILLION)
- TABLE 34. INDIA CHEMICAL MECHANICAL POLISHING MARKET SIZE, BY CONSUMABLES, 2018-2030 (USD MILLION)
- TABLE 35. INDIA CHEMICAL MECHANICAL POLISHING MARKET SIZE, BY APPLICATION, 2018-2030 (USD MILLION)
- TABLE 36. INDONESIA CHEMICAL MECHANICAL POLISHING MARKET SIZE, BY CONSUMABLES, 2018-2030 (USD MILLION)
- TABLE 37. INDONESIA CHEMICAL MECHANICAL POLISHING MARKET SIZE, BY APPLICATION, 2018-2030 (USD MILLION)
- TABLE 38. JAPAN CHEMICAL MECHANICAL POLISHING MARKET SIZE, BY CONSUMABLES, 2018-2030 (USD MILLION)
- TABLE 39. JAPAN CHEMICAL MECHANICAL POLISHING MARKET SIZE, BY APPLICATION, 2018-2030 (USD MILLION)
- TABLE 40. MALAYSIA CHEMICAL MECHANICAL POLISHING MARKET SIZE, BY CONSUMABLES, 2018-2030 (USD MILLION)
- TABLE 41. MALAYSIA CHEMICAL MECHANICAL POLISHING MARKET SIZE, BY APPLICATION, 2018-2030 (USD MILLION)
- TABLE 42. PHILIPPINES CHEMICAL MECHANICAL POLISHING MARKET SIZE, BY CONSUMABLES, 2018-2030 (USD MILLION)
- TABLE 43. PHILIPPINES CHEMICAL MECHANICAL POLISHING MARKET SIZE, BY APPLICATION, 2018-2030 (USD MILLION)
- TABLE 44. SINGAPORE CHEMICAL MECHANICAL POLISHING MARKET SIZE, BY CONSUMABLES, 2018-2030 (USD MILLION)
- TABLE 45. SINGAPORE CHEMICAL MECHANICAL POLISHING MARKET SIZE, BY APPLICATION, 2018-2030 (USD MILLION)
- TABLE 46. SOUTH KOREA CHEMICAL MECHANICAL POLISHING MARKET SIZE, BY CONSUMABLES, 2018-2030 (USD MILLION)
- TABLE 47. SOUTH KOREA CHEMICAL MECHANICAL POLISHING MARKET SIZE, BY APPLICATION, 2018-2030 (USD MILLION)
- TABLE 48. TAIWAN CHEMICAL MECHANICAL POLISHING MARKET SIZE, BY CONSUMABLES, 2018-2030 (USD MILLION)
- TABLE 49. TAIWAN CHEMICAL MECHANICAL POLISHING MARKET SIZE, BY APPLICATION, 2018-2030 (USD MILLION)
- TABLE 50. THAILAND CHEMICAL MECHANICAL POLISHING MARKET SIZE, BY CONSUMABLES, 2018-2030 (USD MILLION)
- TABLE 51. THAILAND CHEMICAL MECHANICAL POLISHING MARKET SIZE, BY APPLICATION, 2018-2030 (USD MILLION)
- TABLE 52. VIETNAM CHEMICAL MECHANICAL POLISHING MARKET SIZE, BY CONSUMABLES, 2018-2030 (USD MILLION)
- TABLE 53. VIETNAM CHEMICAL MECHANICAL POLISHING MARKET SIZE, BY APPLICATION, 2018-2030 (USD MILLION)
- TABLE 54. EUROPE, MIDDLE EAST & AFRICA CHEMICAL MECHANICAL POLISHING MARKET SIZE, BY CONSUMABLES, 2018-2030 (USD MILLION)
- TABLE 55. EUROPE, MIDDLE EAST & AFRICA CHEMICAL MECHANICAL POLISHING MARKET SIZE, BY APPLICATION, 2018-2030 (USD MILLION)
- TABLE 56. EUROPE, MIDDLE EAST & AFRICA CHEMICAL MECHANICAL POLISHING MARKET SIZE, BY COUNTRY, 2018-2030 (USD MILLION)
- TABLE 57. DENMARK CHEMICAL MECHANICAL POLISHING MARKET SIZE, BY CONSUMABLES, 2018-2030 (USD MILLION)
- TABLE 58. DENMARK CHEMICAL MECHANICAL POLISHING MARKET SIZE, BY APPLICATION, 2018-2030 (USD MILLION)
- TABLE 59. EGYPT CHEMICAL MECHANICAL POLISHING MARKET SIZE, BY CONSUMABLES, 2018-2030 (USD MILLION)
- TABLE 60. EGYPT CHEMICAL MECHANICAL POLISHING MARKET SIZE, BY APPLICATION, 2018-2030 (USD MILLION)
- TABLE 61. FINLAND CHEMICAL MECHANICAL POLISHING MARKET SIZE, BY CONSUMABLES, 2018-2030 (USD MILLION)
- TABLE 62. FINLAND CHEMICAL MECHANICAL POLISHING MARKET SIZE, BY APPLICATION, 2018-2030 (USD MILLION)
- TABLE 63. FRANCE CHEMICAL MECHANICAL POLISHING MARKET SIZE, BY CONSUMABLES, 2018-2030 (USD MILLION)
- TABLE 64. FRANCE CHEMICAL MECHANICAL POLISHING MARKET SIZE, BY APPLICATION, 2018-2030 (USD MILLION)
- TABLE 65. GERMANY CHEMICAL MECHANICAL POLISHING MARKET SIZE, BY CONSUMABLES, 2018-2030 (USD MILLION)
- TABLE 66. GERMANY CHEMICAL MECHANICAL POLISHING MARKET SIZE, BY APPLICATION, 2018-2030 (USD MILLION)
- TABLE 67. ISRAEL CHEMICAL MECHANICAL POLISHING MARKET SIZE, BY CONSUMABLES, 2018-2030 (USD MILLION)
- TABLE 68. ISRAEL CHEMICAL MECHANICAL POLISHING MARKET SIZE, BY APPLICATION, 2018-2030 (USD MILLION)
- TABLE 69. ITALY CHEMICAL MECHANICAL POLISHING MARKET SIZE, BY CONSUMABLES, 2018-2030 (USD MILLION)
- TABLE 70. ITALY CHEMICAL MECHANICAL POLISHING MARKET SIZE, BY APPLICATION, 2018-2030 (USD MILLION)
- TABLE 71. NETHERLANDS CHEMICAL MECHANICAL POLISHING MARKET SIZE, BY CONSUMABLES, 2018-2030 (USD MILLION)
- TABLE 72. NETHERLANDS CHEMICAL MECHANICAL POLISHING MARKET SIZE, BY APPLICATION, 2018-2030 (USD MILLION)
- TABLE 73. NIGERIA CHEMICAL MECHANICAL POLISHING MARKET SIZE, BY CONSUMABLES, 2018-2030 (USD MILLION)
- TABLE 74. NIGERIA CHEMICAL MECHANICAL POLISHING MARKET SIZE, BY APPLICATION, 2018-2030 (USD MILLION)
- TABLE 75. NORWAY CHEMICAL MECHANICAL POLISHING MARKET SIZE, BY CONSUMABLES, 2018-2030 (USD MILLION)
- TABLE 76. NORWAY CHEMICAL MECHANICAL POLISHING MARKET SIZE, BY APPLICATION, 2018-2030 (USD MILLION)
- TABLE 77. POLAND CHEMICAL MECHANICAL POLISHING MARKET SIZE, BY CONSUMABLES, 2018-2030 (USD MILLION)
- TABLE 78. POLAND CHEMICAL MECHANICAL POLISHING MARKET SIZE, BY APPLICATION, 2018-2030 (USD MILLION)
- TABLE 79. QATAR CHEMICAL MECHANICAL POLISHING MARKET SIZE, BY CONSUMABLES, 2018-2030 (USD MILLION)
- TABLE 80. QATAR CHEMICAL MECHANICAL POLISHING MARKET SIZE, BY APPLICATION, 2018-2030 (USD MILLION)
- TABLE 81. RUSSIA CHEMICAL MECHANICAL POLISHING MARKET SIZE, BY CONSUMABLES, 2018-2030 (USD MILLION)
- TABLE 82. RUSSIA CHEMICAL MECHANICAL POLISHING MARKET SIZE, BY APPLICATION, 2018-2030 (USD MILLION)
- TABLE 83. SAUDI ARABIA CHEMICAL MECHANICAL POLISHING MARKET SIZE, BY CONSUMABLES, 2018-2030 (USD MILLION)
- TABLE 84. SAUDI ARABIA CHEMICAL MECHANICAL POLISHING MARKET SIZE, BY APPLICATION, 2018-2030 (USD MILLION)
- TABLE 85. SOUTH AFRICA CHEMICAL MECHANICAL POLISHING MARKET SIZE, BY CONSUMABLES, 2018-2030 (USD MILLION)
- TABLE 86. SOUTH AFRICA CHEMICAL MECHANICAL POLISHING MARKET SIZE, BY APPLICATION, 2018-2030 (USD MILLION)
- TABLE 87. SPAIN CHEMICAL MECHANICAL POLISHING MARKET SIZE, BY CONSUMABLES, 2018-2030 (USD MILLION)
- TABLE 88. SPAIN CHEMICAL MECHANICAL POLISHING MARKET SIZE, BY APPLICATION, 2018-2030 (USD MILLION)
- TABLE 89. SWEDEN CHEMICAL MECHANICAL POLISHING MARKET SIZE, BY CONSUMABLES, 2018-2030 (USD MILLION)
- TABLE 90. SWEDEN CHEMICAL MECHANICAL POLISHING MARKET SIZE, BY APPLICATION, 2018-2030 (USD MILLION)
- TABLE 91. SWITZERLAND CHEMICAL MECHANICAL POLISHING MARKET SIZE, BY CONSUMABLES, 2018-2030 (USD MILLION)
- TABLE 92. SWITZERLAND CHEMICAL MECHANICAL POLISHING MARKET SIZE, BY APPLICATION, 2018-2030 (USD MILLION)
- TABLE 93. TURKEY CHEMICAL MECHANICAL POLISHING MARKET SIZE, BY CONSUMABLES, 2018-2030 (USD MILLION)
- TABLE 94. TURKEY CHEMICAL MECHANICAL POLISHING MARKET SIZE, BY APPLICATION, 2018-2030 (USD MILLION)
- TABLE 95. UNITED ARAB EMIRATES CHEMICAL MECHANICAL POLISHING MARKET SIZE, BY CONSUMABLES, 2018-2030 (USD MILLION)
- TABLE 96. UNITED ARAB EMIRATES CHEMICAL MECHANICAL POLISHING MARKET SIZE, BY APPLICATION, 2018-2030 (USD MILLION)
- TABLE 97. UNITED KINGDOM CHEMICAL MECHANICAL POLISHING MARKET SIZE, BY CONSUMABLES, 2018-2030 (USD MILLION)
- TABLE 98. UNITED KINGDOM CHEMICAL MECHANICAL POLISHING MARKET SIZE, BY APPLICATION, 2018-2030 (USD MILLION)
- TABLE 99. CHEMICAL MECHANICAL POLISHING MARKET, FPNV POSITIONING MATRIX, 2022
- TABLE 100. CHEMICAL MECHANICAL POLISHING MARKET SHARE, BY KEY PLAYER, 2022
- TABLE 101. CHEMICAL MECHANICAL POLISHING MARKET LICENSE & PRICING

