
PUBLISHER: Allied Market Research | PRODUCT CODE: 1298192

PUBLISHER: Allied Market Research | PRODUCT CODE: 1298192
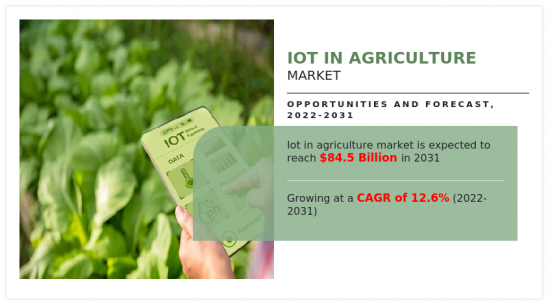
IOT in Agriculture Market By Application, By System, By Farm Type : Global Opportunity Analysis and Industry Forecast, 2021-2031
The global iot in agriculture market was valued at $27.1 billion in 2021, and is projected to reach $84.5 billion by 2031, growing at a CAGR of 12.6% from 2022 to 2031.The global iot in agriculture market was valued at $27.1 billion in 2021, and is projected to reach $84.5 billion by 2031, growing at a CAGR of 12.6% from 2022 to 2031.Agriculture is one of the most important activities in most of the countries across the globe. It has evolved from manual to a technology-based occupation in every aspect. The agriculture industry is open to innovation and adoption of Internet of Things (IoT) for further development of the sector by using information from weather stations, sensors, and other machinery. Internet of Things (IoT) can gather, use, and analyze vast amount of data that is used as an input for various algorithm-based outputs in the field of decision making. The data is used to help autonomous machines or humans to take accurate decisions to revolutionize the farming sector and deliver return on investment & tangible benefits to farmers.
The primary focus of IoT is to reduce cost, save time, and decrease wastage of power. In addition, IoT in agriculture provides benefits in areas such as health, safety, welfare, sustainability, and nutrition. These include livestock & plant disease monitoring, yield measurement, soil conditioning, quota systems, remote machine control, mobile platform controller, computer platform controller, greenhouse management, and livestock monitoring. The application of IoT in precision farming, livestock monitoring, smart greenhouse, and fish farm monitoring has helped increase production and generate higher returns.
For implying IoT to a farm land, the farmers need to have sensor networks, data analytics software, machine to machine communication, management system, and mobile or computer-based application. The complete tools of farm management coupled with information technology offer features such as critical decision capabilities that help take critical decisions at the appropriate time.
Because there is a connection between agriculture and climate change, global climate change has a considerable impact on agricultural production. Climate change has an impact on agriculture because it alters the atmosphere, rainfall patterns, and extreme weather events like heat waves. It also alters the amount of ozone in the atmosphere and the nutritional value of food. Brazil's agriculture, which is allegedly impacted by such climate challenges, is predicted to see a 10% reduction in maize production by 2055. Similar declines in agricultural production are anticipated in Eastern Australia and the Midwest of the United States due to the intense heat. While in Central and Eastern Europe, a decline in forest production is anticipated due to a lack of water. These severe climatic conditions play an important role in the deployment of IoT-based technology in agriculture to optimize the production and efficiency of the farm.
Small businesses in the agriculture sector provide solutions for various points along the value chain. Also, the market lacks a dominant operator that offers a solution for the entire value chain of agriculture. As a result, farmers find it challenging to attain economic scalability through the use of products and services provided by smaller companies. For instance, solutions to lower storage or transportation costs do not assist farmers in maximising their return on investment or achieving economic viability (ROI). Hence, the fragmented agriculture market limits the development of IoT in agriculture.
Due to data-driven methodologies for maximising and monitoring farm production, farmers are rapidly integrating internet-based technologies, such as smartphones, into their daily activities. The adoption of IoT in rural areas is boosted by connected wireless technologies like low-power wide-area network (LPWA) and Zigbee that enable high level communication protocols employing networks like low powered digital radio, Wi-Fi, and additional wireless sensor technologies. With the aid of these technology, farmers may gather vast amounts of field data that aids in a variety of agricultural operations, including field control, inventory control, pesticide spray control, resource purchase, planting, and crop harvesting.
The global IoT in agriculture market is expected to witness significant growth owing to increase in global population coupled with rise in demand for food. In addition, climate change hampers agricultural production, which is expected to fuel the growth of IoT-based technology solutions in the agriculture sector. IoT-based technology is expected to increase productivity and improve efficiency of a field equipment, which further boosts the market growth. Moreover, additional benefits of IoT in agriculture, such as water conservation and reduced wastage of fuel are expected to drive the IoT in agriculture market growth during the forecast period. However, high capital investment to develop the existing infrastructure and setup of IoT in the agriculture ecosystem emerge as challenge for farmers across developing economies, such as India, China, and Brazil. Nevertheless, surge in number of smartphones and internet penetration provide up-to-date information and latest developments in the agriculture sector to the farmers. In addition, increase in public-private partnership between the government agriculture department and state-owned enterprises to promote growth of sustainable agriculture by adoption of IoT is further expected to fuel the growth of the global IoT in agriculture market during the forecast period.
The Internet of Things (IoT) in agriculture market is segmented on the basis of system, application, and region. By system, the market is classified into automation & control systems, sensing & monitoring devices, livestock monitoring hardware, fish farming hardware, smart greenhouse hardware, and software. By application, it is categorized into precision farming, livestock monitoring, smart greenhouse, and fish farm monitoring. By region, it is analyzed across North America, Europe, Asia-Pacific, and LAMEA.
Some of the major players analyzed in the global Internet of Things (IoT) in agriculture report include: Cisco Systems, Inc., International Business Management Corporation (IBM), Telit, Hitachi, Ltd, Decisive Farming, Trimble Inc., OnFarm Systems Inc., Farmers Edge Inc., SlantRange, Inc., and The Climate Corporation.
Key Benefits For Stakeholders
- This report provides a quantitative analysis of the market segments, current trends, estimations, and dynamics of the iot in agriculture market analysis from 2021 to 2031 to identify the prevailing iot in agriculture market opportunities.
- The market research is offered along with information related to key drivers, restraints, and opportunities.
- Porter's five forces analysis highlights the potency of buyers and suppliers to enable stakeholders make profit-oriented business decisions and strengthen their supplier-buyer network.
- In-depth analysis of the iot in agriculture market segmentation assists to determine the prevailing market opportunities.
- Major countries in each region are mapped according to their revenue contribution to the global market.
- Market player positioning facilitates benchmarking and provides a clear understanding of the present position of the market players.
- The report includes the analysis of the regional as well as global iot in agriculture market trends, key players, market segments, application areas, and market growth strategies.
Key Market Segments
By System
- Automation and control systems
- Sensing and monitoring devices
- Livestock monitoring Hardware
- Fish farming hardware
- Smart greenhouse hardware
- Software
By Farm Type
- Large
- Mid Size
- Small Farms
By Application
- Precision farming
- Livestock monitoring
- Smart greenhouse
- Fish farm monitoring
By Region
- North America
- U.S.
- Canada
- Mexico
- Europe
- UK
- Germany
- France
- Italy
- Spain
- Russia
- Austria
- Netherlands
- Denmark
- Rest of Europe
- Asia-Pacific
- China
- India
- Japan
- Australia
- South Korea
- Thailand
- Malaysia
- Singapore
- Indonesia
- New Zealand
- Rest of Asia-Pacific
- LAMEA
- Brazil
- Argentina
- South Africa
- Middle East
- Saudi Arabia
- Egypt
- Nigeria
- Rest of LAMEA
Key Market Players:
- Cisco Systems, Inc.
- International Business Machines Corporation
- SWIIM System, Ltd.
- Trimble Inc.
- Climate LLC
- Telit Corporate Group
- Decisive Farming Corp.
- Hitachi, Ltd
- Farmers Edge Inc.
- SlantRange, Inc.
TABLE OF CONTENTS
CHAPTER 1: INTRODUCTION
- 1.1. Report description
- 1.2. Key market segments
- 1.3. Key benefits to the stakeholders
- 1.4. Research Methodology
- 1.4.1. Primary research
- 1.4.2. Secondary research
- 1.4.3. Analyst tools and models
CHAPTER 2: EXECUTIVE SUMMARY
- 2.1. CXO Perspective
CHAPTER 3: MARKET OVERVIEW
- 3.1. Market definition and scope
- 3.2. Key findings
- 3.2.1. Top impacting factors
- 3.2.2. Top investment pockets
- 3.3. Porter's five forces analysis
- 3.3.1. Bargaining power of suppliers
- 3.3.2. Bargaining power of buyers
- 3.3.3. Threat of substitutes
- 3.3.4. Threat of new entrants
- 3.3.5. Intensity of rivalry
- 3.4. Market dynamics
- 3.4.1. Drivers
- 3.4.1.1. Climate change
- 3.4.1.2. Emphasis on Increase in Efficiency
- 3.4.1.3. Adoption of Drones in Agriculture Applications
- 3.4.1. Drivers
- 3.4.2. Restraints
- 3.4.2.1. Fragmented Agricultural Market
- 3.4.2.2. High Capital Investment Requirement
- 3.4.3. Opportunities
- 3.4.3.1. Introduction of Smartphone and Internet Penetration
- 3.4.3.2. Increase in Public-Private Partnership
- 3.5. COVID-19 Impact Analysis on the market
CHAPTER 4: IOT IN AGRICULTURE MARKET, BY APPLICATION
- 4.1. Overview
- 4.1.1. Market size and forecast
- 4.2. Precision farming
- 4.2.1. Key market trends, growth factors and opportunities
- 4.2.2. Market size and forecast, by region
- 4.2.3. Market share analysis by country
- 4.3. Livestock monitoring
- 4.3.1. Key market trends, growth factors and opportunities
- 4.3.2. Market size and forecast, by region
- 4.3.3. Market share analysis by country
- 4.4. Smart greenhouse
- 4.4.1. Key market trends, growth factors and opportunities
- 4.4.2. Market size and forecast, by region
- 4.4.3. Market share analysis by country
- 4.5. Fish farm monitoring
- 4.5.1. Key market trends, growth factors and opportunities
- 4.5.2. Market size and forecast, by region
- 4.5.3. Market share analysis by country
CHAPTER 5: IOT IN AGRICULTURE MARKET, BY SYSTEM
- 5.1. Overview
- 5.1.1. Market size and forecast
- 5.2. Automation and control systems
- 5.2.1. Key market trends, growth factors and opportunities
- 5.2.2. Market size and forecast, by region
- 5.2.3. Market share analysis by country
- 5.3. Sensing and monitoring devices
- 5.3.1. Key market trends, growth factors and opportunities
- 5.3.2. Market size and forecast, by region
- 5.3.3. Market share analysis by country
- 5.4. Livestock monitoring Hardware
- 5.4.1. Key market trends, growth factors and opportunities
- 5.4.2. Market size and forecast, by region
- 5.4.3. Market share analysis by country
- 5.5. Fish farming hardware
- 5.5.1. Key market trends, growth factors and opportunities
- 5.5.2. Market size and forecast, by region
- 5.5.3. Market share analysis by country
- 5.6. Smart greenhouse hardware
- 5.6.1. Key market trends, growth factors and opportunities
- 5.6.2. Market size and forecast, by region
- 5.6.3. Market share analysis by country
- 5.7. Software
- 5.7.1. Key market trends, growth factors and opportunities
- 5.7.2. Market size and forecast, by region
- 5.7.3. Market share analysis by country
CHAPTER 6: IOT IN AGRICULTURE MARKET, BY FARM TYPE
- 6.1. Overview
- 6.1.1. Market size and forecast
- 6.2. Large
- 6.2.1. Key market trends, growth factors and opportunities
- 6.2.2. Market size and forecast, by region
- 6.2.3. Market share analysis by country
- 6.3. Mid Size
- 6.3.1. Key market trends, growth factors and opportunities
- 6.3.2. Market size and forecast, by region
- 6.3.3. Market share analysis by country
- 6.4. Small Farms
- 6.4.1. Key market trends, growth factors and opportunities
- 6.4.2. Market size and forecast, by region
- 6.4.3. Market share analysis by country
CHAPTER 7: IOT IN AGRICULTURE MARKET, BY REGION
- 7.1. Overview
- 7.1.1. Market size and forecast By Region
- 7.2. North America
- 7.2.1. Key trends and opportunities
- 7.2.2. Market size and forecast, by Application
- 7.2.3. Market size and forecast, by System
- 7.2.4. Market size and forecast, by Farm Type
- 7.2.5. Market size and forecast, by country
- 7.2.5.1. U.S.
- 7.2.5.1.1. Key market trends, growth factors and opportunities
- 7.2.5.1.2. Market size and forecast, by Application
- 7.2.5.1.3. Market size and forecast, by System
- 7.2.5.1.4. Market size and forecast, by Farm Type
- 7.2.5.2. Canada
- 7.2.5.2.1. Key market trends, growth factors and opportunities
- 7.2.5.2.2. Market size and forecast, by Application
- 7.2.5.2.3. Market size and forecast, by System
- 7.2.5.2.4. Market size and forecast, by Farm Type
- 7.2.5.3. Mexico
- 7.2.5.3.1. Key market trends, growth factors and opportunities
- 7.2.5.3.2. Market size and forecast, by Application
- 7.2.5.3.3. Market size and forecast, by System
- 7.2.5.3.4. Market size and forecast, by Farm Type
- 7.3. Europe
- 7.3.1. Key trends and opportunities
- 7.3.2. Market size and forecast, by Application
- 7.3.3. Market size and forecast, by System
- 7.3.4. Market size and forecast, by Farm Type
- 7.3.5. Market size and forecast, by country
- 7.3.5.1. UK
- 7.3.5.1.1. Key market trends, growth factors and opportunities
- 7.3.5.1.2. Market size and forecast, by Application
- 7.3.5.1.3. Market size and forecast, by System
- 7.3.5.1.4. Market size and forecast, by Farm Type
- 7.3.5.2. Germany
- 7.3.5.2.1. Key market trends, growth factors and opportunities
- 7.3.5.2.2. Market size and forecast, by Application
- 7.3.5.2.3. Market size and forecast, by System
- 7.3.5.2.4. Market size and forecast, by Farm Type
- 7.3.5.3. France
- 7.3.5.3.1. Key market trends, growth factors and opportunities
- 7.3.5.3.2. Market size and forecast, by Application
- 7.3.5.3.3. Market size and forecast, by System
- 7.3.5.3.4. Market size and forecast, by Farm Type
- 7.3.5.4. Italy
- 7.3.5.4.1. Key market trends, growth factors and opportunities
- 7.3.5.4.2. Market size and forecast, by Application
- 7.3.5.4.3. Market size and forecast, by System
- 7.3.5.4.4. Market size and forecast, by Farm Type
- 7.3.5.5. Spain
- 7.3.5.5.1. Key market trends, growth factors and opportunities
- 7.3.5.5.2. Market size and forecast, by Application
- 7.3.5.5.3. Market size and forecast, by System
- 7.3.5.5.4. Market size and forecast, by Farm Type
- 7.3.5.6. Russia
- 7.3.5.6.1. Key market trends, growth factors and opportunities
- 7.3.5.6.2. Market size and forecast, by Application
- 7.3.5.6.3. Market size and forecast, by System
- 7.3.5.6.4. Market size and forecast, by Farm Type
- 7.3.5.7. Austria
- 7.3.5.7.1. Key market trends, growth factors and opportunities
- 7.3.5.7.2. Market size and forecast, by Application
- 7.3.5.7.3. Market size and forecast, by System
- 7.3.5.7.4. Market size and forecast, by Farm Type
- 7.3.5.8. Netherlands
- 7.3.5.8.1. Key market trends, growth factors and opportunities
- 7.3.5.8.2. Market size and forecast, by Application
- 7.3.5.8.3. Market size and forecast, by System
- 7.3.5.8.4. Market size and forecast, by Farm Type
- 7.3.5.9. Denmark
- 7.3.5.9.1. Key market trends, growth factors and opportunities
- 7.3.5.9.2. Market size and forecast, by Application
- 7.3.5.9.3. Market size and forecast, by System
- 7.3.5.9.4. Market size and forecast, by Farm Type
- 7.3.5.10. Rest of Europe
- 7.3.5.10.1. Key market trends, growth factors and opportunities
- 7.3.5.10.2. Market size and forecast, by Application
- 7.3.5.10.3. Market size and forecast, by System
- 7.3.5.10.4. Market size and forecast, by Farm Type
- 7.4. Asia-Pacific
- 7.4.1. Key trends and opportunities
- 7.4.2. Market size and forecast, by Application
- 7.4.3. Market size and forecast, by System
- 7.4.4. Market size and forecast, by Farm Type
- 7.4.5. Market size and forecast, by country
- 7.4.5.1. China
- 7.4.5.1.1. Key market trends, growth factors and opportunities
- 7.4.5.1.2. Market size and forecast, by Application
- 7.4.5.1.3. Market size and forecast, by System
- 7.4.5.1.4. Market size and forecast, by Farm Type
- 7.4.5.2. India
- 7.4.5.2.1. Key market trends, growth factors and opportunities
- 7.4.5.2.2. Market size and forecast, by Application
- 7.4.5.2.3. Market size and forecast, by System
- 7.4.5.2.4. Market size and forecast, by Farm Type
- 7.4.5.3. Japan
- 7.4.5.3.1. Key market trends, growth factors and opportunities
- 7.4.5.3.2. Market size and forecast, by Application
- 7.4.5.3.3. Market size and forecast, by System
- 7.4.5.3.4. Market size and forecast, by Farm Type
- 7.4.5.4. Australia
- 7.4.5.4.1. Key market trends, growth factors and opportunities
- 7.4.5.4.2. Market size and forecast, by Application
- 7.4.5.4.3. Market size and forecast, by System
- 7.4.5.4.4. Market size and forecast, by Farm Type
- 7.4.5.5. South Korea
- 7.4.5.5.1. Key market trends, growth factors and opportunities
- 7.4.5.5.2. Market size and forecast, by Application
- 7.4.5.5.3. Market size and forecast, by System
- 7.4.5.5.4. Market size and forecast, by Farm Type
- 7.4.5.6. Thailand
- 7.4.5.6.1. Key market trends, growth factors and opportunities
- 7.4.5.6.2. Market size and forecast, by Application
- 7.4.5.6.3. Market size and forecast, by System
- 7.4.5.6.4. Market size and forecast, by Farm Type
- 7.4.5.7. Malaysia
- 7.4.5.7.1. Key market trends, growth factors and opportunities
- 7.4.5.7.2. Market size and forecast, by Application
- 7.4.5.7.3. Market size and forecast, by System
- 7.4.5.7.4. Market size and forecast, by Farm Type
- 7.4.5.8. Singapore
- 7.4.5.8.1. Key market trends, growth factors and opportunities
- 7.4.5.8.2. Market size and forecast, by Application
- 7.4.5.8.3. Market size and forecast, by System
- 7.4.5.8.4. Market size and forecast, by Farm Type
- 7.4.5.9. Indonesia
- 7.4.5.9.1. Key market trends, growth factors and opportunities
- 7.4.5.9.2. Market size and forecast, by Application
- 7.4.5.9.3. Market size and forecast, by System
- 7.4.5.9.4. Market size and forecast, by Farm Type
- 7.4.5.10. New Zealand
- 7.4.5.10.1. Key market trends, growth factors and opportunities
- 7.4.5.10.2. Market size and forecast, by Application
- 7.4.5.10.3. Market size and forecast, by System
- 7.4.5.10.4. Market size and forecast, by Farm Type
- 7.4.5.11. Rest of Asia-Pacific
- 7.4.5.11.1. Key market trends, growth factors and opportunities
- 7.4.5.11.2. Market size and forecast, by Application
- 7.4.5.11.3. Market size and forecast, by System
- 7.4.5.11.4. Market size and forecast, by Farm Type
- 7.5. LAMEA
- 7.5.1. Key trends and opportunities
- 7.5.2. Market size and forecast, by Application
- 7.5.3. Market size and forecast, by System
- 7.5.4. Market size and forecast, by Farm Type
- 7.5.5. Market size and forecast, by country
- 7.5.5.1. Brazil
- 7.5.5.1.1. Key market trends, growth factors and opportunities
- 7.5.5.1.2. Market size and forecast, by Application
- 7.5.5.1.3. Market size and forecast, by System
- 7.5.5.1.4. Market size and forecast, by Farm Type
- 7.5.5.2. Argentina
- 7.5.5.2.1. Key market trends, growth factors and opportunities
- 7.5.5.2.2. Market size and forecast, by Application
- 7.5.5.2.3. Market size and forecast, by System
- 7.5.5.2.4. Market size and forecast, by Farm Type
- 7.5.5.3. South Africa
- 7.5.5.3.1. Key market trends, growth factors and opportunities
- 7.5.5.3.2. Market size and forecast, by Application
- 7.5.5.3.3. Market size and forecast, by System
- 7.5.5.3.4. Market size and forecast, by Farm Type
- 7.5.5.4. Middle East
- 7.5.5.4.1. Key market trends, growth factors and opportunities
- 7.5.5.4.2. Market size and forecast, by Application
- 7.5.5.4.3. Market size and forecast, by System
- 7.5.5.4.4. Market size and forecast, by Farm Type
- 7.5.5.5. Saudi Arabia
- 7.5.5.5.1. Key market trends, growth factors and opportunities
- 7.5.5.5.2. Market size and forecast, by Application
- 7.5.5.5.3. Market size and forecast, by System
- 7.5.5.5.4. Market size and forecast, by Farm Type
- 7.5.5.6. Egypt
- 7.5.5.6.1. Key market trends, growth factors and opportunities
- 7.5.5.6.2. Market size and forecast, by Application
- 7.5.5.6.3. Market size and forecast, by System
- 7.5.5.6.4. Market size and forecast, by Farm Type
- 7.5.5.7. Nigeria
- 7.5.5.7.1. Key market trends, growth factors and opportunities
- 7.5.5.7.2. Market size and forecast, by Application
- 7.5.5.7.3. Market size and forecast, by System
- 7.5.5.7.4. Market size and forecast, by Farm Type
- 7.5.5.8. Rest of LAMEA
- 7.5.5.8.1. Key market trends, growth factors and opportunities
- 7.5.5.8.2. Market size and forecast, by Application
- 7.5.5.8.3. Market size and forecast, by System
- 7.5.5.8.4. Market size and forecast, by Farm Type
CHAPTER 8: COMPETITIVE LANDSCAPE
- 8.1. Introduction
- 8.2. Top winning strategies
- 8.3. Product Mapping of Top 10 Player
- 8.4. Competitive Dashboard
- 8.5. Competitive Heatmap
- 8.6. Top player positioning, 2021
CHAPTER 9: COMPANY PROFILES
- 9.1. Cisco Systems, Inc.
- 9.1.1. Company overview
- 9.1.2. Key Executives
- 9.1.3. Company snapshot
- 9.1.4. Operating business segments
- 9.1.5. Product portfolio
- 9.1.6. Business performance
- 9.2. Decisive Farming Corp.
- 9.2.1. Company overview
- 9.2.2. Key Executives
- 9.2.3. Company snapshot
- 9.2.4. Operating business segments
- 9.2.5. Product portfolio
- 9.3. Farmers Edge Inc.
- 9.3.1. Company overview
- 9.3.2. Key Executives
- 9.3.3. Company snapshot
- 9.3.4. Operating business segments
- 9.3.5. Product portfolio
- 9.3.6. Business performance
- 9.3.7. Key strategic moves and developments
- 9.4. International Business Machines Corporation
- 9.4.1. Company overview
- 9.4.2. Key Executives
- 9.4.3. Company snapshot
- 9.4.4. Operating business segments
- 9.4.5. Product portfolio
- 9.5. SWIIM System, Ltd.
- 9.5.1. Company overview
- 9.5.2. Key Executives
- 9.5.3. Company snapshot
- 9.5.4. Operating business segments
- 9.5.5. Product portfolio
- 9.5.6. Key strategic moves and developments
- 9.6. SlantRange, Inc.
- 9.6.1. Company overview
- 9.6.2. Key Executives
- 9.6.3. Company snapshot
- 9.6.4. Operating business segments
- 9.6.5. Product portfolio
- 9.7. Telit Corporate Group
- 9.7.1. Company overview
- 9.7.2. Key Executives
- 9.7.3. Company snapshot
- 9.7.4. Operating business segments
- 9.7.5. Product portfolio
- 9.7.6. Key strategic moves and developments
- 9.8. Climate LLC
- 9.8.1. Company overview
- 9.8.2. Key Executives
- 9.8.3. Company snapshot
- 9.8.4. Operating business segments
- 9.8.5. Product portfolio
- 9.9. Trimble Inc.
- 9.9.1. Company overview
- 9.9.2. Key Executives
- 9.9.3. Company snapshot
- 9.9.4. Operating business segments
- 9.9.5. Product portfolio
- 9.9.6. Business performance
- 9.9.7. Key strategic moves and developments
- 9.10. Hitachi, Ltd
- 9.10.1. Company overview
- 9.10.2. Key Executives
- 9.10.3. Company snapshot
- 9.10.4. Operating business segments
- 9.10.5. Product portfolio
- 9.10.6. Business performance
LIST OF TABLES
- TABLE 01. GLOBAL IOT IN AGRICULTURE MARKET, BY APPLICATION, 2021-2031 ($MILLION)
- TABLE 02. IOT IN AGRICULTURE MARKET FOR PRECISION FARMING, BY REGION, 2021-2031 ($MILLION)
- TABLE 03. IOT IN AGRICULTURE MARKET FOR LIVESTOCK MONITORING, BY REGION, 2021-2031 ($MILLION)
- TABLE 04. IOT IN AGRICULTURE MARKET FOR SMART GREENHOUSE, BY REGION, 2021-2031 ($MILLION)
- TABLE 05. IOT IN AGRICULTURE MARKET FOR FISH FARM MONITORING, BY REGION, 2021-2031 ($MILLION)
- TABLE 06. GLOBAL IOT IN AGRICULTURE MARKET, BY SYSTEM, 2021-2031 ($MILLION)
- TABLE 07. IOT IN AGRICULTURE MARKET FOR AUTOMATION AND CONTROL SYSTEMS, BY REGION, 2021-2031 ($MILLION)
- TABLE 08. IOT IN AGRICULTURE MARKET FOR SENSING AND MONITORING DEVICES, BY REGION, 2021-2031 ($MILLION)
- TABLE 09. IOT IN AGRICULTURE MARKET FOR LIVESTOCK MONITORING HARDWARE, BY REGION, 2021-2031 ($MILLION)
- TABLE 10. IOT IN AGRICULTURE MARKET FOR FISH FARMING HARDWARE, BY REGION, 2021-2031 ($MILLION)
- TABLE 11. IOT IN AGRICULTURE MARKET FOR SMART GREENHOUSE HARDWARE, BY REGION, 2021-2031 ($MILLION)
- TABLE 12. IOT IN AGRICULTURE MARKET FOR SOFTWARE, BY REGION, 2021-2031 ($MILLION)
- TABLE 13. GLOBAL IOT IN AGRICULTURE MARKET, BY FARM TYPE, 2021-2031 ($MILLION)
- TABLE 14. IOT IN AGRICULTURE MARKET FOR LARGE, BY REGION, 2021-2031 ($MILLION)
- TABLE 15. IOT IN AGRICULTURE MARKET FOR MID SIZE, BY REGION, 2021-2031 ($MILLION)
- TABLE 16. IOT IN AGRICULTURE MARKET FOR SMALL FARMS, BY REGION, 2021-2031 ($MILLION)
- TABLE 17. IOT IN AGRICULTURE MARKET, BY REGION, 2021-2031 ($MILLION)
- TABLE 18. NORTH AMERICA IOT IN AGRICULTURE MARKET, BY APPLICATION, 2021-2031 ($MILLION)
- TABLE 19. NORTH AMERICA IOT IN AGRICULTURE MARKET, BY SYSTEM, 2021-2031 ($MILLION)
- TABLE 20. NORTH AMERICA IOT IN AGRICULTURE MARKET, BY FARM TYPE, 2021-2031 ($MILLION)
- TABLE 21. NORTH AMERICA IOT IN AGRICULTURE MARKET, BY COUNTRY, 2021-2031 ($MILLION)
- TABLE 22. U.S. IOT IN AGRICULTURE MARKET, BY APPLICATION, 2021-2031 ($MILLION)
- TABLE 23. U.S. IOT IN AGRICULTURE MARKET, BY SYSTEM, 2021-2031 ($MILLION)
- TABLE 24. U.S. IOT IN AGRICULTURE MARKET, BY FARM TYPE, 2021-2031 ($MILLION)
- TABLE 25. CANADA IOT IN AGRICULTURE MARKET, BY APPLICATION, 2021-2031 ($MILLION)
- TABLE 26. CANADA IOT IN AGRICULTURE MARKET, BY SYSTEM, 2021-2031 ($MILLION)
- TABLE 27. CANADA IOT IN AGRICULTURE MARKET, BY FARM TYPE, 2021-2031 ($MILLION)
- TABLE 28. MEXICO IOT IN AGRICULTURE MARKET, BY APPLICATION, 2021-2031 ($MILLION)
- TABLE 29. MEXICO IOT IN AGRICULTURE MARKET, BY SYSTEM, 2021-2031 ($MILLION)
- TABLE 30. MEXICO IOT IN AGRICULTURE MARKET, BY FARM TYPE, 2021-2031 ($MILLION)
- TABLE 31. EUROPE IOT IN AGRICULTURE MARKET, BY APPLICATION, 2021-2031 ($MILLION)
- TABLE 32. EUROPE IOT IN AGRICULTURE MARKET, BY SYSTEM, 2021-2031 ($MILLION)
- TABLE 33. EUROPE IOT IN AGRICULTURE MARKET, BY FARM TYPE, 2021-2031 ($MILLION)
- TABLE 34. EUROPE IOT IN AGRICULTURE MARKET, BY COUNTRY, 2021-2031 ($MILLION)
- TABLE 35. UK IOT IN AGRICULTURE MARKET, BY APPLICATION, 2021-2031 ($MILLION)
- TABLE 36. UK IOT IN AGRICULTURE MARKET, BY SYSTEM, 2021-2031 ($MILLION)
- TABLE 37. UK IOT IN AGRICULTURE MARKET, BY FARM TYPE, 2021-2031 ($MILLION)
- TABLE 38. GERMANY IOT IN AGRICULTURE MARKET, BY APPLICATION, 2021-2031 ($MILLION)
- TABLE 39. GERMANY IOT IN AGRICULTURE MARKET, BY SYSTEM, 2021-2031 ($MILLION)
- TABLE 40. GERMANY IOT IN AGRICULTURE MARKET, BY FARM TYPE, 2021-2031 ($MILLION)
- TABLE 41. FRANCE IOT IN AGRICULTURE MARKET, BY APPLICATION, 2021-2031 ($MILLION)
- TABLE 42. FRANCE IOT IN AGRICULTURE MARKET, BY SYSTEM, 2021-2031 ($MILLION)
- TABLE 43. FRANCE IOT IN AGRICULTURE MARKET, BY FARM TYPE, 2021-2031 ($MILLION)
- TABLE 44. ITALY IOT IN AGRICULTURE MARKET, BY APPLICATION, 2021-2031 ($MILLION)
- TABLE 45. ITALY IOT IN AGRICULTURE MARKET, BY SYSTEM, 2021-2031 ($MILLION)
- TABLE 46. ITALY IOT IN AGRICULTURE MARKET, BY FARM TYPE, 2021-2031 ($MILLION)
- TABLE 47. SPAIN IOT IN AGRICULTURE MARKET, BY APPLICATION, 2021-2031 ($MILLION)
- TABLE 48. SPAIN IOT IN AGRICULTURE MARKET, BY SYSTEM, 2021-2031 ($MILLION)
- TABLE 49. SPAIN IOT IN AGRICULTURE MARKET, BY FARM TYPE, 2021-2031 ($MILLION)
- TABLE 50. RUSSIA IOT IN AGRICULTURE MARKET, BY APPLICATION, 2021-2031 ($MILLION)
- TABLE 51. RUSSIA IOT IN AGRICULTURE MARKET, BY SYSTEM, 2021-2031 ($MILLION)
- TABLE 52. RUSSIA IOT IN AGRICULTURE MARKET, BY FARM TYPE, 2021-2031 ($MILLION)
- TABLE 53. AUSTRIA IOT IN AGRICULTURE MARKET, BY APPLICATION, 2021-2031 ($MILLION)
- TABLE 54. AUSTRIA IOT IN AGRICULTURE MARKET, BY SYSTEM, 2021-2031 ($MILLION)
- TABLE 55. AUSTRIA IOT IN AGRICULTURE MARKET, BY FARM TYPE, 2021-2031 ($MILLION)
- TABLE 56. NETHERLANDS IOT IN AGRICULTURE MARKET, BY APPLICATION, 2021-2031 ($MILLION)
- TABLE 57. NETHERLANDS IOT IN AGRICULTURE MARKET, BY SYSTEM, 2021-2031 ($MILLION)
- TABLE 58. NETHERLANDS IOT IN AGRICULTURE MARKET, BY FARM TYPE, 2021-2031 ($MILLION)
- TABLE 59. DENMARK IOT IN AGRICULTURE MARKET, BY APPLICATION, 2021-2031 ($MILLION)
- TABLE 60. DENMARK IOT IN AGRICULTURE MARKET, BY SYSTEM, 2021-2031 ($MILLION)
- TABLE 61. DENMARK IOT IN AGRICULTURE MARKET, BY FARM TYPE, 2021-2031 ($MILLION)
- TABLE 62. REST OF EUROPE IOT IN AGRICULTURE MARKET, BY APPLICATION, 2021-2031 ($MILLION)
- TABLE 63. REST OF EUROPE IOT IN AGRICULTURE MARKET, BY SYSTEM, 2021-2031 ($MILLION)
- TABLE 64. REST OF EUROPE IOT IN AGRICULTURE MARKET, BY FARM TYPE, 2021-2031 ($MILLION)
- TABLE 65. ASIA-PACIFIC IOT IN AGRICULTURE MARKET, BY APPLICATION, 2021-2031 ($MILLION)
- TABLE 66. ASIA-PACIFIC IOT IN AGRICULTURE MARKET, BY SYSTEM, 2021-2031 ($MILLION)
- TABLE 67. ASIA-PACIFIC IOT IN AGRICULTURE MARKET, BY FARM TYPE, 2021-2031 ($MILLION)
- TABLE 68. ASIA-PACIFIC IOT IN AGRICULTURE MARKET, BY COUNTRY, 2021-2031 ($MILLION)
- TABLE 69. CHINA IOT IN AGRICULTURE MARKET, BY APPLICATION, 2021-2031 ($MILLION)
- TABLE 70. CHINA IOT IN AGRICULTURE MARKET, BY SYSTEM, 2021-2031 ($MILLION)
- TABLE 71. CHINA IOT IN AGRICULTURE MARKET, BY FARM TYPE, 2021-2031 ($MILLION)
- TABLE 72. INDIA IOT IN AGRICULTURE MARKET, BY APPLICATION, 2021-2031 ($MILLION)
- TABLE 73. INDIA IOT IN AGRICULTURE MARKET, BY SYSTEM, 2021-2031 ($MILLION)
- TABLE 74. INDIA IOT IN AGRICULTURE MARKET, BY FARM TYPE, 2021-2031 ($MILLION)
- TABLE 75. JAPAN IOT IN AGRICULTURE MARKET, BY APPLICATION, 2021-2031 ($MILLION)
- TABLE 76. JAPAN IOT IN AGRICULTURE MARKET, BY SYSTEM, 2021-2031 ($MILLION)
- TABLE 77. JAPAN IOT IN AGRICULTURE MARKET, BY FARM TYPE, 2021-2031 ($MILLION)
- TABLE 78. AUSTRALIA IOT IN AGRICULTURE MARKET, BY APPLICATION, 2021-2031 ($MILLION)
- TABLE 79. AUSTRALIA IOT IN AGRICULTURE MARKET, BY SYSTEM, 2021-2031 ($MILLION)
- TABLE 80. AUSTRALIA IOT IN AGRICULTURE MARKET, BY FARM TYPE, 2021-2031 ($MILLION)
- TABLE 81. SOUTH KOREA IOT IN AGRICULTURE MARKET, BY APPLICATION, 2021-2031 ($MILLION)
- TABLE 82. SOUTH KOREA IOT IN AGRICULTURE MARKET, BY SYSTEM, 2021-2031 ($MILLION)
- TABLE 83. SOUTH KOREA IOT IN AGRICULTURE MARKET, BY FARM TYPE, 2021-2031 ($MILLION)
- TABLE 84. THAILAND IOT IN AGRICULTURE MARKET, BY APPLICATION, 2021-2031 ($MILLION)
- TABLE 85. THAILAND IOT IN AGRICULTURE MARKET, BY SYSTEM, 2021-2031 ($MILLION)
- TABLE 86. THAILAND IOT IN AGRICULTURE MARKET, BY FARM TYPE, 2021-2031 ($MILLION)
- TABLE 87. MALAYSIA IOT IN AGRICULTURE MARKET, BY APPLICATION, 2021-2031 ($MILLION)
- TABLE 88. MALAYSIA IOT IN AGRICULTURE MARKET, BY SYSTEM, 2021-2031 ($MILLION)
- TABLE 89. MALAYSIA IOT IN AGRICULTURE MARKET, BY FARM TYPE, 2021-2031 ($MILLION)
- TABLE 90. SINGAPORE IOT IN AGRICULTURE MARKET, BY APPLICATION, 2021-2031 ($MILLION)
- TABLE 91. SINGAPORE IOT IN AGRICULTURE MARKET, BY SYSTEM, 2021-2031 ($MILLION)
- TABLE 92. SINGAPORE IOT IN AGRICULTURE MARKET, BY FARM TYPE, 2021-2031 ($MILLION)
- TABLE 93. INDONESIA IOT IN AGRICULTURE MARKET, BY APPLICATION, 2021-2031 ($MILLION)
- TABLE 94. INDONESIA IOT IN AGRICULTURE MARKET, BY SYSTEM, 2021-2031 ($MILLION)
- TABLE 95. INDONESIA IOT IN AGRICULTURE MARKET, BY FARM TYPE, 2021-2031 ($MILLION)
- TABLE 96. NEW ZEALAND IOT IN AGRICULTURE MARKET, BY APPLICATION, 2021-2031 ($MILLION)
- TABLE 97. NEW ZEALAND IOT IN AGRICULTURE MARKET, BY SYSTEM, 2021-2031 ($MILLION)
- TABLE 98. NEW ZEALAND IOT IN AGRICULTURE MARKET, BY FARM TYPE, 2021-2031 ($MILLION)
- TABLE 99. REST OF ASIA-PACIFIC IOT IN AGRICULTURE MARKET, BY APPLICATION, 2021-2031 ($MILLION)
- TABLE 100. REST OF ASIA-PACIFIC IOT IN AGRICULTURE MARKET, BY SYSTEM, 2021-2031 ($MILLION)
- TABLE 101. REST OF ASIA-PACIFIC IOT IN AGRICULTURE MARKET, BY FARM TYPE, 2021-2031 ($MILLION)
- TABLE 102. LAMEA IOT IN AGRICULTURE MARKET, BY APPLICATION, 2021-2031 ($MILLION)
- TABLE 103. LAMEA IOT IN AGRICULTURE MARKET, BY SYSTEM, 2021-2031 ($MILLION)
- TABLE 104. LAMEA IOT IN AGRICULTURE MARKET, BY FARM TYPE, 2021-2031 ($MILLION)
- TABLE 105. LAMEA IOT IN AGRICULTURE MARKET, BY COUNTRY, 2021-2031 ($MILLION)
- TABLE 106. BRAZIL IOT IN AGRICULTURE MARKET, BY APPLICATION, 2021-2031 ($MILLION)
- TABLE 107. BRAZIL IOT IN AGRICULTURE MARKET, BY SYSTEM, 2021-2031 ($MILLION)
- TABLE 108. BRAZIL IOT IN AGRICULTURE MARKET, BY FARM TYPE, 2021-2031 ($MILLION)
- TABLE 109. ARGENTINA IOT IN AGRICULTURE MARKET, BY APPLICATION, 2021-2031 ($MILLION)
- TABLE 110. ARGENTINA IOT IN AGRICULTURE MARKET, BY SYSTEM, 2021-2031 ($MILLION)
- TABLE 111. ARGENTINA IOT IN AGRICULTURE MARKET, BY FARM TYPE, 2021-2031 ($MILLION)
- TABLE 112. SOUTH AFRICA IOT IN AGRICULTURE MARKET, BY APPLICATION, 2021-2031 ($MILLION)
- TABLE 113. SOUTH AFRICA IOT IN AGRICULTURE MARKET, BY SYSTEM, 2021-2031 ($MILLION)
- TABLE 114. SOUTH AFRICA IOT IN AGRICULTURE MARKET, BY FARM TYPE, 2021-2031 ($MILLION)
- TABLE 115. MIDDLE EAST IOT IN AGRICULTURE MARKET, BY APPLICATION, 2021-2031 ($MILLION)
- TABLE 116. MIDDLE EAST IOT IN AGRICULTURE MARKET, BY SYSTEM, 2021-2031 ($MILLION)
- TABLE 117. MIDDLE EAST IOT IN AGRICULTURE MARKET, BY FARM TYPE, 2021-2031 ($MILLION)
- TABLE 118. SAUDI ARABIA IOT IN AGRICULTURE MARKET, BY APPLICATION, 2021-2031 ($MILLION)
- TABLE 119. SAUDI ARABIA IOT IN AGRICULTURE MARKET, BY SYSTEM, 2021-2031 ($MILLION)
- TABLE 120. SAUDI ARABIA IOT IN AGRICULTURE MARKET, BY FARM TYPE, 2021-2031 ($MILLION)
- TABLE 121. EGYPT IOT IN AGRICULTURE MARKET, BY APPLICATION, 2021-2031 ($MILLION)
- TABLE 122. EGYPT IOT IN AGRICULTURE MARKET, BY SYSTEM, 2021-2031 ($MILLION)
- TABLE 123. EGYPT IOT IN AGRICULTURE MARKET, BY FARM TYPE, 2021-2031 ($MILLION)
- TABLE 124. NIGERIA IOT IN AGRICULTURE MARKET, BY APPLICATION, 2021-2031 ($MILLION)
- TABLE 125. NIGERIA IOT IN AGRICULTURE MARKET, BY SYSTEM, 2021-2031 ($MILLION)
- TABLE 126. NIGERIA IOT IN AGRICULTURE MARKET, BY FARM TYPE, 2021-2031 ($MILLION)
- TABLE 127. REST OF LAMEA IOT IN AGRICULTURE MARKET, BY APPLICATION, 2021-2031 ($MILLION)
- TABLE 128. REST OF LAMEA IOT IN AGRICULTURE MARKET, BY SYSTEM, 2021-2031 ($MILLION)
- TABLE 129. REST OF LAMEA IOT IN AGRICULTURE MARKET, BY FARM TYPE, 2021-2031 ($MILLION)
- TABLE 130. CISCO SYSTEMS, INC.: KEY EXECUTIVES
- TABLE 131. CISCO SYSTEMS, INC.: COMPANY SNAPSHOT
- TABLE 132. CISCO SYSTEMS, INC.: PRODUCT SEGMENTS
- TABLE 133. CISCO SYSTEMS, INC.: PRODUCT PORTFOLIO
- TABLE 134. DECISIVE FARMING CORP.: KEY EXECUTIVES
- TABLE 135. DECISIVE FARMING CORP.: COMPANY SNAPSHOT
- TABLE 136. DECISIVE FARMING CORP.: PRODUCT SEGMENTS
- TABLE 137. DECISIVE FARMING CORP.: PRODUCT PORTFOLIO
- TABLE 138. FARMERS EDGE INC.: KEY EXECUTIVES
- TABLE 139. FARMERS EDGE INC.: COMPANY SNAPSHOT
- TABLE 140. FARMERS EDGE INC.: PRODUCT SEGMENTS
- TABLE 141. FARMERS EDGE INC.: PRODUCT PORTFOLIO
- TABLE 142. FARMERS EDGE INC.: KEY STRATERGIES
- TABLE 143. INTERNATIONAL BUSINESS MACHINES CORPORATION: KEY EXECUTIVES
- TABLE 144. INTERNATIONAL BUSINESS MACHINES CORPORATION: COMPANY SNAPSHOT
- TABLE 145. INTERNATIONAL BUSINESS MACHINES CORPORATION: PRODUCT SEGMENTS
- TABLE 146. INTERNATIONAL BUSINESS MACHINES CORPORATION: PRODUCT PORTFOLIO
- TABLE 147. SWIIM SYSTEM, LTD.: KEY EXECUTIVES
- TABLE 148. SWIIM SYSTEM, LTD.: COMPANY SNAPSHOT
- TABLE 149. SWIIM SYSTEM, LTD.: PRODUCT SEGMENTS
- TABLE 150. SWIIM SYSTEM, LTD.: PRODUCT PORTFOLIO
- TABLE 151. SWIIM SYSTEM, LTD.: KEY STRATERGIES
- TABLE 152. SLANTRANGE, INC.: KEY EXECUTIVES
- TABLE 153. SLANTRANGE, INC.: COMPANY SNAPSHOT
- TABLE 154. SLANTRANGE, INC.: PRODUCT SEGMENTS
- TABLE 155. SLANTRANGE, INC.: PRODUCT PORTFOLIO
- TABLE 156. TELIT CORPORATE GROUP: KEY EXECUTIVES
- TABLE 157. TELIT CORPORATE GROUP: COMPANY SNAPSHOT
- TABLE 158. TELIT CORPORATE GROUP: PRODUCT SEGMENTS
- TABLE 159. TELIT CORPORATE GROUP: SERVICE SEGMENTS
- TABLE 160. TELIT CORPORATE GROUP: PRODUCT PORTFOLIO
- TABLE 161. TELIT CORPORATE GROUP: KEY STRATERGIES
- TABLE 162. CLIMATE LLC: KEY EXECUTIVES
- TABLE 163. CLIMATE LLC: COMPANY SNAPSHOT
- TABLE 164. CLIMATE LLC: PRODUCT SEGMENTS
- TABLE 165. CLIMATE LLC: PRODUCT PORTFOLIO
- TABLE 166. TRIMBLE INC.: KEY EXECUTIVES
- TABLE 167. TRIMBLE INC.: COMPANY SNAPSHOT
- TABLE 168. TRIMBLE INC.: SERVICE SEGMENTS
- TABLE 169. TRIMBLE INC.: PRODUCT PORTFOLIO
- TABLE 170. TRIMBLE INC.: KEY STRATERGIES
- TABLE 171. HITACHI, LTD: KEY EXECUTIVES
- TABLE 172. HITACHI, LTD: COMPANY SNAPSHOT
- TABLE 173. HITACHI, LTD: SERVICE SEGMENTS
- TABLE 174. HITACHI, LTD: PRODUCT PORTFOLIO
LIST OF FIGURES
- FIGURE 01. IOT IN AGRICULTURE MARKET, 2021-2031
- FIGURE 02. SEGMENTATION OF IOT IN AGRICULTURE MARKET, 2021-2031
- FIGURE 03. TOP INVESTMENT POCKETS IN IOT IN AGRICULTURE MARKET (2022-2031)
- FIGURE 04. LOW BARGAINING POWER OF SUPPLIERS
- FIGURE 05. LOW BARGAINING POWER OF BUYERS
- FIGURE 06. LOW THREAT OF SUBSTITUTES
- FIGURE 07. LOW THREAT OF NEW ENTRANTS
- FIGURE 08. LOW INTENSITY OF RIVALRY
- FIGURE 09. DRIVERS, RESTRAINTS AND OPPORTUNITIES: GLOBALIOT IN AGRICULTURE MARKET
- FIGURE 10. IOT IN AGRICULTURE MARKET, BY APPLICATION, 2021(%)
- FIGURE 11. COMPARATIVE SHARE ANALYSIS OF IOT IN AGRICULTURE MARKET FOR PRECISION FARMING, BY COUNTRY 2021 AND 2031(%)
- FIGURE 12. COMPARATIVE SHARE ANALYSIS OF IOT IN AGRICULTURE MARKET FOR LIVESTOCK MONITORING, BY COUNTRY 2021 AND 2031(%)
- FIGURE 13. COMPARATIVE SHARE ANALYSIS OF IOT IN AGRICULTURE MARKET FOR SMART GREENHOUSE, BY COUNTRY 2021 AND 2031(%)
- FIGURE 14. COMPARATIVE SHARE ANALYSIS OF IOT IN AGRICULTURE MARKET FOR FISH FARM MONITORING, BY COUNTRY 2021 AND 2031(%)
- FIGURE 15. IOT IN AGRICULTURE MARKET, BY SYSTEM, 2021(%)
- FIGURE 16. COMPARATIVE SHARE ANALYSIS OF IOT IN AGRICULTURE MARKET FOR AUTOMATION AND CONTROL SYSTEMS, BY COUNTRY 2021 AND 2031(%)
- FIGURE 17. COMPARATIVE SHARE ANALYSIS OF IOT IN AGRICULTURE MARKET FOR SENSING AND MONITORING DEVICES, BY COUNTRY 2021 AND 2031(%)
- FIGURE 18. COMPARATIVE SHARE ANALYSIS OF IOT IN AGRICULTURE MARKET FOR LIVESTOCK MONITORING HARDWARE, BY COUNTRY 2021 AND 2031(%)
- FIGURE 19. COMPARATIVE SHARE ANALYSIS OF IOT IN AGRICULTURE MARKET FOR FISH FARMING HARDWARE, BY COUNTRY 2021 AND 2031(%)
- FIGURE 20. COMPARATIVE SHARE ANALYSIS OF IOT IN AGRICULTURE MARKET FOR SMART GREENHOUSE HARDWARE, BY COUNTRY 2021 AND 2031(%)
- FIGURE 21. COMPARATIVE SHARE ANALYSIS OF IOT IN AGRICULTURE MARKET FOR SOFTWARE, BY COUNTRY 2021 AND 2031(%)
- FIGURE 22. IOT IN AGRICULTURE MARKET, BY FARM TYPE, 2021(%)
- FIGURE 23. COMPARATIVE SHARE ANALYSIS OF IOT IN AGRICULTURE MARKET FOR LARGE, BY COUNTRY 2021 AND 2031(%)
- FIGURE 24. COMPARATIVE SHARE ANALYSIS OF IOT IN AGRICULTURE MARKET FOR MID SIZE, BY COUNTRY 2021 AND 2031(%)
- FIGURE 25. COMPARATIVE SHARE ANALYSIS OF IOT IN AGRICULTURE MARKET FOR SMALL FARMS, BY COUNTRY 2021 AND 2031(%)
- FIGURE 26. IOT IN AGRICULTURE MARKET BY REGION, 2021
- FIGURE 27. U.S. IOT IN AGRICULTURE MARKET, 2021-2031 ($MILLION)
- FIGURE 28. CANADA IOT IN AGRICULTURE MARKET, 2021-2031 ($MILLION)
- FIGURE 29. MEXICO IOT IN AGRICULTURE MARKET, 2021-2031 ($MILLION)
- FIGURE 30. UK IOT IN AGRICULTURE MARKET, 2021-2031 ($MILLION)
- FIGURE 31. GERMANY IOT IN AGRICULTURE MARKET, 2021-2031 ($MILLION)
- FIGURE 32. FRANCE IOT IN AGRICULTURE MARKET, 2021-2031 ($MILLION)
- FIGURE 33. ITALY IOT IN AGRICULTURE MARKET, 2021-2031 ($MILLION)
- FIGURE 34. SPAIN IOT IN AGRICULTURE MARKET, 2021-2031 ($MILLION)
- FIGURE 35. RUSSIA IOT IN AGRICULTURE MARKET, 2021-2031 ($MILLION)
- FIGURE 36. AUSTRIA IOT IN AGRICULTURE MARKET, 2021-2031 ($MILLION)
- FIGURE 37. NETHERLANDS IOT IN AGRICULTURE MARKET, 2021-2031 ($MILLION)
- FIGURE 38. DENMARK IOT IN AGRICULTURE MARKET, 2021-2031 ($MILLION)
- FIGURE 39. REST OF EUROPE IOT IN AGRICULTURE MARKET, 2021-2031 ($MILLION)
- FIGURE 40. CHINA IOT IN AGRICULTURE MARKET, 2021-2031 ($MILLION)
- FIGURE 41. INDIA IOT IN AGRICULTURE MARKET, 2021-2031 ($MILLION)
- FIGURE 42. JAPAN IOT IN AGRICULTURE MARKET, 2021-2031 ($MILLION)
- FIGURE 43. AUSTRALIA IOT IN AGRICULTURE MARKET, 2021-2031 ($MILLION)
- FIGURE 44. SOUTH KOREA IOT IN AGRICULTURE MARKET, 2021-2031 ($MILLION)
- FIGURE 45. THAILAND IOT IN AGRICULTURE MARKET, 2021-2031 ($MILLION)
- FIGURE 46. MALAYSIA IOT IN AGRICULTURE MARKET, 2021-2031 ($MILLION)
- FIGURE 47. SINGAPORE IOT IN AGRICULTURE MARKET, 2021-2031 ($MILLION)
- FIGURE 48. INDONESIA IOT IN AGRICULTURE MARKET, 2021-2031 ($MILLION)
- FIGURE 49. NEW ZEALAND IOT IN AGRICULTURE MARKET, 2021-2031 ($MILLION)
- FIGURE 50. REST OF ASIA-PACIFIC IOT IN AGRICULTURE MARKET, 2021-2031 ($MILLION)
- FIGURE 51. BRAZIL IOT IN AGRICULTURE MARKET, 2021-2031 ($MILLION)
- FIGURE 52. ARGENTINA IOT IN AGRICULTURE MARKET, 2021-2031 ($MILLION)
- FIGURE 53. SOUTH AFRICA IOT IN AGRICULTURE MARKET, 2021-2031 ($MILLION)
- FIGURE 54. MIDDLE EAST IOT IN AGRICULTURE MARKET, 2021-2031 ($MILLION)
- FIGURE 55. SAUDI ARABIA IOT IN AGRICULTURE MARKET, 2021-2031 ($MILLION)
- FIGURE 56. EGYPT IOT IN AGRICULTURE MARKET, 2021-2031 ($MILLION)
- FIGURE 57. NIGERIA IOT IN AGRICULTURE MARKET, 2021-2031 ($MILLION)
- FIGURE 58. REST OF LAMEA IOT IN AGRICULTURE MARKET, 2021-2031 ($MILLION)
- FIGURE 59. TOP WINNING STRATEGIES, BY YEAR
- FIGURE 60. TOP WINNING STRATEGIES, BY DEVELOPMENT
- FIGURE 61. TOP WINNING STRATEGIES, BY COMPANY
- FIGURE 62. PRODUCT MAPPING OF TOP 10 PLAYERS
- FIGURE 63. COMPETITIVE DASHBOARD
- FIGURE 64. COMPETITIVE HEATMAP: IOT IN AGRICULTURE MARKET
- FIGURE 65. TOP PLAYER POSITIONING, 2021
- FIGURE 66. CISCO SYSTEMS, INC.: NET REVENUE, 2020-2022 ($MILLION)
- FIGURE 67. CISCO SYSTEMS, INC.: RESEARCH & DEVELOPMENT EXPENDITURE, 2020-2022 ($MILLION)
- FIGURE 68. CISCO SYSTEMS, INC.: REVENUE SHARE BY SEGMENT, 2022 (%)
- FIGURE 69. FARMERS EDGE INC.: NET REVENUE, 2019-2021 ($MILLION)
- FIGURE 70. FARMERS EDGE INC.: REVENUE SHARE BY REGION, 2021 (%)
- FIGURE 71. TRIMBLE INC.: NET REVENUE, 2019-2021 ($MILLION)
- FIGURE 72. TRIMBLE INC.: REVENUE SHARE BY SEGMENT, 2021 (%)
- FIGURE 73. HITACHI, LTD: NET REVENUE, 2019-2021 ($MILLION)
- FIGURE 74. HITACHI, LTD: REVENUE SHARE BY SEGMENT, 2020 (%)
- FIGURE 75. HITACHI, LTD: REVENUE SHARE BY REGION, 2020 (%)

