
PUBLISHER: Allied Market Research | PRODUCT CODE: 1298215

PUBLISHER: Allied Market Research | PRODUCT CODE: 1298215
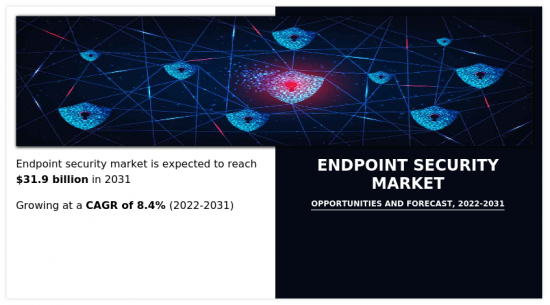
Endpoint Security Market By Solution Type, By Deployment Mode, By Enterprise Size (Large Enterprises, Small and Medium-Sized Enterprises ), By Industry Vertical : Global Opportunity Analysis and Industry Forecast, 2021-2031
Endpoint security guards against malicious activities and campaigns on endpoints, or entry points, of end-user devices like desktops, laptops, and mobile devices. Technologies for endpoint security stop cyber dangers from getting to endpoints on a network or in the cloud. There is an increase in the number of PCs, laptops, smartphones, tablets, and point-of-sale terminals with rise in population and digitalization of industrial operations. Moreover, the number of endpoints in global networks will increase in tandem with the proliferation of smart gadgets. Security is obligatory because there are more endpoint gadgets. Furthermore, endpoint security solutions are becoming increasingly important among different end users worldwide as a result of the rise in number of data breaches that have occurred across numerous industries and exposed millions of customer data records to hackers and caused the loss of millions of dollars for several impacted firms. A variety of endpoints that are susceptible to attacks have been developed as a result of the growing adoption of BYOD trends in organizations.
Furthermore, factors such as increased use of bring your own devices (BYOD) and number of connected devices primarily drive the growth of the endpoint security market. However, lack of skilled workers hampers market growth to some extent. Moreover, the increase in adoption of AI enabled automated responses is expected to provide lucrative opportunities for the market growth during the forecast period.
Depending on the deployment mode, the on-premise segment dominated the endpoint security market share in 2021 and is expected to continue this dominance during the forecast period, owing to end-to-end control over the software, protection of intellectual property within the business, and the ability to implement significant customization of the software as needed. On-premises deployments have fewer security issues than cloud-based deployments because the software is deployed on independent computers. However, the cloud segment is expected to witness the highest growth in the upcoming years, owing to the flexibility and financial advantages that come with cloud services. Also, the development of cloud-based endpoint security has boosted venture capital investments among businesses producing endpoint security software.
Region wise, the endpoint security market was dominated by North America in 2021 and is expected to retain its position during the forecast period, owing to the increased number of connected devices in use that has also increased the security risks faced by organizations. However, Asia-Pacific is expected to witness the highest growth in the upcoming years, owing to rapid growth in technologies such as AI, IoT, connected devices, cloud services is attributed to the high demand of high endpoint device protection in Asia-Pacific. Key players in the Asia-Pacific region are adapting strategies such as acquisition and collaboration to improve endpoint security services.
Segment review
The endpoint security market is segmented on the basis of solution type, deployment mode, enterprise size, industry vertical, and region. On the basis of solution type, it is bifurcated into endpoint protection platform (EPP) and endpoint detection and response (EDR). On the basis of deployment mode, it is segregated into on-premises and cloud. On the basis of enterprise size, it is classified into large enterprise and Small and Medium-Sized Enterprises (SMEs). On the basis industry vertical, it is divided into IT and telecom, healthcare, manufacturing, BFSI, retail and e-commerce, government and defense, and other. On the basis of region, it is analyzed across North America, Europe, Asia-Pacific, and LAMEA.
The global endpoint security industry is dominated by key players such as Microsoft Corporation, CrowdStrike, Check Point Software Technologies Ltd., Cisco Systems Inc., Trend Micro Incorporated, Broadcom, AO Kaspersky Lab, SentinelOne, McAfee, LLC, and Comodo Security Solutions, Inc.. These players have adopted various strategies to increase their market penetration and strengthen their position in endpoint security industry.
Top impacting factors
Increased use of Bring Your Own Devices (BYOD)
Businesses are increasingly adopting a bring your own device (BYOD) strategy to give employees flexibility. However, using the attackers' strategy targets employee-owned devices because few businesses provide adequate protection for employee-owned devices. Very few companies presently deploy endpoint security for employee's devices in their security management. Similarly, smart smartphones make it simple for hackers to obtain internal data. Furthermore, it is necessary to safeguard and track every internal action, to secure the enterprise's confidential data. The number of endpoints in organizations has grown as a result of the widespread use of mobile devices, connected devices, and remote location servers. The likelihood of assaults and data breaches may rise because of the growing endpoint population. In addition, every terminal is protected by endpoint solutions, which also monitor suspicious activity and device behavior. Therefore, the surge in adoption of BYOD policies is expected to fuel the growth of the endpoint security market.
Rise in number of connected devices
Increase in digitalization and connected gadgets are responsible for an increase in network attacks across all industries. The attackers pick endpoints to access a secure network of a company. These attackers can use laptops, smartphones, wearable technology, and other similar devices to get around the secured corporate network. In addition, endpoint assaults are likely to increase as more solutions like the internet of things (IOT), industrial control systems, and smart sensors are adopted. In recent years, many enterprises disclosed endpoint data breach assaults. However, these are the attacks that were registered, in reality the actual count had been a lot more than these reported attacks. For instance, Cisco Systems, Inc. stated that it could protect its clients from 20 billion threats every day in 2018. The adoption of the endpoint security solutions is being accelerated by these instant detection and reaction solutions. Thus, the rise in number of connected devices and security breaches have significantly increased the endpoint security market growth in recent years.
Key Benefits For Stakeholders
- This report provides a quantitative analysis of the market segments, current trends, estimations, and dynamics of the endpoint security market analysis from 2021 to 2031 to identify the prevailing endpoint security market opportunities.
- The market research is offered along with information related to key drivers, restraints, and opportunities.
- Porter's five forces analysis highlights the potency of buyers and suppliers to enable stakeholders make profit-oriented business decisions and strengthen their supplier-buyer network.
- In-depth analysis of the endpoint security market segmentation assists to determine the prevailing market opportunities.
- Major countries in each region are mapped according to their revenue contribution to the global market.
- Market player positioning facilitates benchmarking and provides a clear understanding of the present position of the market players.
- The report includes the analysis of the regional as well as global endpoint security market trends, key players, market segments, application areas, and market growth strategies.
Key Market Segments
By Solution Type
- Endpoint Protection Platform
- Endpoint Detection and Response
By Deployment Mode
- On-premise
- Cloud
By Enterprise Size
- Large Enterprises
- Small and Medium-Sized Enterprises (SMEs)
By Industry Vertical
- IT and Telecom
- Healthcare
- Manufacturing
- BFSI
- Retail and E-commerce
- Government and Defense
- Other
By Region
- North America
- U.S.
- Canada
- Europe
- UK
- Germany
- France
- Italy
- Spain
- Rest of Europe
- Asia-Pacific
- China
- India
- Japan
- Australia
- South Korea
- Rest of Asia-Pacific
- LAMEA
- Latin America
- Middle East
- Africa
Key Market Players:
- Microsoft Corporation
- CrowdStrike
- Check Point Software Technologies Ltd.
- Trend Micro Incorporated
- Broadcom
- SentinelOne
- McAfee, LLC
- Cisco Systems Inc.
- AO Kaspersky Lab
- Comodo Security Solutions, Inc.
TABLE OF CONTENTS
CHAPTER 1: INTRODUCTION
- 1.1. Report description
- 1.2. Key market segments
- 1.3. Key benefits to the stakeholders
- 1.4. Research Methodology
- 1.4.1. Primary research
- 1.4.2. Secondary research
- 1.4.3. Analyst tools and models
CHAPTER 2: EXECUTIVE SUMMARY
- 2.1. CXO Perspective
CHAPTER 3: MARKET OVERVIEW
- 3.1. Market definition and scope
- 3.2. Key findings
- 3.2.1. Top impacting factors
- 3.2.2. Top investment pockets
- 3.3. Porter's five forces analysis
- 3.3.1. Bargaining power of suppliers
- 3.3.2. Bargaining power of buyers
- 3.3.3. Threat of substitutes
- 3.3.4. Threat of new entrants
- 3.3.5. Intensity of rivalry
- 3.4. Market dynamics
- 3.4.1. Drivers
- 3.4.1.1. Increased Use of Bring Your Own Devices
- 3.4.1.2. Rise in number of connected devices
- 3.4.1. Drivers
- 3.4.2. Restraints
- 3.4.2.1. Lack of Skilled Workers
- 3.4.3. Opportunities
- 3.4.3.1. Increasing adoption of AI enabled automated responses
- 3.5. COVID-19 Impact Analysis on the market
CHAPTER 4: ENDPOINT SECURITY MARKET, BY SOLUTION TYPE
- 4.1. Overview
- 4.1.1. Market size and forecast
- 4.2. Endpoint Protection Platform
- 4.2.1. Key market trends, growth factors and opportunities
- 4.2.2. Market size and forecast, by region
- 4.2.3. Market share analysis by country
- 4.3. Endpoint Detection and Response
- 4.3.1. Key market trends, growth factors and opportunities
- 4.3.2. Market size and forecast, by region
- 4.3.3. Market share analysis by country
CHAPTER 5: ENDPOINT SECURITY MARKET, BY DEPLOYMENT MODE
- 5.1. Overview
- 5.1.1. Market size and forecast
- 5.2. On-premise
- 5.2.1. Key market trends, growth factors and opportunities
- 5.2.2. Market size and forecast, by region
- 5.2.3. Market share analysis by country
- 5.3. Cloud
- 5.3.1. Key market trends, growth factors and opportunities
- 5.3.2. Market size and forecast, by region
- 5.3.3. Market share analysis by country
CHAPTER 6: ENDPOINT SECURITY MARKET, BY ENTERPRISE SIZE
- 6.1. Overview
- 6.1.1. Market size and forecast
- 6.2. Large Enterprises
- 6.2.1. Key market trends, growth factors and opportunities
- 6.2.2. Market size and forecast, by region
- 6.2.3. Market share analysis by country
- 6.3. Small and Medium-Sized Enterprises (SMEs)
- 6.3.1. Key market trends, growth factors and opportunities
- 6.3.2. Market size and forecast, by region
- 6.3.3. Market share analysis by country
CHAPTER 7: ENDPOINT SECURITY MARKET, BY INDUSTRY VERTICAL
- 7.1. Overview
- 7.1.1. Market size and forecast
- 7.2. IT and Telecom
- 7.2.1. Key market trends, growth factors and opportunities
- 7.2.2. Market size and forecast, by region
- 7.2.3. Market share analysis by country
- 7.3. Healthcare
- 7.3.1. Key market trends, growth factors and opportunities
- 7.3.2. Market size and forecast, by region
- 7.3.3. Market share analysis by country
- 7.4. Manufacturing
- 7.4.1. Key market trends, growth factors and opportunities
- 7.4.2. Market size and forecast, by region
- 7.4.3. Market share analysis by country
- 7.5. BFSI
- 7.5.1. Key market trends, growth factors and opportunities
- 7.5.2. Market size and forecast, by region
- 7.5.3. Market share analysis by country
- 7.6. Retail and E-commerce
- 7.6.1. Key market trends, growth factors and opportunities
- 7.6.2. Market size and forecast, by region
- 7.6.3. Market share analysis by country
- 7.7. Government and Defense
- 7.7.1. Key market trends, growth factors and opportunities
- 7.7.2. Market size and forecast, by region
- 7.7.3. Market share analysis by country
- 7.8. Other
- 7.8.1. Key market trends, growth factors and opportunities
- 7.8.2. Market size and forecast, by region
- 7.8.3. Market share analysis by country
CHAPTER 8: ENDPOINT SECURITY MARKET, BY REGION
- 8.1. Overview
- 8.1.1. Market size and forecast By Region
- 8.2. North America
- 8.2.1. Key trends and opportunities
- 8.2.2. Market size and forecast, by Solution Type
- 8.2.3. Market size and forecast, by Deployment Mode
- 8.2.4. Market size and forecast, by Enterprise Size
- 8.2.5. Market size and forecast, by Industry Vertical
- 8.2.6. Market size and forecast, by country
- 8.2.6.1. U.S.
- 8.2.6.1.1. Key market trends, growth factors and opportunities
- 8.2.6.1.2. Market size and forecast, by Solution Type
- 8.2.6.1.3. Market size and forecast, by Deployment Mode
- 8.2.6.1.4. Market size and forecast, by Enterprise Size
- 8.2.6.1.5. Market size and forecast, by Industry Vertical
- 8.2.6.2. Canada
- 8.2.6.2.1. Key market trends, growth factors and opportunities
- 8.2.6.2.2. Market size and forecast, by Solution Type
- 8.2.6.2.3. Market size and forecast, by Deployment Mode
- 8.2.6.2.4. Market size and forecast, by Enterprise Size
- 8.2.6.2.5. Market size and forecast, by Industry Vertical
- 8.3. Europe
- 8.3.1. Key trends and opportunities
- 8.3.2. Market size and forecast, by Solution Type
- 8.3.3. Market size and forecast, by Deployment Mode
- 8.3.4. Market size and forecast, by Enterprise Size
- 8.3.5. Market size and forecast, by Industry Vertical
- 8.3.6. Market size and forecast, by country
- 8.3.6.1. UK
- 8.3.6.1.1. Key market trends, growth factors and opportunities
- 8.3.6.1.2. Market size and forecast, by Solution Type
- 8.3.6.1.3. Market size and forecast, by Deployment Mode
- 8.3.6.1.4. Market size and forecast, by Enterprise Size
- 8.3.6.1.5. Market size and forecast, by Industry Vertical
- 8.3.6.2. Germany
- 8.3.6.2.1. Key market trends, growth factors and opportunities
- 8.3.6.2.2. Market size and forecast, by Solution Type
- 8.3.6.2.3. Market size and forecast, by Deployment Mode
- 8.3.6.2.4. Market size and forecast, by Enterprise Size
- 8.3.6.2.5. Market size and forecast, by Industry Vertical
- 8.3.6.3. France
- 8.3.6.3.1. Key market trends, growth factors and opportunities
- 8.3.6.3.2. Market size and forecast, by Solution Type
- 8.3.6.3.3. Market size and forecast, by Deployment Mode
- 8.3.6.3.4. Market size and forecast, by Enterprise Size
- 8.3.6.3.5. Market size and forecast, by Industry Vertical
- 8.3.6.4. Italy
- 8.3.6.4.1. Key market trends, growth factors and opportunities
- 8.3.6.4.2. Market size and forecast, by Solution Type
- 8.3.6.4.3. Market size and forecast, by Deployment Mode
- 8.3.6.4.4. Market size and forecast, by Enterprise Size
- 8.3.6.4.5. Market size and forecast, by Industry Vertical
- 8.3.6.5. Spain
- 8.3.6.5.1. Key market trends, growth factors and opportunities
- 8.3.6.5.2. Market size and forecast, by Solution Type
- 8.3.6.5.3. Market size and forecast, by Deployment Mode
- 8.3.6.5.4. Market size and forecast, by Enterprise Size
- 8.3.6.5.5. Market size and forecast, by Industry Vertical
- 8.3.6.6. Rest of Europe
- 8.3.6.6.1. Key market trends, growth factors and opportunities
- 8.3.6.6.2. Market size and forecast, by Solution Type
- 8.3.6.6.3. Market size and forecast, by Deployment Mode
- 8.3.6.6.4. Market size and forecast, by Enterprise Size
- 8.3.6.6.5. Market size and forecast, by Industry Vertical
- 8.4. Asia-Pacific
- 8.4.1. Key trends and opportunities
- 8.4.2. Market size and forecast, by Solution Type
- 8.4.3. Market size and forecast, by Deployment Mode
- 8.4.4. Market size and forecast, by Enterprise Size
- 8.4.5. Market size and forecast, by Industry Vertical
- 8.4.6. Market size and forecast, by country
- 8.4.6.1. China
- 8.4.6.1.1. Key market trends, growth factors and opportunities
- 8.4.6.1.2. Market size and forecast, by Solution Type
- 8.4.6.1.3. Market size and forecast, by Deployment Mode
- 8.4.6.1.4. Market size and forecast, by Enterprise Size
- 8.4.6.1.5. Market size and forecast, by Industry Vertical
- 8.4.6.2. India
- 8.4.6.2.1. Key market trends, growth factors and opportunities
- 8.4.6.2.2. Market size and forecast, by Solution Type
- 8.4.6.2.3. Market size and forecast, by Deployment Mode
- 8.4.6.2.4. Market size and forecast, by Enterprise Size
- 8.4.6.2.5. Market size and forecast, by Industry Vertical
- 8.4.6.3. Japan
- 8.4.6.3.1. Key market trends, growth factors and opportunities
- 8.4.6.3.2. Market size and forecast, by Solution Type
- 8.4.6.3.3. Market size and forecast, by Deployment Mode
- 8.4.6.3.4. Market size and forecast, by Enterprise Size
- 8.4.6.3.5. Market size and forecast, by Industry Vertical
- 8.4.6.4. Australia
- 8.4.6.4.1. Key market trends, growth factors and opportunities
- 8.4.6.4.2. Market size and forecast, by Solution Type
- 8.4.6.4.3. Market size and forecast, by Deployment Mode
- 8.4.6.4.4. Market size and forecast, by Enterprise Size
- 8.4.6.4.5. Market size and forecast, by Industry Vertical
- 8.4.6.5. South Korea
- 8.4.6.5.1. Key market trends, growth factors and opportunities
- 8.4.6.5.2. Market size and forecast, by Solution Type
- 8.4.6.5.3. Market size and forecast, by Deployment Mode
- 8.4.6.5.4. Market size and forecast, by Enterprise Size
- 8.4.6.5.5. Market size and forecast, by Industry Vertical
- 8.4.6.6. Rest of Asia-Pacific
- 8.4.6.6.1. Key market trends, growth factors and opportunities
- 8.4.6.6.2. Market size and forecast, by Solution Type
- 8.4.6.6.3. Market size and forecast, by Deployment Mode
- 8.4.6.6.4. Market size and forecast, by Enterprise Size
- 8.4.6.6.5. Market size and forecast, by Industry Vertical
- 8.5. LAMEA
- 8.5.1. Key trends and opportunities
- 8.5.2. Market size and forecast, by Solution Type
- 8.5.3. Market size and forecast, by Deployment Mode
- 8.5.4. Market size and forecast, by Enterprise Size
- 8.5.5. Market size and forecast, by Industry Vertical
- 8.5.6. Market size and forecast, by country
- 8.5.6.1. Latin America
- 8.5.6.1.1. Key market trends, growth factors and opportunities
- 8.5.6.1.2. Market size and forecast, by Solution Type
- 8.5.6.1.3. Market size and forecast, by Deployment Mode
- 8.5.6.1.4. Market size and forecast, by Enterprise Size
- 8.5.6.1.5. Market size and forecast, by Industry Vertical
- 8.5.6.2. Middle East
- 8.5.6.2.1. Key market trends, growth factors and opportunities
- 8.5.6.2.2. Market size and forecast, by Solution Type
- 8.5.6.2.3. Market size and forecast, by Deployment Mode
- 8.5.6.2.4. Market size and forecast, by Enterprise Size
- 8.5.6.2.5. Market size and forecast, by Industry Vertical
- 8.5.6.3. Africa
- 8.5.6.3.1. Key market trends, growth factors and opportunities
- 8.5.6.3.2. Market size and forecast, by Solution Type
- 8.5.6.3.3. Market size and forecast, by Deployment Mode
- 8.5.6.3.4. Market size and forecast, by Enterprise Size
- 8.5.6.3.5. Market size and forecast, by Industry Vertical
CHAPTER 9: COMPETITIVE LANDSCAPE
- 9.1. Introduction
- 9.2. Top winning strategies
- 9.3. Product Mapping of Top 10 Player
- 9.4. Competitive Dashboard
- 9.5. Competitive Heatmap
- 9.6. Top player positioning, 2021
CHAPTER 10: COMPANY PROFILES
- 10.1. Microsoft Corporation
- 10.1.1. Company overview
- 10.1.2. Key Executives
- 10.1.3. Company snapshot
- 10.1.4. Operating business segments
- 10.1.5. Product portfolio
- 10.1.6. Business performance
- 10.1.7. Key strategic moves and developments
- 10.2. CrowdStrike
- 10.2.1. Company overview
- 10.2.2. Key Executives
- 10.2.3. Company snapshot
- 10.2.4. Operating business segments
- 10.2.5. Product portfolio
- 10.2.6. Business performance
- 10.2.7. Key strategic moves and developments
- 10.3. Check Point Software Technologies Ltd.
- 10.3.1. Company overview
- 10.3.2. Key Executives
- 10.3.3. Company snapshot
- 10.3.4. Operating business segments
- 10.3.5. Product portfolio
- 10.3.6. Business performance
- 10.3.7. Key strategic moves and developments
- 10.4. Cisco Systems Inc.
- 10.4.1. Company overview
- 10.4.2. Key Executives
- 10.4.3. Company snapshot
- 10.4.4. Operating business segments
- 10.4.5. Product portfolio
- 10.4.6. Business performance
- 10.4.7. Key strategic moves and developments
- 10.5. Trend Micro Incorporated
- 10.5.1. Company overview
- 10.5.2. Key Executives
- 10.5.3. Company snapshot
- 10.5.4. Operating business segments
- 10.5.5. Product portfolio
- 10.5.6. Business performance
- 10.5.7. Key strategic moves and developments
- 10.6. Broadcom
- 10.6.1. Company overview
- 10.6.2. Key Executives
- 10.6.3. Company snapshot
- 10.6.4. Operating business segments
- 10.6.5. Product portfolio
- 10.6.6. Business performance
- 10.6.7. Key strategic moves and developments
- 10.7. AO Kaspersky Lab
- 10.7.1. Company overview
- 10.7.2. Key Executives
- 10.7.3. Company snapshot
- 10.7.4. Operating business segments
- 10.7.5. Product portfolio
- 10.7.6. Key strategic moves and developments
- 10.8. Comodo Security Solutions, Inc.
- 10.8.1. Company overview
- 10.8.2. Key Executives
- 10.8.3. Company snapshot
- 10.8.4. Operating business segments
- 10.8.5. Product portfolio
- 10.8.6. Key strategic moves and developments
- 10.9. McAfee, LLC
- 10.9.1. Company overview
- 10.9.2. Key Executives
- 10.9.3. Company snapshot
- 10.9.4. Operating business segments
- 10.9.5. Product portfolio
- 10.9.6. Key strategic moves and developments
- 10.10. SentinelOne
- 10.10.1. Company overview
- 10.10.2. Key Executives
- 10.10.3. Company snapshot
- 10.10.4. Operating business segments
- 10.10.5. Product portfolio
- 10.10.6. Business performance
- 10.10.7. Key strategic moves and developments
LIST OF TABLES
- TABLE 01. GLOBAL ENDPOINT SECURITY MARKET, BY SOLUTION TYPE, 2021-2031 ($BILLION)
- TABLE 02. ENDPOINT SECURITY MARKET FOR ENDPOINT PROTECTION PLATFORM, BY REGION, 2021-2031 ($BILLION)
- TABLE 03. ENDPOINT SECURITY MARKET FOR ENDPOINT DETECTION AND RESPONSE, BY REGION, 2021-2031 ($BILLION)
- TABLE 04. GLOBAL ENDPOINT SECURITY MARKET, BY DEPLOYMENT MODE, 2021-2031 ($BILLION)
- TABLE 05. ENDPOINT SECURITY MARKET FOR ON-PREMISE, BY REGION, 2021-2031 ($BILLION)
- TABLE 06. ENDPOINT SECURITY MARKET FOR CLOUD, BY REGION, 2021-2031 ($BILLION)
- TABLE 07. GLOBAL ENDPOINT SECURITY MARKET, BY ENTERPRISE SIZE, 2021-2031 ($BILLION)
- TABLE 08. ENDPOINT SECURITY MARKET FOR LARGE ENTERPRISES, BY REGION, 2021-2031 ($BILLION)
- TABLE 09. ENDPOINT SECURITY MARKET FOR SMALL AND MEDIUM-SIZED ENTERPRISES (SMES), BY REGION, 2021-2031 ($BILLION)
- TABLE 10. GLOBAL ENDPOINT SECURITY MARKET, BY INDUSTRY VERTICAL, 2021-2031 ($BILLION)
- TABLE 11. ENDPOINT SECURITY MARKET FOR IT AND TELECOM, BY REGION, 2021-2031 ($BILLION)
- TABLE 12. ENDPOINT SECURITY MARKET FOR HEALTHCARE, BY REGION, 2021-2031 ($BILLION)
- TABLE 13. ENDPOINT SECURITY MARKET FOR MANUFACTURING, BY REGION, 2021-2031 ($BILLION)
- TABLE 14. ENDPOINT SECURITY MARKET FOR BFSI, BY REGION, 2021-2031 ($BILLION)
- TABLE 15. ENDPOINT SECURITY MARKET FOR RETAIL AND E-COMMERCE, BY REGION, 2021-2031 ($BILLION)
- TABLE 16. ENDPOINT SECURITY MARKET FOR GOVERNMENT AND DEFENSE, BY REGION, 2021-2031 ($BILLION)
- TABLE 17. ENDPOINT SECURITY MARKET FOR OTHER, BY REGION, 2021-2031 ($BILLION)
- TABLE 18. ENDPOINT SECURITY MARKET, BY REGION, 2021-2031 ($BILLION)
- TABLE 19. NORTH AMERICA ENDPOINT SECURITY MARKET, BY SOLUTION TYPE, 2021-2031 ($BILLION)
- TABLE 20. NORTH AMERICA ENDPOINT SECURITY MARKET, BY DEPLOYMENT MODE, 2021-2031 ($BILLION)
- TABLE 21. NORTH AMERICA ENDPOINT SECURITY MARKET, BY ENTERPRISE SIZE, 2021-2031 ($BILLION)
- TABLE 22. NORTH AMERICA ENDPOINT SECURITY MARKET, BY INDUSTRY VERTICAL, 2021-2031 ($BILLION)
- TABLE 23. NORTH AMERICA ENDPOINT SECURITY MARKET, BY COUNTRY, 2021-2031 ($BILLION)
- TABLE 24. U.S. ENDPOINT SECURITY MARKET, BY SOLUTION TYPE, 2021-2031 ($BILLION)
- TABLE 25. U.S. ENDPOINT SECURITY MARKET, BY DEPLOYMENT MODE, 2021-2031 ($BILLION)
- TABLE 26. U.S. ENDPOINT SECURITY MARKET, BY ENTERPRISE SIZE, 2021-2031 ($BILLION)
- TABLE 27. U.S. ENDPOINT SECURITY MARKET, BY INDUSTRY VERTICAL, 2021-2031 ($BILLION)
- TABLE 28. CANADA ENDPOINT SECURITY MARKET, BY SOLUTION TYPE, 2021-2031 ($BILLION)
- TABLE 29. CANADA ENDPOINT SECURITY MARKET, BY DEPLOYMENT MODE, 2021-2031 ($BILLION)
- TABLE 30. CANADA ENDPOINT SECURITY MARKET, BY ENTERPRISE SIZE, 2021-2031 ($BILLION)
- TABLE 31. CANADA ENDPOINT SECURITY MARKET, BY INDUSTRY VERTICAL, 2021-2031 ($BILLION)
- TABLE 32. EUROPE ENDPOINT SECURITY MARKET, BY SOLUTION TYPE, 2021-2031 ($BILLION)
- TABLE 33. EUROPE ENDPOINT SECURITY MARKET, BY DEPLOYMENT MODE, 2021-2031 ($BILLION)
- TABLE 34. EUROPE ENDPOINT SECURITY MARKET, BY ENTERPRISE SIZE, 2021-2031 ($BILLION)
- TABLE 35. EUROPE ENDPOINT SECURITY MARKET, BY INDUSTRY VERTICAL, 2021-2031 ($BILLION)
- TABLE 36. EUROPE ENDPOINT SECURITY MARKET, BY COUNTRY, 2021-2031 ($BILLION)
- TABLE 37. UK ENDPOINT SECURITY MARKET, BY SOLUTION TYPE, 2021-2031 ($BILLION)
- TABLE 38. UK ENDPOINT SECURITY MARKET, BY DEPLOYMENT MODE, 2021-2031 ($BILLION)
- TABLE 39. UK ENDPOINT SECURITY MARKET, BY ENTERPRISE SIZE, 2021-2031 ($BILLION)
- TABLE 40. UK ENDPOINT SECURITY MARKET, BY INDUSTRY VERTICAL, 2021-2031 ($BILLION)
- TABLE 41. GERMANY ENDPOINT SECURITY MARKET, BY SOLUTION TYPE, 2021-2031 ($BILLION)
- TABLE 42. GERMANY ENDPOINT SECURITY MARKET, BY DEPLOYMENT MODE, 2021-2031 ($BILLION)
- TABLE 43. GERMANY ENDPOINT SECURITY MARKET, BY ENTERPRISE SIZE, 2021-2031 ($BILLION)
- TABLE 44. GERMANY ENDPOINT SECURITY MARKET, BY INDUSTRY VERTICAL, 2021-2031 ($BILLION)
- TABLE 45. FRANCE ENDPOINT SECURITY MARKET, BY SOLUTION TYPE, 2021-2031 ($BILLION)
- TABLE 46. FRANCE ENDPOINT SECURITY MARKET, BY DEPLOYMENT MODE, 2021-2031 ($BILLION)
- TABLE 47. FRANCE ENDPOINT SECURITY MARKET, BY ENTERPRISE SIZE, 2021-2031 ($BILLION)
- TABLE 48. FRANCE ENDPOINT SECURITY MARKET, BY INDUSTRY VERTICAL, 2021-2031 ($BILLION)
- TABLE 49. ITALY ENDPOINT SECURITY MARKET, BY SOLUTION TYPE, 2021-2031 ($BILLION)
- TABLE 50. ITALY ENDPOINT SECURITY MARKET, BY DEPLOYMENT MODE, 2021-2031 ($BILLION)
- TABLE 51. ITALY ENDPOINT SECURITY MARKET, BY ENTERPRISE SIZE, 2021-2031 ($BILLION)
- TABLE 52. ITALY ENDPOINT SECURITY MARKET, BY INDUSTRY VERTICAL, 2021-2031 ($BILLION)
- TABLE 53. SPAIN ENDPOINT SECURITY MARKET, BY SOLUTION TYPE, 2021-2031 ($BILLION)
- TABLE 54. SPAIN ENDPOINT SECURITY MARKET, BY DEPLOYMENT MODE, 2021-2031 ($BILLION)
- TABLE 55. SPAIN ENDPOINT SECURITY MARKET, BY ENTERPRISE SIZE, 2021-2031 ($BILLION)
- TABLE 56. SPAIN ENDPOINT SECURITY MARKET, BY INDUSTRY VERTICAL, 2021-2031 ($BILLION)
- TABLE 57. REST OF EUROPE ENDPOINT SECURITY MARKET, BY SOLUTION TYPE, 2021-2031 ($BILLION)
- TABLE 58. REST OF EUROPE ENDPOINT SECURITY MARKET, BY DEPLOYMENT MODE, 2021-2031 ($BILLION)
- TABLE 59. REST OF EUROPE ENDPOINT SECURITY MARKET, BY ENTERPRISE SIZE, 2021-2031 ($BILLION)
- TABLE 60. REST OF EUROPE ENDPOINT SECURITY MARKET, BY INDUSTRY VERTICAL, 2021-2031 ($BILLION)
- TABLE 61. ASIA-PACIFIC ENDPOINT SECURITY MARKET, BY SOLUTION TYPE, 2021-2031 ($BILLION)
- TABLE 62. ASIA-PACIFIC ENDPOINT SECURITY MARKET, BY DEPLOYMENT MODE, 2021-2031 ($BILLION)
- TABLE 63. ASIA-PACIFIC ENDPOINT SECURITY MARKET, BY ENTERPRISE SIZE, 2021-2031 ($BILLION)
- TABLE 64. ASIA-PACIFIC ENDPOINT SECURITY MARKET, BY INDUSTRY VERTICAL, 2021-2031 ($BILLION)
- TABLE 65. ASIA-PACIFIC ENDPOINT SECURITY MARKET, BY COUNTRY, 2021-2031 ($BILLION)
- TABLE 66. CHINA ENDPOINT SECURITY MARKET, BY SOLUTION TYPE, 2021-2031 ($BILLION)
- TABLE 67. CHINA ENDPOINT SECURITY MARKET, BY DEPLOYMENT MODE, 2021-2031 ($BILLION)
- TABLE 68. CHINA ENDPOINT SECURITY MARKET, BY ENTERPRISE SIZE, 2021-2031 ($BILLION)
- TABLE 69. CHINA ENDPOINT SECURITY MARKET, BY INDUSTRY VERTICAL, 2021-2031 ($BILLION)
- TABLE 70. INDIA ENDPOINT SECURITY MARKET, BY SOLUTION TYPE, 2021-2031 ($BILLION)
- TABLE 71. INDIA ENDPOINT SECURITY MARKET, BY DEPLOYMENT MODE, 2021-2031 ($BILLION)
- TABLE 72. INDIA ENDPOINT SECURITY MARKET, BY ENTERPRISE SIZE, 2021-2031 ($BILLION)
- TABLE 73. INDIA ENDPOINT SECURITY MARKET, BY INDUSTRY VERTICAL, 2021-2031 ($BILLION)
- TABLE 74. JAPAN ENDPOINT SECURITY MARKET, BY SOLUTION TYPE, 2021-2031 ($BILLION)
- TABLE 75. JAPAN ENDPOINT SECURITY MARKET, BY DEPLOYMENT MODE, 2021-2031 ($BILLION)
- TABLE 76. JAPAN ENDPOINT SECURITY MARKET, BY ENTERPRISE SIZE, 2021-2031 ($BILLION)
- TABLE 77. JAPAN ENDPOINT SECURITY MARKET, BY INDUSTRY VERTICAL, 2021-2031 ($BILLION)
- TABLE 78. AUSTRALIA ENDPOINT SECURITY MARKET, BY SOLUTION TYPE, 2021-2031 ($BILLION)
- TABLE 79. AUSTRALIA ENDPOINT SECURITY MARKET, BY DEPLOYMENT MODE, 2021-2031 ($BILLION)
- TABLE 80. AUSTRALIA ENDPOINT SECURITY MARKET, BY ENTERPRISE SIZE, 2021-2031 ($BILLION)
- TABLE 81. AUSTRALIA ENDPOINT SECURITY MARKET, BY INDUSTRY VERTICAL, 2021-2031 ($BILLION)
- TABLE 82. SOUTH KOREA ENDPOINT SECURITY MARKET, BY SOLUTION TYPE, 2021-2031 ($BILLION)
- TABLE 83. SOUTH KOREA ENDPOINT SECURITY MARKET, BY DEPLOYMENT MODE, 2021-2031 ($BILLION)
- TABLE 84. SOUTH KOREA ENDPOINT SECURITY MARKET, BY ENTERPRISE SIZE, 2021-2031 ($BILLION)
- TABLE 85. SOUTH KOREA ENDPOINT SECURITY MARKET, BY INDUSTRY VERTICAL, 2021-2031 ($BILLION)
- TABLE 86. REST OF ASIA-PACIFIC ENDPOINT SECURITY MARKET, BY SOLUTION TYPE, 2021-2031 ($BILLION)
- TABLE 87. REST OF ASIA-PACIFIC ENDPOINT SECURITY MARKET, BY DEPLOYMENT MODE, 2021-2031 ($BILLION)
- TABLE 88. REST OF ASIA-PACIFIC ENDPOINT SECURITY MARKET, BY ENTERPRISE SIZE, 2021-2031 ($BILLION)
- TABLE 89. REST OF ASIA-PACIFIC ENDPOINT SECURITY MARKET, BY INDUSTRY VERTICAL, 2021-2031 ($BILLION)
- TABLE 90. LAMEA ENDPOINT SECURITY MARKET, BY SOLUTION TYPE, 2021-2031 ($BILLION)
- TABLE 91. LAMEA ENDPOINT SECURITY MARKET, BY DEPLOYMENT MODE, 2021-2031 ($BILLION)
- TABLE 92. LAMEA ENDPOINT SECURITY MARKET, BY ENTERPRISE SIZE, 2021-2031 ($BILLION)
- TABLE 93. LAMEA ENDPOINT SECURITY MARKET, BY INDUSTRY VERTICAL, 2021-2031 ($BILLION)
- TABLE 94. LAMEA ENDPOINT SECURITY MARKET, BY COUNTRY, 2021-2031 ($BILLION)
- TABLE 95. LATIN AMERICA ENDPOINT SECURITY MARKET, BY SOLUTION TYPE, 2021-2031 ($BILLION)
- TABLE 96. LATIN AMERICA ENDPOINT SECURITY MARKET, BY DEPLOYMENT MODE, 2021-2031 ($BILLION)
- TABLE 97. LATIN AMERICA ENDPOINT SECURITY MARKET, BY ENTERPRISE SIZE, 2021-2031 ($BILLION)
- TABLE 98. LATIN AMERICA ENDPOINT SECURITY MARKET, BY INDUSTRY VERTICAL, 2021-2031 ($BILLION)
- TABLE 99. MIDDLE EAST ENDPOINT SECURITY MARKET, BY SOLUTION TYPE, 2021-2031 ($BILLION)
- TABLE 100. MIDDLE EAST ENDPOINT SECURITY MARKET, BY DEPLOYMENT MODE, 2021-2031 ($BILLION)
- TABLE 101. MIDDLE EAST ENDPOINT SECURITY MARKET, BY ENTERPRISE SIZE, 2021-2031 ($BILLION)
- TABLE 102. MIDDLE EAST ENDPOINT SECURITY MARKET, BY INDUSTRY VERTICAL, 2021-2031 ($BILLION)
- TABLE 103. AFRICA ENDPOINT SECURITY MARKET, BY SOLUTION TYPE, 2021-2031 ($BILLION)
- TABLE 104. AFRICA ENDPOINT SECURITY MARKET, BY DEPLOYMENT MODE, 2021-2031 ($BILLION)
- TABLE 105. AFRICA ENDPOINT SECURITY MARKET, BY ENTERPRISE SIZE, 2021-2031 ($BILLION)
- TABLE 106. AFRICA ENDPOINT SECURITY MARKET, BY INDUSTRY VERTICAL, 2021-2031 ($BILLION)
- TABLE 107. MICROSOFT CORPORATION: KEY EXECUTIVES
- TABLE 108. MICROSOFT CORPORATION: COMPANY SNAPSHOT
- TABLE 109. MICROSOFT CORPORATION: SERVICE SEGMENTS
- TABLE 110. MICROSOFT CORPORATION: PRODUCT PORTFOLIO
- TABLE 111. MICROSOFT CORPORATION: KEY STRATERGIES
- TABLE 112. CROWDSTRIKE: KEY EXECUTIVES
- TABLE 113. CROWDSTRIKE: COMPANY SNAPSHOT
- TABLE 114. CROWDSTRIKE: SERVICE SEGMENTS
- TABLE 115. CROWDSTRIKE: PRODUCT PORTFOLIO
- TABLE 116. CROWDSTRIKE: KEY STRATERGIES
- TABLE 117. CHECK POINT SOFTWARE TECHNOLOGIES LTD.: KEY EXECUTIVES
- TABLE 118. CHECK POINT SOFTWARE TECHNOLOGIES LTD.: COMPANY SNAPSHOT
- TABLE 119. CHECK POINT SOFTWARE TECHNOLOGIES LTD.: SERVICE SEGMENTS
- TABLE 120. CHECK POINT SOFTWARE TECHNOLOGIES LTD.: PRODUCT PORTFOLIO
- TABLE 121. CHECK POINT SOFTWARE TECHNOLOGIES LTD.: KEY STRATERGIES
- TABLE 122. CISCO SYSTEMS INC.: KEY EXECUTIVES
- TABLE 123. CISCO SYSTEMS INC.: COMPANY SNAPSHOT
- TABLE 124. CISCO SYSTEMS INC.: PRODUCT SEGMENTS
- TABLE 125. CISCO SYSTEMS INC.: PRODUCT PORTFOLIO
- TABLE 126. CISCO SYSTEMS INC.: KEY STRATERGIES
- TABLE 127. TREND MICRO INCORPORATED: KEY EXECUTIVES
- TABLE 128. TREND MICRO INCORPORATED: COMPANY SNAPSHOT
- TABLE 129. TREND MICRO INCORPORATED: PRODUCT SEGMENTS
- TABLE 130. TREND MICRO INCORPORATED: PRODUCT PORTFOLIO
- TABLE 131. TREND MICRO INCORPORATED: KEY STRATERGIES
- TABLE 132. BROADCOM: KEY EXECUTIVES
- TABLE 133. BROADCOM: COMPANY SNAPSHOT
- TABLE 134. BROADCOM: SERVICE SEGMENTS
- TABLE 135. BROADCOM: PRODUCT PORTFOLIO
- TABLE 136. BROADCOM: KEY STRATERGIES
- TABLE 137. AO KASPERSKY LAB: KEY EXECUTIVES
- TABLE 138. AO KASPERSKY LAB: COMPANY SNAPSHOT
- TABLE 139. AO KASPERSKY LAB: PRODUCT SEGMENTS
- TABLE 140. AO KASPERSKY LAB: PRODUCT PORTFOLIO
- TABLE 141. AO KASPERSKY LAB: KEY STRATERGIES
- TABLE 142. COMODO SECURITY SOLUTIONS, INC.: KEY EXECUTIVES
- TABLE 143. COMODO SECURITY SOLUTIONS, INC.: COMPANY SNAPSHOT
- TABLE 144. COMODO SECURITY SOLUTIONS, INC.: SERVICE SEGMENTS
- TABLE 145. COMODO SECURITY SOLUTIONS, INC.: PRODUCT PORTFOLIO
- TABLE 146. COMODO SECURITY SOLUTIONS, INC.: KEY STRATERGIES
- TABLE 147. MCAFEE, LLC: KEY EXECUTIVES
- TABLE 148. MCAFEE, LLC: COMPANY SNAPSHOT
- TABLE 149. MCAFEE, LLC: PRODUCT SEGMENTS
- TABLE 150. MCAFEE, LLC: PRODUCT PORTFOLIO
- TABLE 151. MCAFEE, LLC: KEY STRATERGIES
- TABLE 152. SENTINELONE: KEY EXECUTIVES
- TABLE 153. SENTINELONE: COMPANY SNAPSHOT
- TABLE 154. SENTINELONE: PRODUCT SEGMENTS
- TABLE 155. SENTINELONE: PRODUCT PORTFOLIO
- TABLE 156. SENTINELONE: KEY STRATERGIES
LIST OF FIGURES
- FIGURE 01. ENDPOINT SECURITY MARKET, 2021-2031
- FIGURE 02. SEGMENTATION OF ENDPOINT SECURITY MARKET, 2021-2031
- FIGURE 03. TOP INVESTMENT POCKETS IN ENDPOINT SECURITY MARKET (2022-2031)
- FIGURE 04. LOW BARGAINING POWER OF SUPPLIERS
- FIGURE 05. LOW BARGAINING POWER OF BUYERS
- FIGURE 06. LOW THREAT OF SUBSTITUTES
- FIGURE 07. LOW THREAT OF NEW ENTRANTS
- FIGURE 08. LOW INTENSITY OF RIVALRY
- FIGURE 09. DRIVERS, RESTRAINTS AND OPPORTUNITIES: GLOBALENDPOINT SECURITY MARKET
- FIGURE 10. ENDPOINT SECURITY MARKET, BY SOLUTION TYPE, 2021(%)
- FIGURE 11. COMPARATIVE SHARE ANALYSIS OF ENDPOINT SECURITY MARKET FOR ENDPOINT PROTECTION PLATFORM, BY COUNTRY 2021 AND 2031(%)
- FIGURE 12. COMPARATIVE SHARE ANALYSIS OF ENDPOINT SECURITY MARKET FOR ENDPOINT DETECTION AND RESPONSE, BY COUNTRY 2021 AND 2031(%)
- FIGURE 13. ENDPOINT SECURITY MARKET, BY DEPLOYMENT MODE, 2021(%)
- FIGURE 14. COMPARATIVE SHARE ANALYSIS OF ENDPOINT SECURITY MARKET FOR ON-PREMISE, BY COUNTRY 2021 AND 2031(%)
- FIGURE 15. COMPARATIVE SHARE ANALYSIS OF ENDPOINT SECURITY MARKET FOR CLOUD, BY COUNTRY 2021 AND 2031(%)
- FIGURE 16. ENDPOINT SECURITY MARKET, BY ENTERPRISE SIZE, 2021(%)
- FIGURE 17. COMPARATIVE SHARE ANALYSIS OF ENDPOINT SECURITY MARKET FOR LARGE ENTERPRISES, BY COUNTRY 2021 AND 2031(%)
- FIGURE 18. COMPARATIVE SHARE ANALYSIS OF ENDPOINT SECURITY MARKET FOR SMALL AND MEDIUM-SIZED ENTERPRISES (SMES), BY COUNTRY 2021 AND 2031(%)
- FIGURE 19. ENDPOINT SECURITY MARKET, BY INDUSTRY VERTICAL, 2021(%)
- FIGURE 20. COMPARATIVE SHARE ANALYSIS OF ENDPOINT SECURITY MARKET FOR IT AND TELECOM, BY COUNTRY 2021 AND 2031(%)
- FIGURE 21. COMPARATIVE SHARE ANALYSIS OF ENDPOINT SECURITY MARKET FOR HEALTHCARE, BY COUNTRY 2021 AND 2031(%)
- FIGURE 22. COMPARATIVE SHARE ANALYSIS OF ENDPOINT SECURITY MARKET FOR MANUFACTURING, BY COUNTRY 2021 AND 2031(%)
- FIGURE 23. COMPARATIVE SHARE ANALYSIS OF ENDPOINT SECURITY MARKET FOR BFSI, BY COUNTRY 2021 AND 2031(%)
- FIGURE 24. COMPARATIVE SHARE ANALYSIS OF ENDPOINT SECURITY MARKET FOR RETAIL AND E-COMMERCE, BY COUNTRY 2021 AND 2031(%)
- FIGURE 25. COMPARATIVE SHARE ANALYSIS OF ENDPOINT SECURITY MARKET FOR GOVERNMENT AND DEFENSE, BY COUNTRY 2021 AND 2031(%)
- FIGURE 26. COMPARATIVE SHARE ANALYSIS OF ENDPOINT SECURITY MARKET FOR OTHER, BY COUNTRY 2021 AND 2031(%)
- FIGURE 27. ENDPOINT SECURITY MARKET BY REGION, 2021
- FIGURE 28. U.S. ENDPOINT SECURITY MARKET, 2021-2031 ($BILLION)
- FIGURE 29. CANADA ENDPOINT SECURITY MARKET, 2021-2031 ($BILLION)
- FIGURE 30. UK ENDPOINT SECURITY MARKET, 2021-2031 ($BILLION)
- FIGURE 31. GERMANY ENDPOINT SECURITY MARKET, 2021-2031 ($BILLION)
- FIGURE 32. FRANCE ENDPOINT SECURITY MARKET, 2021-2031 ($BILLION)
- FIGURE 33. ITALY ENDPOINT SECURITY MARKET, 2021-2031 ($BILLION)
- FIGURE 34. SPAIN ENDPOINT SECURITY MARKET, 2021-2031 ($BILLION)
- FIGURE 35. REST OF EUROPE ENDPOINT SECURITY MARKET, 2021-2031 ($BILLION)
- FIGURE 36. CHINA ENDPOINT SECURITY MARKET, 2021-2031 ($BILLION)
- FIGURE 37. INDIA ENDPOINT SECURITY MARKET, 2021-2031 ($BILLION)
- FIGURE 38. JAPAN ENDPOINT SECURITY MARKET, 2021-2031 ($BILLION)
- FIGURE 39. AUSTRALIA ENDPOINT SECURITY MARKET, 2021-2031 ($BILLION)
- FIGURE 40. SOUTH KOREA ENDPOINT SECURITY MARKET, 2021-2031 ($BILLION)
- FIGURE 41. REST OF ASIA-PACIFIC ENDPOINT SECURITY MARKET, 2021-2031 ($BILLION)
- FIGURE 42. LATIN AMERICA ENDPOINT SECURITY MARKET, 2021-2031 ($BILLION)
- FIGURE 43. MIDDLE EAST ENDPOINT SECURITY MARKET, 2021-2031 ($BILLION)
- FIGURE 44. AFRICA ENDPOINT SECURITY MARKET, 2021-2031 ($BILLION)
- FIGURE 45. TOP WINNING STRATEGIES, BY YEAR
- FIGURE 46. TOP WINNING STRATEGIES, BY DEVELOPMENT
- FIGURE 47. TOP WINNING STRATEGIES, BY COMPANY
- FIGURE 48. PRODUCT MAPPING OF TOP 10 PLAYERS
- FIGURE 49. COMPETITIVE DASHBOARD
- FIGURE 50. COMPETITIVE HEATMAP: ENDPOINT SECURITY MARKET
- FIGURE 51. TOP PLAYER POSITIONING, 2021
- FIGURE 52. MICROSOFT CORPORATION: NET REVENUE, 2020-2022 ($BILLION)
- FIGURE 53. MICROSOFT CORPORATION: RESEARCH & DEVELOPMENT EXPENDITURE, 2020-2022 ($BILLION)
- FIGURE 54. MICROSOFT CORPORATION: REVENUE SHARE BY SEGMENT, 2022 (%)
- FIGURE 55. MICROSOFT CORPORATION: REVENUE SHARE BY REGION, 2022 (%)
- FIGURE 56. CROWDSTRIKE: NET REVENUE, 2019-2021 ($MILLION)
- FIGURE 57. CROWDSTRIKE: RESEARCH & DEVELOPMENT EXPENDITURE, 2019-2021 ($MILLION)
- FIGURE 58. CROWDSTRIKE: REVENUE SHARE BY SEGMENT, 2021 (%)
- FIGURE 59. CROWDSTRIKE: REVENUE SHARE BY REGION, 2021 (%)
- FIGURE 60. CHECK POINT SOFTWARE TECHNOLOGIES LTD.: NET REVENUE, 2020-2022 ($MILLION)
- FIGURE 61. CISCO SYSTEMS INC.: RESEARCH & DEVELOPMENT EXPENDITURE, 2020-2022 ($MILLION)
- FIGURE 62. CISCO SYSTEMS INC.: NET SALES, 2020-2022 ($MILLION)
- FIGURE 63. CISCO SYSTEMS INC.: REVENUE SHARE BY SEGMENT, 2022 (%)
- FIGURE 64. CISCO SYSTEMS INC.: REVENUE SHARE BY REGION, 2022 (%)
- FIGURE 65. TREND MICRO INCORPORATED: NET SALES, 2019-2021 ($MILLION)
- FIGURE 66. TREND MICRO INCORPORATED: REVENUE SHARE BY REGION, 2021 (%)
- FIGURE 67. BROADCOM: NET REVENUE, 2019-2021 ($MILLION)
- FIGURE 68. BROADCOM: REVENUE SHARE BY SEGMENT, 2021 (%)
- FIGURE 69. BROADCOM: REVENUE SHARE BY REGION, 2021 (%)
- FIGURE 70. SENTINELONE: RESEARCH & DEVELOPMENT EXPENDITURE, 2019-2021
- FIGURE 71. SENTINELONE: NET SALES, 2019-2021 ($MILLION)
- FIGURE 72. SENTINELONE: REVENUE SHARE BY SEGMENT, 2021 (%)
- FIGURE 73. SENTINELONE: REVENUE SHARE BY REGION, 2021 (%)

