
PUBLISHER: Allied Market Research | PRODUCT CODE: 1298233

PUBLISHER: Allied Market Research | PRODUCT CODE: 1298233
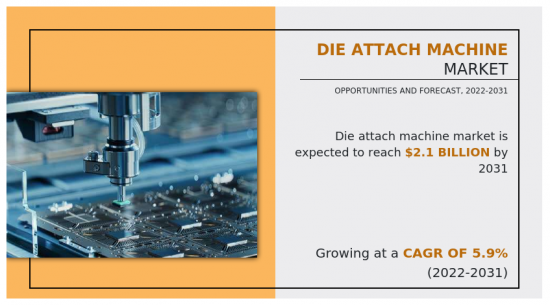
Die Attach Machine Market By Type, By Technique, By Application : Global Opportunity Analysis and Industry Forecast, 2021-2031
The global die attach machine market was valued at $1,185.7 million in 2021 and is projected to reach $2,103.6 million by 2031, registering a CAGR of 5.9% from 2022 to 2031. Die attach machine is used for the attachment of semiconductor device die and its package. Additionally, it is a backend process of chip manufacturing and also a key component of the semiconductor supply chain.
Rise in demand for electronic products such as robotics, automotive electronics, tablets, smartphones, electrical household appliances, automation systems, electronic medical equipment, and others are driving the growth of die attach machine market. Moreover, the increase in government support for semiconductor industry is a major driver of the die attach machine market growth. However, the fluctuation in raw material prices hinders die attach machine market growth.
Furthermore, due to COVID-19, a global semiconductor shortage was witnessed during 2020 and 2021; thus, the die attach machine market witnessed a halt, which led to a small term decline in the market. Contrarily, the semiconductor shortage made countries realize that dependence on other countries for semiconductors is detrimental for their growth. Thus, various countries are investing to strengthen their domestic semiconductor industry. However, as the number of COVID-19 cases has reduced to a significant level, the market is expected to fully recover by the end of 2023.
Furthermore, growth in usage of LED circuits offers lucrative growth opportunities for the market player during the forecast period.
The global die attach machine market is segmented on the basis of type, technique, application, and region. By type, the market is categorized into flip chip bonder and die bonder. Depending on technique, it is fragmented into epoxy, soft solder, sintering, eutectic, and others. Depending on application, it is fragmented into RF and MEMS, optoelectronics, logic, memory, CMOS image sensors, LED, and others. By region, it is analyzed across North America (U.S., Canada, and Mexico), Europe (Germany, France, Italy, UK, and rest of Europe), Asia-Pacific (China, India, Japan, South Korea, and rest of Asia-Pacific), and LAMEA (Latin America, Middle East, and Africa).
Competition Analysis
Key companies profiled in the die attach machine market report include: ASM Pacific Technology Limited, BE Semiconductor Industries N.V, Dr. Tresky AG, Fasford Technology Co. Limited, Inseto UK Limited, Kulicke And Soffa Industries, microassembly technologies limited, Palomar Technologies, Shinkawa Limited, Panasonic Industry Co., Ltd.
Key Benefits For Stakeholders
- The report provides an extensive analysis of the current and emerging die attach machine market trends and dynamics.
- In-depth market analysis is conducted by constructing market estimations for the key market segments between 2021 and 2031.
- Extensive analysis of the die attach machine market is conducted by following key product positioning and monitoring of the top competitors within the market framework.
- A comprehensive analysis of all regions is provided to determine the prevailing opportunities.
- The global die attach machine market forecast analysis from 2022 to 2031 is included in the report.
- The key market players within the die attach machine market are profiled in this report and their strategies are analyzed thoroughly, which help understand the competitive outlook of the die attach machine industry.
Key Market Segments
By Type
- Flip Chip Bonder
- Die Bonder
By Technique
- Epoxy
- Soft Solder
- Sintering
- Eutectic
- Others
By Application
- RF and MEMS
- Optoelectronics
- Logic
- Memory
- CMOS image sensors
- LED
- Others
By Region
- North America
- U.S.
- Canada
- Mexico
- Europe
- Germany
- France
- UK
- Italy
- Rest of Europe
- Asia-Pacific
- China
- India
- Japan
- South Korea
- Rest of Asia-Pacific
- LAMEA
- Latin America
- Middle East
- Africa
Key Market Players:
- Kulicke and Soffa Industries
- Palomar Technologies
- Shinkawa Limited
- MicroAssembly Technologies Limited
- Inseto UK Limited
- Dr. Tresky AG
- Panasonic Industry Co., Ltd.
- ASM Pacific Technology Limited
- Fasford Technology Co. Limited
- BE Semiconductor Industries N.V
TABLE OF CONTENTS
CHAPTER 1: INTRODUCTION
- 1.1. Report description
- 1.2. Key market segments
- 1.3. Key benefits to the stakeholders
- 1.4. Research Methodology
- 1.4.1. Primary research
- 1.4.2. Secondary research
- 1.4.3. Analyst tools and models
CHAPTER 2: EXECUTIVE SUMMARY
- 2.1. CXO Perspective
CHAPTER 3: MARKET OVERVIEW
- 3.1. Market definition and scope
- 3.2. Key findings
- 3.2.1. Top impacting factors
- 3.2.2. Top investment pockets
- 3.3. Porter's five forces analysis
- 3.3.1. Bargaining power of suppliers
- 3.3.2. Bargaining power of buyers
- 3.3.3. Threat of substitutes
- 3.3.4. Threat of new entrants
- 3.3.5. Intensity of rivalry
- 3.4. Market dynamics
- 3.4.1. Drivers
- 3.4.1.1. Growth in semiconductor manufacturing across the world
- 3.4.1.2. Rise in demand for electronics products
- 3.4.1.3. Growth in demand for hybrid circuits from medical, military, photonics, and wireless electronics applications
- 3.4.1. Drivers
- 3.4.2. Restraints
- 3.4.2.1. Fluctuation in raw material prices
- 3.4.3. Opportunities
- 3.4.3.1. Increase in government support for semiconductor industry
- 3.4.3.2. Growth in usage of LED circuits
- 3.5. COVID-19 Impact Analysis on the market
CHAPTER 4: DIE ATTACH MACHINE MARKET, BY TYPE
- 4.1. Overview
- 4.1.1. Market size and forecast
- 4.2. Flip Chip Bonder
- 4.2.1. Key market trends, growth factors and opportunities
- 4.2.2. Market size and forecast, by region
- 4.2.3. Market share analysis by country
- 4.3. Die Bonder
- 4.3.1. Key market trends, growth factors and opportunities
- 4.3.2. Market size and forecast, by region
- 4.3.3. Market share analysis by country
CHAPTER 5: DIE ATTACH MACHINE MARKET, BY TECHNIQUE
- 5.1. Overview
- 5.1.1. Market size and forecast
- 5.2. Epoxy
- 5.2.1. Key market trends, growth factors and opportunities
- 5.2.2. Market size and forecast, by region
- 5.2.3. Market share analysis by country
- 5.3. Soft Solder
- 5.3.1. Key market trends, growth factors and opportunities
- 5.3.2. Market size and forecast, by region
- 5.3.3. Market share analysis by country
- 5.4. Sintering
- 5.4.1. Key market trends, growth factors and opportunities
- 5.4.2. Market size and forecast, by region
- 5.4.3. Market share analysis by country
- 5.5. Eutectic
- 5.5.1. Key market trends, growth factors and opportunities
- 5.5.2. Market size and forecast, by region
- 5.5.3. Market share analysis by country
- 5.6. Others
- 5.6.1. Key market trends, growth factors and opportunities
- 5.6.2. Market size and forecast, by region
- 5.6.3. Market share analysis by country
CHAPTER 6: DIE ATTACH MACHINE MARKET, BY APPLICATION
- 6.1. Overview
- 6.1.1. Market size and forecast
- 6.2. RF and MEMS
- 6.2.1. Key market trends, growth factors and opportunities
- 6.2.2. Market size and forecast, by region
- 6.2.3. Market share analysis by country
- 6.3. Optoelectronics
- 6.3.1. Key market trends, growth factors and opportunities
- 6.3.2. Market size and forecast, by region
- 6.3.3. Market share analysis by country
- 6.4. Logic
- 6.4.1. Key market trends, growth factors and opportunities
- 6.4.2. Market size and forecast, by region
- 6.4.3. Market share analysis by country
- 6.5. Memory
- 6.5.1. Key market trends, growth factors and opportunities
- 6.5.2. Market size and forecast, by region
- 6.5.3. Market share analysis by country
- 6.6. CMOS image sensors
- 6.6.1. Key market trends, growth factors and opportunities
- 6.6.2. Market size and forecast, by region
- 6.6.3. Market share analysis by country
- 6.7. LED
- 6.7.1. Key market trends, growth factors and opportunities
- 6.7.2. Market size and forecast, by region
- 6.7.3. Market share analysis by country
- 6.8. Others
- 6.8.1. Key market trends, growth factors and opportunities
- 6.8.2. Market size and forecast, by region
- 6.8.3. Market share analysis by country
CHAPTER 7: DIE ATTACH MACHINE MARKET, BY REGION
- 7.1. Overview
- 7.1.1. Market size and forecast By Region
- 7.2. North America
- 7.2.1. Key trends and opportunities
- 7.2.2. Market size and forecast, by Type
- 7.2.3. Market size and forecast, by Technique
- 7.2.4. Market size and forecast, by Application
- 7.2.5. Market size and forecast, by country
- 7.2.5.1. U.S.
- 7.2.5.1.1. Key market trends, growth factors and opportunities
- 7.2.5.1.2. Market size and forecast, by Type
- 7.2.5.1.3. Market size and forecast, by Technique
- 7.2.5.1.4. Market size and forecast, by Application
- 7.2.5.2. Canada
- 7.2.5.2.1. Key market trends, growth factors and opportunities
- 7.2.5.2.2. Market size and forecast, by Type
- 7.2.5.2.3. Market size and forecast, by Technique
- 7.2.5.2.4. Market size and forecast, by Application
- 7.2.5.3. Mexico
- 7.2.5.3.1. Key market trends, growth factors and opportunities
- 7.2.5.3.2. Market size and forecast, by Type
- 7.2.5.3.3. Market size and forecast, by Technique
- 7.2.5.3.4. Market size and forecast, by Application
- 7.3. Europe
- 7.3.1. Key trends and opportunities
- 7.3.2. Market size and forecast, by Type
- 7.3.3. Market size and forecast, by Technique
- 7.3.4. Market size and forecast, by Application
- 7.3.5. Market size and forecast, by country
- 7.3.5.1. Germany
- 7.3.5.1.1. Key market trends, growth factors and opportunities
- 7.3.5.1.2. Market size and forecast, by Type
- 7.3.5.1.3. Market size and forecast, by Technique
- 7.3.5.1.4. Market size and forecast, by Application
- 7.3.5.2. France
- 7.3.5.2.1. Key market trends, growth factors and opportunities
- 7.3.5.2.2. Market size and forecast, by Type
- 7.3.5.2.3. Market size and forecast, by Technique
- 7.3.5.2.4. Market size and forecast, by Application
- 7.3.5.3. UK
- 7.3.5.3.1. Key market trends, growth factors and opportunities
- 7.3.5.3.2. Market size and forecast, by Type
- 7.3.5.3.3. Market size and forecast, by Technique
- 7.3.5.3.4. Market size and forecast, by Application
- 7.3.5.4. Italy
- 7.3.5.4.1. Key market trends, growth factors and opportunities
- 7.3.5.4.2. Market size and forecast, by Type
- 7.3.5.4.3. Market size and forecast, by Technique
- 7.3.5.4.4. Market size and forecast, by Application
- 7.3.5.5. Rest of Europe
- 7.3.5.5.1. Key market trends, growth factors and opportunities
- 7.3.5.5.2. Market size and forecast, by Type
- 7.3.5.5.3. Market size and forecast, by Technique
- 7.3.5.5.4. Market size and forecast, by Application
- 7.4. Asia-Pacific
- 7.4.1. Key trends and opportunities
- 7.4.2. Market size and forecast, by Type
- 7.4.3. Market size and forecast, by Technique
- 7.4.4. Market size and forecast, by Application
- 7.4.5. Market size and forecast, by country
- 7.4.5.1. China
- 7.4.5.1.1. Key market trends, growth factors and opportunities
- 7.4.5.1.2. Market size and forecast, by Type
- 7.4.5.1.3. Market size and forecast, by Technique
- 7.4.5.1.4. Market size and forecast, by Application
- 7.4.5.2. India
- 7.4.5.2.1. Key market trends, growth factors and opportunities
- 7.4.5.2.2. Market size and forecast, by Type
- 7.4.5.2.3. Market size and forecast, by Technique
- 7.4.5.2.4. Market size and forecast, by Application
- 7.4.5.3. Japan
- 7.4.5.3.1. Key market trends, growth factors and opportunities
- 7.4.5.3.2. Market size and forecast, by Type
- 7.4.5.3.3. Market size and forecast, by Technique
- 7.4.5.3.4. Market size and forecast, by Application
- 7.4.5.4. South Korea
- 7.4.5.4.1. Key market trends, growth factors and opportunities
- 7.4.5.4.2. Market size and forecast, by Type
- 7.4.5.4.3. Market size and forecast, by Technique
- 7.4.5.4.4. Market size and forecast, by Application
- 7.4.5.5. Rest of Asia-Pacific
- 7.4.5.5.1. Key market trends, growth factors and opportunities
- 7.4.5.5.2. Market size and forecast, by Type
- 7.4.5.5.3. Market size and forecast, by Technique
- 7.4.5.5.4. Market size and forecast, by Application
- 7.5. LAMEA
- 7.5.1. Key trends and opportunities
- 7.5.2. Market size and forecast, by Type
- 7.5.3. Market size and forecast, by Technique
- 7.5.4. Market size and forecast, by Application
- 7.5.5. Market size and forecast, by country
- 7.5.5.1. Latin America
- 7.5.5.1.1. Key market trends, growth factors and opportunities
- 7.5.5.1.2. Market size and forecast, by Type
- 7.5.5.1.3. Market size and forecast, by Technique
- 7.5.5.1.4. Market size and forecast, by Application
- 7.5.5.2. Middle East
- 7.5.5.2.1. Key market trends, growth factors and opportunities
- 7.5.5.2.2. Market size and forecast, by Type
- 7.5.5.2.3. Market size and forecast, by Technique
- 7.5.5.2.4. Market size and forecast, by Application
- 7.5.5.3. Africa
- 7.5.5.3.1. Key market trends, growth factors and opportunities
- 7.5.5.3.2. Market size and forecast, by Type
- 7.5.5.3.3. Market size and forecast, by Technique
- 7.5.5.3.4. Market size and forecast, by Application
CHAPTER 8: COMPETITIVE LANDSCAPE
- 8.1. Introduction
- 8.2. Top winning strategies
- 8.3. Product Mapping of Top 10 Player
- 8.4. Competitive Dashboard
- 8.5. Competitive Heatmap
- 8.6. Top player positioning, 2021
CHAPTER 9: COMPANY PROFILES
- 9.1. ASM Pacific Technology Limited
- 9.1.1. Company overview
- 9.1.2. Key Executives
- 9.1.3. Company snapshot
- 9.1.4. Operating business segments
- 9.1.5. Product portfolio
- 9.1.6. Business performance
- 9.2. BE Semiconductor Industries N.V
- 9.2.1. Company overview
- 9.2.2. Key Executives
- 9.2.3. Company snapshot
- 9.2.4. Operating business segments
- 9.2.5. Product portfolio
- 9.2.6. Business performance
- 9.3. Dr. Tresky AG
- 9.3.1. Company overview
- 9.3.2. Key Executives
- 9.3.3. Company snapshot
- 9.3.4. Operating business segments
- 9.3.5. Product portfolio
- 9.4. Fasford Technology Co. Limited
- 9.4.1. Company overview
- 9.4.2. Key Executives
- 9.4.3. Company snapshot
- 9.4.4. Operating business segments
- 9.4.5. Product portfolio
- 9.5. Inseto UK Limited
- 9.5.1. Company overview
- 9.5.2. Key Executives
- 9.5.3. Company snapshot
- 9.5.4. Operating business segments
- 9.5.5. Product portfolio
- 9.6. Kulicke and Soffa Industries
- 9.6.1. Company overview
- 9.6.2. Key Executives
- 9.6.3. Company snapshot
- 9.6.4. Operating business segments
- 9.6.5. Product portfolio
- 9.6.6. Business performance
- 9.7. MicroAssembly Technologies Limited
- 9.7.1. Company overview
- 9.7.2. Key Executives
- 9.7.3. Company snapshot
- 9.7.4. Operating business segments
- 9.7.5. Product portfolio
- 9.8. Palomar Technologies
- 9.8.1. Company overview
- 9.8.2. Key Executives
- 9.8.3. Company snapshot
- 9.8.4. Operating business segments
- 9.8.5. Product portfolio
- 9.8.6. Key strategic moves and developments
- 9.9. Shinkawa Limited
- 9.9.1. Company overview
- 9.9.2. Key Executives
- 9.9.3. Company snapshot
- 9.9.4. Operating business segments
- 9.9.5. Product portfolio
- 9.10. Panasonic Industry Co., Ltd.
- 9.10.1. Company overview
- 9.10.2. Key Executives
- 9.10.3. Company snapshot
- 9.10.4. Operating business segments
- 9.10.5. Product portfolio
- 9.10.6. Business performance
LIST OF TABLES
- TABLE 01. GLOBAL DIE ATTACH MACHINE MARKET, BY TYPE, 2021-2031 ($MILLION)
- TABLE 02. DIE ATTACH MACHINE MARKET FOR FLIP CHIP BONDER, BY REGION, 2021-2031 ($MILLION)
- TABLE 03. DIE ATTACH MACHINE MARKET FOR DIE BONDER, BY REGION, 2021-2031 ($MILLION)
- TABLE 04. GLOBAL DIE ATTACH MACHINE MARKET, BY TECHNIQUE, 2021-2031 ($MILLION)
- TABLE 05. DIE ATTACH MACHINE MARKET FOR EPOXY, BY REGION, 2021-2031 ($MILLION)
- TABLE 06. DIE ATTACH MACHINE MARKET FOR SOFT SOLDER, BY REGION, 2021-2031 ($MILLION)
- TABLE 07. DIE ATTACH MACHINE MARKET FOR SINTERING, BY REGION, 2021-2031 ($MILLION)
- TABLE 08. DIE ATTACH MACHINE MARKET FOR EUTECTIC, BY REGION, 2021-2031 ($MILLION)
- TABLE 09. DIE ATTACH MACHINE MARKET FOR OTHERS, BY REGION, 2021-2031 ($MILLION)
- TABLE 10. GLOBAL DIE ATTACH MACHINE MARKET, BY APPLICATION, 2021-2031 ($MILLION)
- TABLE 11. DIE ATTACH MACHINE MARKET FOR RF AND MEMS, BY REGION, 2021-2031 ($MILLION)
- TABLE 12. DIE ATTACH MACHINE MARKET FOR OPTOELECTRONICS, BY REGION, 2021-2031 ($MILLION)
- TABLE 13. DIE ATTACH MACHINE MARKET FOR LOGIC, BY REGION, 2021-2031 ($MILLION)
- TABLE 14. DIE ATTACH MACHINE MARKET FOR MEMORY, BY REGION, 2021-2031 ($MILLION)
- TABLE 15. DIE ATTACH MACHINE MARKET FOR CMOS IMAGE SENSORS, BY REGION, 2021-2031 ($MILLION)
- TABLE 16. DIE ATTACH MACHINE MARKET FOR LED, BY REGION, 2021-2031 ($MILLION)
- TABLE 17. DIE ATTACH MACHINE MARKET FOR OTHERS, BY REGION, 2021-2031 ($MILLION)
- TABLE 18. DIE ATTACH MACHINE MARKET, BY REGION, 2021-2031 ($MILLION)
- TABLE 19. NORTH AMERICA DIE ATTACH MACHINE MARKET, BY TYPE, 2021-2031 ($MILLION)
- TABLE 20. NORTH AMERICA DIE ATTACH MACHINE MARKET, BY TECHNIQUE, 2021-2031 ($MILLION)
- TABLE 21. NORTH AMERICA DIE ATTACH MACHINE MARKET, BY APPLICATION, 2021-2031 ($MILLION)
- TABLE 22. NORTH AMERICA DIE ATTACH MACHINE MARKET, BY COUNTRY, 2021-2031 ($MILLION)
- TABLE 23. U.S. DIE ATTACH MACHINE MARKET, BY TYPE, 2021-2031 ($MILLION)
- TABLE 24. U.S. DIE ATTACH MACHINE MARKET, BY TECHNIQUE, 2021-2031 ($MILLION)
- TABLE 25. U.S. DIE ATTACH MACHINE MARKET, BY APPLICATION, 2021-2031 ($MILLION)
- TABLE 26. CANADA DIE ATTACH MACHINE MARKET, BY TYPE, 2021-2031 ($MILLION)
- TABLE 27. CANADA DIE ATTACH MACHINE MARKET, BY TECHNIQUE, 2021-2031 ($MILLION)
- TABLE 28. CANADA DIE ATTACH MACHINE MARKET, BY APPLICATION, 2021-2031 ($MILLION)
- TABLE 29. MEXICO DIE ATTACH MACHINE MARKET, BY TYPE, 2021-2031 ($MILLION)
- TABLE 30. MEXICO DIE ATTACH MACHINE MARKET, BY TECHNIQUE, 2021-2031 ($MILLION)
- TABLE 31. MEXICO DIE ATTACH MACHINE MARKET, BY APPLICATION, 2021-2031 ($MILLION)
- TABLE 32. EUROPE DIE ATTACH MACHINE MARKET, BY TYPE, 2021-2031 ($MILLION)
- TABLE 33. EUROPE DIE ATTACH MACHINE MARKET, BY TECHNIQUE, 2021-2031 ($MILLION)
- TABLE 34. EUROPE DIE ATTACH MACHINE MARKET, BY APPLICATION, 2021-2031 ($MILLION)
- TABLE 35. EUROPE DIE ATTACH MACHINE MARKET, BY COUNTRY, 2021-2031 ($MILLION)
- TABLE 36. GERMANY DIE ATTACH MACHINE MARKET, BY TYPE, 2021-2031 ($MILLION)
- TABLE 37. GERMANY DIE ATTACH MACHINE MARKET, BY TECHNIQUE, 2021-2031 ($MILLION)
- TABLE 38. GERMANY DIE ATTACH MACHINE MARKET, BY APPLICATION, 2021-2031 ($MILLION)
- TABLE 39. FRANCE DIE ATTACH MACHINE MARKET, BY TYPE, 2021-2031 ($MILLION)
- TABLE 40. FRANCE DIE ATTACH MACHINE MARKET, BY TECHNIQUE, 2021-2031 ($MILLION)
- TABLE 41. FRANCE DIE ATTACH MACHINE MARKET, BY APPLICATION, 2021-2031 ($MILLION)
- TABLE 42. UK DIE ATTACH MACHINE MARKET, BY TYPE, 2021-2031 ($MILLION)
- TABLE 43. UK DIE ATTACH MACHINE MARKET, BY TECHNIQUE, 2021-2031 ($MILLION)
- TABLE 44. UK DIE ATTACH MACHINE MARKET, BY APPLICATION, 2021-2031 ($MILLION)
- TABLE 45. ITALY DIE ATTACH MACHINE MARKET, BY TYPE, 2021-2031 ($MILLION)
- TABLE 46. ITALY DIE ATTACH MACHINE MARKET, BY TECHNIQUE, 2021-2031 ($MILLION)
- TABLE 47. ITALY DIE ATTACH MACHINE MARKET, BY APPLICATION, 2021-2031 ($MILLION)
- TABLE 48. REST OF EUROPE DIE ATTACH MACHINE MARKET, BY TYPE, 2021-2031 ($MILLION)
- TABLE 49. REST OF EUROPE DIE ATTACH MACHINE MARKET, BY TECHNIQUE, 2021-2031 ($MILLION)
- TABLE 50. REST OF EUROPE DIE ATTACH MACHINE MARKET, BY APPLICATION, 2021-2031 ($MILLION)
- TABLE 51. ASIA-PACIFIC DIE ATTACH MACHINE MARKET, BY TYPE, 2021-2031 ($MILLION)
- TABLE 52. ASIA-PACIFIC DIE ATTACH MACHINE MARKET, BY TECHNIQUE, 2021-2031 ($MILLION)
- TABLE 53. ASIA-PACIFIC DIE ATTACH MACHINE MARKET, BY APPLICATION, 2021-2031 ($MILLION)
- TABLE 54. ASIA-PACIFIC DIE ATTACH MACHINE MARKET, BY COUNTRY, 2021-2031 ($MILLION)
- TABLE 55. CHINA DIE ATTACH MACHINE MARKET, BY TYPE, 2021-2031 ($MILLION)
- TABLE 56. CHINA DIE ATTACH MACHINE MARKET, BY TECHNIQUE, 2021-2031 ($MILLION)
- TABLE 57. CHINA DIE ATTACH MACHINE MARKET, BY APPLICATION, 2021-2031 ($MILLION)
- TABLE 58. INDIA DIE ATTACH MACHINE MARKET, BY TYPE, 2021-2031 ($MILLION)
- TABLE 59. INDIA DIE ATTACH MACHINE MARKET, BY TECHNIQUE, 2021-2031 ($MILLION)
- TABLE 60. INDIA DIE ATTACH MACHINE MARKET, BY APPLICATION, 2021-2031 ($MILLION)
- TABLE 61. JAPAN DIE ATTACH MACHINE MARKET, BY TYPE, 2021-2031 ($MILLION)
- TABLE 62. JAPAN DIE ATTACH MACHINE MARKET, BY TECHNIQUE, 2021-2031 ($MILLION)
- TABLE 63. JAPAN DIE ATTACH MACHINE MARKET, BY APPLICATION, 2021-2031 ($MILLION)
- TABLE 64. SOUTH KOREA DIE ATTACH MACHINE MARKET, BY TYPE, 2021-2031 ($MILLION)
- TABLE 65. SOUTH KOREA DIE ATTACH MACHINE MARKET, BY TECHNIQUE, 2021-2031 ($MILLION)
- TABLE 66. SOUTH KOREA DIE ATTACH MACHINE MARKET, BY APPLICATION, 2021-2031 ($MILLION)
- TABLE 67. REST OF ASIA-PACIFIC DIE ATTACH MACHINE MARKET, BY TYPE, 2021-2031 ($MILLION)
- TABLE 68. REST OF ASIA-PACIFIC DIE ATTACH MACHINE MARKET, BY TECHNIQUE, 2021-2031 ($MILLION)
- TABLE 69. REST OF ASIA-PACIFIC DIE ATTACH MACHINE MARKET, BY APPLICATION, 2021-2031 ($MILLION)
- TABLE 70. LAMEA DIE ATTACH MACHINE MARKET, BY TYPE, 2021-2031 ($MILLION)
- TABLE 71. LAMEA DIE ATTACH MACHINE MARKET, BY TECHNIQUE, 2021-2031 ($MILLION)
- TABLE 72. LAMEA DIE ATTACH MACHINE MARKET, BY APPLICATION, 2021-2031 ($MILLION)
- TABLE 73. LAMEA DIE ATTACH MACHINE MARKET, BY COUNTRY, 2021-2031 ($MILLION)
- TABLE 74. LATIN AMERICA DIE ATTACH MACHINE MARKET, BY TYPE, 2021-2031 ($MILLION)
- TABLE 75. LATIN AMERICA DIE ATTACH MACHINE MARKET, BY TECHNIQUE, 2021-2031 ($MILLION)
- TABLE 76. LATIN AMERICA DIE ATTACH MACHINE MARKET, BY APPLICATION, 2021-2031 ($MILLION)
- TABLE 77. MIDDLE EAST DIE ATTACH MACHINE MARKET, BY TYPE, 2021-2031 ($MILLION)
- TABLE 78. MIDDLE EAST DIE ATTACH MACHINE MARKET, BY TECHNIQUE, 2021-2031 ($MILLION)
- TABLE 79. MIDDLE EAST DIE ATTACH MACHINE MARKET, BY APPLICATION, 2021-2031 ($MILLION)
- TABLE 80. AFRICA DIE ATTACH MACHINE MARKET, BY TYPE, 2021-2031 ($MILLION)
- TABLE 81. AFRICA DIE ATTACH MACHINE MARKET, BY TECHNIQUE, 2021-2031 ($MILLION)
- TABLE 82. AFRICA DIE ATTACH MACHINE MARKET, BY APPLICATION, 2021-2031 ($MILLION)
- TABLE 83. ASM PACIFIC TECHNOLOGY LIMITED: KEY EXECUTIVES
- TABLE 84. ASM PACIFIC TECHNOLOGY LIMITED: COMPANY SNAPSHOT
- TABLE 85. ASM PACIFIC TECHNOLOGY LIMITED: PRODUCT SEGMENTS
- TABLE 86. ASM PACIFIC TECHNOLOGY LIMITED: PRODUCT PORTFOLIO
- TABLE 87. BE SEMICONDUCTOR INDUSTRIES N.V: KEY EXECUTIVES
- TABLE 88. BE SEMICONDUCTOR INDUSTRIES N.V: COMPANY SNAPSHOT
- TABLE 89. BE SEMICONDUCTOR INDUSTRIES N.V: PRODUCT SEGMENTS
- TABLE 90. BE SEMICONDUCTOR INDUSTRIES N.V: PRODUCT PORTFOLIO
- TABLE 91. DR. TRESKY AG: KEY EXECUTIVES
- TABLE 92. DR. TRESKY AG: COMPANY SNAPSHOT
- TABLE 93. DR. TRESKY AG: PRODUCT SEGMENTS
- TABLE 94. DR. TRESKY AG: PRODUCT PORTFOLIO
- TABLE 95. FASFORD TECHNOLOGY CO. LIMITED: KEY EXECUTIVES
- TABLE 96. FASFORD TECHNOLOGY CO. LIMITED: COMPANY SNAPSHOT
- TABLE 97. FASFORD TECHNOLOGY CO. LIMITED: PRODUCT SEGMENTS
- TABLE 98. FASFORD TECHNOLOGY CO. LIMITED: PRODUCT PORTFOLIO
- TABLE 99. INSETO UK LIMITED: KEY EXECUTIVES
- TABLE 100. INSETO UK LIMITED: COMPANY SNAPSHOT
- TABLE 101. INSETO UK LIMITED: PRODUCT SEGMENTS
- TABLE 102. INSETO UK LIMITED: PRODUCT PORTFOLIO
- TABLE 103. KULICKE AND SOFFA INDUSTRIES: KEY EXECUTIVES
- TABLE 104. KULICKE AND SOFFA INDUSTRIES: COMPANY SNAPSHOT
- TABLE 105. KULICKE AND SOFFA INDUSTRIES: PRODUCT SEGMENTS
- TABLE 106. KULICKE AND SOFFA INDUSTRIES: PRODUCT PORTFOLIO
- TABLE 107. MICROASSEMBLY TECHNOLOGIES LIMITED: KEY EXECUTIVES
- TABLE 108. MICROASSEMBLY TECHNOLOGIES LIMITED: COMPANY SNAPSHOT
- TABLE 109. MICROASSEMBLY TECHNOLOGIES LIMITED: PRODUCT SEGMENTS
- TABLE 110. MICROASSEMBLY TECHNOLOGIES LIMITED: PRODUCT PORTFOLIO
- TABLE 111. PALOMAR TECHNOLOGIES: KEY EXECUTIVES
- TABLE 112. PALOMAR TECHNOLOGIES: COMPANY SNAPSHOT
- TABLE 113. PALOMAR TECHNOLOGIES: PRODUCT SEGMENTS
- TABLE 114. PALOMAR TECHNOLOGIES: PRODUCT PORTFOLIO
- TABLE 115. PALOMAR TECHNOLOGIES: KEY STRATERGIES
- TABLE 116. SHINKAWA LIMITED: KEY EXECUTIVES
- TABLE 117. SHINKAWA LIMITED: COMPANY SNAPSHOT
- TABLE 118. SHINKAWA LIMITED: PRODUCT SEGMENTS
- TABLE 119. SHINKAWA LIMITED: PRODUCT PORTFOLIO
- TABLE 120. PANASONIC INDUSTRY CO., LTD.: KEY EXECUTIVES
- TABLE 121. PANASONIC INDUSTRY CO., LTD.: COMPANY SNAPSHOT
- TABLE 122. PANASONIC INDUSTRY CO., LTD.: PRODUCT SEGMENTS
- TABLE 123. PANASONIC INDUSTRY CO., LTD.: PRODUCT PORTFOLIO
LIST OF FIGURES
- FIGURE 01. DIE ATTACH MACHINE MARKET, 2021-2031
- FIGURE 02. SEGMENTATION OF DIE ATTACH MACHINE MARKET, 2021-2031
- FIGURE 03. TOP INVESTMENT POCKETS IN DIE ATTACH MACHINE MARKET (2022-2031)
- FIGURE 04. LOW BARGAINING POWER OF SUPPLIERS
- FIGURE 05. LOW BARGAINING POWER OF BUYERS
- FIGURE 06. LOW THREAT OF SUBSTITUTES
- FIGURE 07. LOW THREAT OF NEW ENTRANTS
- FIGURE 08. LOW INTENSITY OF RIVALRY
- FIGURE 09. DRIVERS, RESTRAINTS AND OPPORTUNITIES: GLOBALDIE ATTACH MACHINE MARKET
- FIGURE 10. DIE ATTACH MACHINE MARKET, BY TYPE, 2021(%)
- FIGURE 11. COMPARATIVE SHARE ANALYSIS OF DIE ATTACH MACHINE MARKET FOR FLIP CHIP BONDER, BY COUNTRY 2021 AND 2031(%)
- FIGURE 12. COMPARATIVE SHARE ANALYSIS OF DIE ATTACH MACHINE MARKET FOR DIE BONDER, BY COUNTRY 2021 AND 2031(%)
- FIGURE 13. DIE ATTACH MACHINE MARKET, BY TECHNIQUE, 2021(%)
- FIGURE 14. COMPARATIVE SHARE ANALYSIS OF DIE ATTACH MACHINE MARKET FOR EPOXY, BY COUNTRY 2021 AND 2031(%)
- FIGURE 15. COMPARATIVE SHARE ANALYSIS OF DIE ATTACH MACHINE MARKET FOR SOFT SOLDER, BY COUNTRY 2021 AND 2031(%)
- FIGURE 16. COMPARATIVE SHARE ANALYSIS OF DIE ATTACH MACHINE MARKET FOR SINTERING, BY COUNTRY 2021 AND 2031(%)
- FIGURE 17. COMPARATIVE SHARE ANALYSIS OF DIE ATTACH MACHINE MARKET FOR EUTECTIC, BY COUNTRY 2021 AND 2031(%)
- FIGURE 18. COMPARATIVE SHARE ANALYSIS OF DIE ATTACH MACHINE MARKET FOR OTHERS, BY COUNTRY 2021 AND 2031(%)
- FIGURE 19. DIE ATTACH MACHINE MARKET, BY APPLICATION, 2021(%)
- FIGURE 20. COMPARATIVE SHARE ANALYSIS OF DIE ATTACH MACHINE MARKET FOR RF AND MEMS, BY COUNTRY 2021 AND 2031(%)
- FIGURE 21. COMPARATIVE SHARE ANALYSIS OF DIE ATTACH MACHINE MARKET FOR OPTOELECTRONICS, BY COUNTRY 2021 AND 2031(%)
- FIGURE 22. COMPARATIVE SHARE ANALYSIS OF DIE ATTACH MACHINE MARKET FOR LOGIC, BY COUNTRY 2021 AND 2031(%)
- FIGURE 23. COMPARATIVE SHARE ANALYSIS OF DIE ATTACH MACHINE MARKET FOR MEMORY, BY COUNTRY 2021 AND 2031(%)
- FIGURE 24. COMPARATIVE SHARE ANALYSIS OF DIE ATTACH MACHINE MARKET FOR CMOS IMAGE SENSORS, BY COUNTRY 2021 AND 2031(%)
- FIGURE 25. COMPARATIVE SHARE ANALYSIS OF DIE ATTACH MACHINE MARKET FOR LED, BY COUNTRY 2021 AND 2031(%)
- FIGURE 26. COMPARATIVE SHARE ANALYSIS OF DIE ATTACH MACHINE MARKET FOR OTHERS, BY COUNTRY 2021 AND 2031(%)
- FIGURE 27. DIE ATTACH MACHINE MARKET BY REGION, 2021
- FIGURE 28. U.S. DIE ATTACH MACHINE MARKET, 2021-2031 ($MILLION)
- FIGURE 29. CANADA DIE ATTACH MACHINE MARKET, 2021-2031 ($MILLION)
- FIGURE 30. MEXICO DIE ATTACH MACHINE MARKET, 2021-2031 ($MILLION)
- FIGURE 31. GERMANY DIE ATTACH MACHINE MARKET, 2021-2031 ($MILLION)
- FIGURE 32. FRANCE DIE ATTACH MACHINE MARKET, 2021-2031 ($MILLION)
- FIGURE 33. UK DIE ATTACH MACHINE MARKET, 2021-2031 ($MILLION)
- FIGURE 34. ITALY DIE ATTACH MACHINE MARKET, 2021-2031 ($MILLION)
- FIGURE 35. REST OF EUROPE DIE ATTACH MACHINE MARKET, 2021-2031 ($MILLION)
- FIGURE 36. CHINA DIE ATTACH MACHINE MARKET, 2021-2031 ($MILLION)
- FIGURE 37. INDIA DIE ATTACH MACHINE MARKET, 2021-2031 ($MILLION)
- FIGURE 38. JAPAN DIE ATTACH MACHINE MARKET, 2021-2031 ($MILLION)
- FIGURE 39. SOUTH KOREA DIE ATTACH MACHINE MARKET, 2021-2031 ($MILLION)
- FIGURE 40. REST OF ASIA-PACIFIC DIE ATTACH MACHINE MARKET, 2021-2031 ($MILLION)
- FIGURE 41. LATIN AMERICA DIE ATTACH MACHINE MARKET, 2021-2031 ($MILLION)
- FIGURE 42. MIDDLE EAST DIE ATTACH MACHINE MARKET, 2021-2031 ($MILLION)
- FIGURE 43. AFRICA DIE ATTACH MACHINE MARKET, 2021-2031 ($MILLION)
- FIGURE 44. TOP WINNING STRATEGIES, BY YEAR
- FIGURE 45. TOP WINNING STRATEGIES, BY DEVELOPMENT
- FIGURE 46. TOP WINNING STRATEGIES, BY COMPANY
- FIGURE 47. PRODUCT MAPPING OF TOP 10 PLAYERS
- FIGURE 48. COMPETITIVE DASHBOARD
- FIGURE 49. COMPETITIVE HEATMAP: DIE ATTACH MACHINE MARKET
- FIGURE 50. TOP PLAYER POSITIONING, 2021
- FIGURE 51. ASM PACIFIC TECHNOLOGY LIMITED: NET REVENUE, 2020-2022 ($MILLION)
- FIGURE 52. ASM PACIFIC TECHNOLOGY LIMITED: RESEARCH & DEVELOPMENT EXPENDITURE, 2020-2022 ($MILLION)
- FIGURE 53. ASM PACIFIC TECHNOLOGY LIMITED: REVENUE SHARE BY SEGMENT, 2022 (%)
- FIGURE 54. ASM PACIFIC TECHNOLOGY LIMITED: REVENUE SHARE BY REGION, 2022 (%)
- FIGURE 55. BE SEMICONDUCTOR INDUSTRIES N.V: NET REVENUE, 2020-2022 ($MILLION)
- FIGURE 56. BE SEMICONDUCTOR INDUSTRIES N.V: RESEARCH & DEVELOPMENT EXPENDITURE, 2020-2022 ($MILLION)
- FIGURE 57. BE SEMICONDUCTOR INDUSTRIES N.V: REVENUE SHARE BY SEGMENT, 2022 (%)
- FIGURE 58. BE SEMICONDUCTOR INDUSTRIES N.V: REVENUE SHARE BY REGION, 2022 (%)
- FIGURE 59. KULICKE AND SOFFA INDUSTRIES: NET REVENUE, 2020-2022 ($MILLION)
- FIGURE 60. KULICKE AND SOFFA INDUSTRIES: RESEARCH & DEVELOPMENT EXPENDITURE, 2020-2022
- FIGURE 61. KULICKE AND SOFFA INDUSTRIES: REVENUE SHARE BY SEGMENT, 2022 (%)
- FIGURE 62. KULICKE AND SOFFA INDUSTRIES: REVENUE SHARE BY REGION, 2021 (%)
- FIGURE 63. PANASONIC INDUSTRY CO., LTD.: NET REVENUE, 2020-2022 ($MILLION)
- FIGURE 64. PANASONIC INDUSTRY CO., LTD.: RESEARCH & DEVELOPMENT EXPENDITURE, 2020-2022 ($MILLION)
- FIGURE 65. PANASONIC INDUSTRY CO., LTD.: REVENUE SHARE BY REGION, 2022 (%)
- FIGURE 66. PANASONIC INDUSTRY CO., LTD.: REVENUE SHARE BY SEGMENT, 2022 (%)

