
PUBLISHER: Allied Market Research | PRODUCT CODE: 1298364

PUBLISHER: Allied Market Research | PRODUCT CODE: 1298364
Cell Analysis Market By Product, By Technique (Flow cytometry, Mass Spectrometry, Next Generation Sequencing, Polymerase Chain Reaction, Others), By Application, By End User : Global Opportunity Analysis and Industry Forecast, 2023-2032
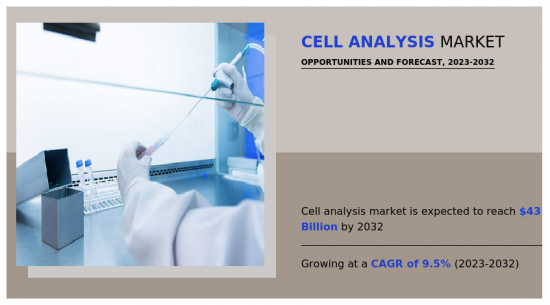
The Cell Analysis Market was valued at $17.1 billion in 2022 and is estimated to reach $42.9 billion by 2032, exhibiting a CAGR of 9.5% from 2023 to 2032. Cell analysis is used to observe and study the structure, composition, and behavior of individual cells. It involves the use of various techniques such as microscopy, flow cytometry, spectrophotometry, and immunoassay to obtain information about the health and activity of cells. It can be used to detect and diagnose diseases, monitor the response to treatments, and investigate the mechanisms of cellular functions.
The major factors that drive the growth of the market are the rise in technological advancement in cell analysis and an increase in the prevalence of chronic diseases such as cancer and genetic disorders. For instance, according to World Health Organization, cancer is a leading cause of death worldwide, which accounted for nearly 10 million deaths in 2020. Breast cancer accounted for the highest number of cases in 2020, with 2.26 million cases, followed by lung cancer with 2.21 million cases. The most common causes of cancer death in 2020 were lung cancer with 1.80 million deaths followed by colon and rectum cancer with 916,000 cases. In addition, the surge in R&D activities in the pharmaceutical & biotechnology industry and rise in focus on personalized medicines further propel the market growth. However, high cost of cell analysis products and the dearth of skilled professionals are anticipated to hamper the market growth in the upcoming years. Conversely, the high growth potential of single-cell sequencing is expected to provide numerous opportunities for market growth during the forecast period.
The cell analysis market is segmented into product, application, technique, end user, and region. By product, the market is bifurcated into consumables, software, services, and instruments. By application, it is segregated into oncology, immunology, cardiology, stem cell, genetic disease, and others. By technique, the market is categorized into flow cytometry, next-generation sequencing (NGS), polymerase chain reaction (PCR), mass spectrometry, and others. On the basis of end-user, it is divided into academic & research laboratories, biotechnology & pharmaceutical companies, hospitals & diagnostic laboratories, and others. Region-wise, it is analyzed across North America, Europe, Asia-Pacific, and LAMEA.
The major companies profiled in the report include: Becton, Dickinson and Company, Danaher Corporation, QIAGEN N.V., Thermo Fisher Scientific, Inc., Illumina, Inc., Bio-Rad Laboratories, Agilent Technologies, Inc., Sartorius AG, Biomerieux SA, and Standard BioTools Inc. Key players operating in the market have adopted product launch, product approval, and collaboration as their key strategies to expand their corporate training market share.
Key Benefits For Stakeholders
- This report provides a quantitative analysis of the market segments, current trends, estimations, and dynamics of the cell analysis market analysis from 2022 to 2032 to identify the prevailing cell analysis market opportunities.
- Market research is offered along with information related to key drivers, restraints, and opportunities.
- Porter's five forces analysis highlights the potency of buyers and suppliers to enable stakeholders to make profit-oriented business decisions and strengthen their supplier-buyer network.
- An in-depth analysis of the cell analysis market segmentation assists to determine the prevailing market opportunities.
- Major countries in each region are mapped according to their revenue contribution to the global market.
- Market player positioning facilitates benchmarking and provides a clear understanding of the present position of the market players.
- The report includes the analysis of the regional as well as global cell analysis market trends, key players, market segments, application areas, and market growth strategies.
Key Market Segments
By Technique
- Flow cytometry
- Mass Spectrometry
- Next Generation Sequencing (NGS)
- Polymerase Chain Reaction (PCR)
- Others
By Application
- Oncology
- Immunology
- Cardiology
- Genetic Disease
- Stem Cells
- Others
By Product
- Consumables
- Services
- Instruments
- Software
By End User
- Biotechnology and Pharmaceutical Companies
- Hospitals and Diagnostic Laboratories
- Academic and Research Laboratories
- Others
By Region
- North America
- U.S.
- Canada
- Mexico
- Europe
- Germany
- France
- UK
- Italy
- Spain
- Rest of Europe
- Asia-Pacific
- Japan
- China
- Australia
- South Korea
- India
- Rest of Asia-Pacific
- LAMEA
- Brazil
- Saudi Arabia
- South Africa
- Rest of LAMEA
Key Market Players:
- Agilent Technologies, Inc.
- Becton, Dickinson and Company
- Biomerieux SA
- Bio-Rad Laboratories, Inc.
- Danaher Corporation
- Illumina, Inc.
- Qiagen N.V.
- Sartorius AG
- Standard BioTools Inc.
- Thermo Fisher Scientific, Inc.
TABLE OF CONTENTS
CHAPTER 1: INTRODUCTION
- 1.1. Report description
- 1.2. Key market segments
- 1.3. Key benefits to the stakeholders
- 1.4. Research Methodology
- 1.4.1. Primary research
- 1.4.2. Secondary research
- 1.4.3. Analyst tools and models
CHAPTER 2: EXECUTIVE SUMMARY
- 2.1. CXO Perspective
CHAPTER 3: MARKET OVERVIEW
- 3.1. Market definition and scope
- 3.2. Key findings
- 3.2.1. Top impacting factors
- 3.2.2. Top investment pockets
- 3.3. Porter's five forces analysis
- 3.3.1. Bargaining power of suppliers
- 3.3.2. Bargaining power of buyers
- 3.3.3. Threat of substitutes
- 3.3.4. Threat of new entrants
- 3.3.5. Intensity of rivalry
- 3.4. Market dynamics
- 3.4.1. Drivers
- 3.4.1.1. Increase in prevalence of chronic disease
- 3.4.1.2. Advancement in cell analysis technology
- 3.4.1.3. Surge in popularity of personalized medicine approach
- 3.4.1. Drivers
- 3.4.2. Restraints
- 3.4.2.1. High cost of single cell analysis
- 3.4.3. Opportunities
- 3.4.3.1. High growth potential of Single cell sequencing
- 3.5. COVID-19 Impact Analysis on the market
CHAPTER 4: CELL ANALYSIS MARKET, BY PRODUCT
- 4.1. Overview
- 4.1.1. Market size and forecast
- 4.2. Consumables
- 4.2.1. Key market trends, growth factors and opportunities
- 4.2.2. Market size and forecast, by region
- 4.2.3. Market share analysis by country
- 4.3. Services
- 4.3.1. Key market trends, growth factors and opportunities
- 4.3.2. Market size and forecast, by region
- 4.3.3. Market share analysis by country
- 4.4. Instruments
- 4.4.1. Key market trends, growth factors and opportunities
- 4.4.2. Market size and forecast, by region
- 4.4.3. Market share analysis by country
- 4.5. Software
- 4.5.1. Key market trends, growth factors and opportunities
- 4.5.2. Market size and forecast, by region
- 4.5.3. Market share analysis by country
CHAPTER 5: CELL ANALYSIS MARKET, BY TECHNIQUE
- 5.1. Overview
- 5.1.1. Market size and forecast
- 5.2. Flow cytometry
- 5.2.1. Key market trends, growth factors and opportunities
- 5.2.2. Market size and forecast, by region
- 5.2.3. Market share analysis by country
- 5.3. Mass Spectrometry
- 5.3.1. Key market trends, growth factors and opportunities
- 5.3.2. Market size and forecast, by region
- 5.3.3. Market share analysis by country
- 5.4. Next Generation Sequencing (NGS)
- 5.4.1. Key market trends, growth factors and opportunities
- 5.4.2. Market size and forecast, by region
- 5.4.3. Market share analysis by country
- 5.5. Polymerase Chain Reaction (PCR)
- 5.5.1. Key market trends, growth factors and opportunities
- 5.5.2. Market size and forecast, by region
- 5.5.3. Market share analysis by country
- 5.6. Others
- 5.6.1. Key market trends, growth factors and opportunities
- 5.6.2. Market size and forecast, by region
- 5.6.3. Market share analysis by country
CHAPTER 6: CELL ANALYSIS MARKET, BY APPLICATION
- 6.1. Overview
- 6.1.1. Market size and forecast
- 6.2. Oncology
- 6.2.1. Key market trends, growth factors and opportunities
- 6.2.2. Market size and forecast, by region
- 6.2.3. Market share analysis by country
- 6.3. Immunology
- 6.3.1. Key market trends, growth factors and opportunities
- 6.3.2. Market size and forecast, by region
- 6.3.3. Market share analysis by country
- 6.4. Cardiology
- 6.4.1. Key market trends, growth factors and opportunities
- 6.4.2. Market size and forecast, by region
- 6.4.3. Market share analysis by country
- 6.5. Genetic Disease
- 6.5.1. Key market trends, growth factors and opportunities
- 6.5.2. Market size and forecast, by region
- 6.5.3. Market share analysis by country
- 6.6. Stem Cells
- 6.6.1. Key market trends, growth factors and opportunities
- 6.6.2. Market size and forecast, by region
- 6.6.3. Market share analysis by country
- 6.7. Others
- 6.7.1. Key market trends, growth factors and opportunities
- 6.7.2. Market size and forecast, by region
- 6.7.3. Market share analysis by country
CHAPTER 7: CELL ANALYSIS MARKET, BY END USER
- 7.1. Overview
- 7.1.1. Market size and forecast
- 7.2. Biotechnology and Pharmaceutical Companies
- 7.2.1. Key market trends, growth factors and opportunities
- 7.2.2. Market size and forecast, by region
- 7.2.3. Market share analysis by country
- 7.3. Hospitals and Diagnostic Laboratories
- 7.3.1. Key market trends, growth factors and opportunities
- 7.3.2. Market size and forecast, by region
- 7.3.3. Market share analysis by country
- 7.4. Academic and Research Laboratories
- 7.4.1. Key market trends, growth factors and opportunities
- 7.4.2. Market size and forecast, by region
- 7.4.3. Market share analysis by country
- 7.5. Others
- 7.5.1. Key market trends, growth factors and opportunities
- 7.5.2. Market size and forecast, by region
- 7.5.3. Market share analysis by country
CHAPTER 8: CELL ANALYSIS MARKET, BY REGION
- 8.1. Overview
- 8.1.1. Market size and forecast By Region
- 8.2. North America
- 8.2.1. Key trends and opportunities
- 8.2.2. Market size and forecast, by Product
- 8.2.3. Market size and forecast, by Technique
- 8.2.4. Market size and forecast, by Application
- 8.2.5. Market size and forecast, by End User
- 8.2.6. Market size and forecast, by country
- 8.2.6.1. U.S.
- 8.2.6.1.1. Key market trends, growth factors and opportunities
- 8.2.6.1.2. Market size and forecast, by Product
- 8.2.6.1.3. Market size and forecast, by Technique
- 8.2.6.1.4. Market size and forecast, by Application
- 8.2.6.1.5. Market size and forecast, by End User
- 8.2.6.2. Canada
- 8.2.6.2.1. Key market trends, growth factors and opportunities
- 8.2.6.2.2. Market size and forecast, by Product
- 8.2.6.2.3. Market size and forecast, by Technique
- 8.2.6.2.4. Market size and forecast, by Application
- 8.2.6.2.5. Market size and forecast, by End User
- 8.2.6.3. Mexico
- 8.2.6.3.1. Key market trends, growth factors and opportunities
- 8.2.6.3.2. Market size and forecast, by Product
- 8.2.6.3.3. Market size and forecast, by Technique
- 8.2.6.3.4. Market size and forecast, by Application
- 8.2.6.3.5. Market size and forecast, by End User
- 8.3. Europe
- 8.3.1. Key trends and opportunities
- 8.3.2. Market size and forecast, by Product
- 8.3.3. Market size and forecast, by Technique
- 8.3.4. Market size and forecast, by Application
- 8.3.5. Market size and forecast, by End User
- 8.3.6. Market size and forecast, by country
- 8.3.6.1. Germany
- 8.3.6.1.1. Key market trends, growth factors and opportunities
- 8.3.6.1.2. Market size and forecast, by Product
- 8.3.6.1.3. Market size and forecast, by Technique
- 8.3.6.1.4. Market size and forecast, by Application
- 8.3.6.1.5. Market size and forecast, by End User
- 8.3.6.2. France
- 8.3.6.2.1. Key market trends, growth factors and opportunities
- 8.3.6.2.2. Market size and forecast, by Product
- 8.3.6.2.3. Market size and forecast, by Technique
- 8.3.6.2.4. Market size and forecast, by Application
- 8.3.6.2.5. Market size and forecast, by End User
- 8.3.6.3. UK
- 8.3.6.3.1. Key market trends, growth factors and opportunities
- 8.3.6.3.2. Market size and forecast, by Product
- 8.3.6.3.3. Market size and forecast, by Technique
- 8.3.6.3.4. Market size and forecast, by Application
- 8.3.6.3.5. Market size and forecast, by End User
- 8.3.6.4. Italy
- 8.3.6.4.1. Key market trends, growth factors and opportunities
- 8.3.6.4.2. Market size and forecast, by Product
- 8.3.6.4.3. Market size and forecast, by Technique
- 8.3.6.4.4. Market size and forecast, by Application
- 8.3.6.4.5. Market size and forecast, by End User
- 8.3.6.5. Spain
- 8.3.6.5.1. Key market trends, growth factors and opportunities
- 8.3.6.5.2. Market size and forecast, by Product
- 8.3.6.5.3. Market size and forecast, by Technique
- 8.3.6.5.4. Market size and forecast, by Application
- 8.3.6.5.5. Market size and forecast, by End User
- 8.3.6.6. Rest of Europe
- 8.3.6.6.1. Key market trends, growth factors and opportunities
- 8.3.6.6.2. Market size and forecast, by Product
- 8.3.6.6.3. Market size and forecast, by Technique
- 8.3.6.6.4. Market size and forecast, by Application
- 8.3.6.6.5. Market size and forecast, by End User
- 8.4. Asia-Pacific
- 8.4.1. Key trends and opportunities
- 8.4.2. Market size and forecast, by Product
- 8.4.3. Market size and forecast, by Technique
- 8.4.4. Market size and forecast, by Application
- 8.4.5. Market size and forecast, by End User
- 8.4.6. Market size and forecast, by country
- 8.4.6.1. Japan
- 8.4.6.1.1. Key market trends, growth factors and opportunities
- 8.4.6.1.2. Market size and forecast, by Product
- 8.4.6.1.3. Market size and forecast, by Technique
- 8.4.6.1.4. Market size and forecast, by Application
- 8.4.6.1.5. Market size and forecast, by End User
- 8.4.6.2. China
- 8.4.6.2.1. Key market trends, growth factors and opportunities
- 8.4.6.2.2. Market size and forecast, by Product
- 8.4.6.2.3. Market size and forecast, by Technique
- 8.4.6.2.4. Market size and forecast, by Application
- 8.4.6.2.5. Market size and forecast, by End User
- 8.4.6.3. Australia
- 8.4.6.3.1. Key market trends, growth factors and opportunities
- 8.4.6.3.2. Market size and forecast, by Product
- 8.4.6.3.3. Market size and forecast, by Technique
- 8.4.6.3.4. Market size and forecast, by Application
- 8.4.6.3.5. Market size and forecast, by End User
- 8.4.6.4. South Korea
- 8.4.6.4.1. Key market trends, growth factors and opportunities
- 8.4.6.4.2. Market size and forecast, by Product
- 8.4.6.4.3. Market size and forecast, by Technique
- 8.4.6.4.4. Market size and forecast, by Application
- 8.4.6.4.5. Market size and forecast, by End User
- 8.4.6.5. India
- 8.4.6.5.1. Key market trends, growth factors and opportunities
- 8.4.6.5.2. Market size and forecast, by Product
- 8.4.6.5.3. Market size and forecast, by Technique
- 8.4.6.5.4. Market size and forecast, by Application
- 8.4.6.5.5. Market size and forecast, by End User
- 8.4.6.6. Rest of Asia-Pacific
- 8.4.6.6.1. Key market trends, growth factors and opportunities
- 8.4.6.6.2. Market size and forecast, by Product
- 8.4.6.6.3. Market size and forecast, by Technique
- 8.4.6.6.4. Market size and forecast, by Application
- 8.4.6.6.5. Market size and forecast, by End User
- 8.5. LAMEA
- 8.5.1. Key trends and opportunities
- 8.5.2. Market size and forecast, by Product
- 8.5.3. Market size and forecast, by Technique
- 8.5.4. Market size and forecast, by Application
- 8.5.5. Market size and forecast, by End User
- 8.5.6. Market size and forecast, by country
- 8.5.6.1. Brazil
- 8.5.6.1.1. Key market trends, growth factors and opportunities
- 8.5.6.1.2. Market size and forecast, by Product
- 8.5.6.1.3. Market size and forecast, by Technique
- 8.5.6.1.4. Market size and forecast, by Application
- 8.5.6.1.5. Market size and forecast, by End User
- 8.5.6.2. Saudi Arabia
- 8.5.6.2.1. Key market trends, growth factors and opportunities
- 8.5.6.2.2. Market size and forecast, by Product
- 8.5.6.2.3. Market size and forecast, by Technique
- 8.5.6.2.4. Market size and forecast, by Application
- 8.5.6.2.5. Market size and forecast, by End User
- 8.5.6.3. South Africa
- 8.5.6.3.1. Key market trends, growth factors and opportunities
- 8.5.6.3.2. Market size and forecast, by Product
- 8.5.6.3.3. Market size and forecast, by Technique
- 8.5.6.3.4. Market size and forecast, by Application
- 8.5.6.3.5. Market size and forecast, by End User
- 8.5.6.4. Rest of LAMEA
- 8.5.6.4.1. Key market trends, growth factors and opportunities
- 8.5.6.4.2. Market size and forecast, by Product
- 8.5.6.4.3. Market size and forecast, by Technique
- 8.5.6.4.4. Market size and forecast, by Application
- 8.5.6.4.5. Market size and forecast, by End User
CHAPTER 9: COMPETITIVE LANDSCAPE
- 9.1. Introduction
- 9.2. Top winning strategies
- 9.3. Product Mapping of Top 10 Player
- 9.4. Competitive Dashboard
- 9.5. Competitive Heatmap
- 9.6. Top player positioning, 2022
CHAPTER 10: COMPANY PROFILES
- 10.1. Agilent Technologies, Inc.
- 10.1.1. Company overview
- 10.1.2. Key Executives
- 10.1.3. Company snapshot
- 10.1.4. Operating business segments
- 10.1.5. Product portfolio
- 10.1.6. Business performance
- 10.1.7. Key strategic moves and developments
- 10.2. Becton, Dickinson and Company
- 10.2.1. Company overview
- 10.2.2. Key Executives
- 10.2.3. Company snapshot
- 10.2.4. Operating business segments
- 10.2.5. Product portfolio
- 10.2.6. Business performance
- 10.2.7. Key strategic moves and developments
- 10.3. Biomerieux SA
- 10.3.1. Company overview
- 10.3.2. Key Executives
- 10.3.3. Company snapshot
- 10.3.4. Operating business segments
- 10.3.5. Product portfolio
- 10.3.6. Business performance
- 10.3.7. Key strategic moves and developments
- 10.4. Bio-Rad Laboratories, Inc.
- 10.4.1. Company overview
- 10.4.2. Key Executives
- 10.4.3. Company snapshot
- 10.4.4. Operating business segments
- 10.4.5. Product portfolio
- 10.4.6. Business performance
- 10.4.7. Key strategic moves and developments
- 10.5. Danaher Corporation
- 10.5.1. Company overview
- 10.5.2. Key Executives
- 10.5.3. Company snapshot
- 10.5.4. Operating business segments
- 10.5.5. Product portfolio
- 10.5.6. Business performance
- 10.5.7. Key strategic moves and developments
- 10.6. Sartorius AG
- 10.6.1. Company overview
- 10.6.2. Key Executives
- 10.6.3. Company snapshot
- 10.6.4. Operating business segments
- 10.6.5. Product portfolio
- 10.6.6. Business performance
- 10.6.7. Key strategic moves and developments
- 10.7. Illumina, Inc.
- 10.7.1. Company overview
- 10.7.2. Key Executives
- 10.7.3. Company snapshot
- 10.7.4. Operating business segments
- 10.7.5. Product portfolio
- 10.7.6. Business performance
- 10.7.7. Key strategic moves and developments
- 10.8. Thermo Fisher Scientific, Inc.
- 10.8.1. Company overview
- 10.8.2. Key Executives
- 10.8.3. Company snapshot
- 10.8.4. Operating business segments
- 10.8.5. Product portfolio
- 10.8.6. Business performance
- 10.9. Qiagen N.V.
- 10.9.1. Company overview
- 10.9.2. Key Executives
- 10.9.3. Company snapshot
- 10.9.4. Operating business segments
- 10.9.5. Product portfolio
- 10.9.6. Business performance
- 10.9.7. Key strategic moves and developments
- 10.10. Standard BioTools Inc.
- 10.10.1. Company overview
- 10.10.2. Key Executives
- 10.10.3. Company snapshot
- 10.10.4. Operating business segments
- 10.10.5. Product portfolio
- 10.10.6. Business performance
- 10.10.7. Key strategic moves and developments
LIST OF TABLES
- TABLE 01. GLOBAL CELL ANALYSIS MARKET, BY PRODUCT, 2022-2032 ($MILLION)
- TABLE 02. CELL ANALYSIS MARKET FOR CONSUMABLES, BY REGION, 2022-2032 ($MILLION)
- TABLE 03. CELL ANALYSIS MARKET FOR SERVICES, BY REGION, 2022-2032 ($MILLION)
- TABLE 04. CELL ANALYSIS MARKET FOR INSTRUMENTS, BY REGION, 2022-2032 ($MILLION)
- TABLE 05. CELL ANALYSIS MARKET FOR SOFTWARE, BY REGION, 2022-2032 ($MILLION)
- TABLE 06. GLOBAL CELL ANALYSIS MARKET, BY TECHNIQUE, 2022-2032 ($MILLION)
- TABLE 07. CELL ANALYSIS MARKET FOR FLOW CYTOMETRY, BY REGION, 2022-2032 ($MILLION)
- TABLE 08. CELL ANALYSIS MARKET FOR MASS SPECTROMETRY, BY REGION, 2022-2032 ($MILLION)
- TABLE 09. CELL ANALYSIS MARKET FOR NEXT GENERATION SEQUENCING (NGS), BY REGION, 2022-2032 ($MILLION)
- TABLE 10. CELL ANALYSIS MARKET FOR POLYMERASE CHAIN REACTION (PCR), BY REGION, 2022-2032 ($MILLION)
- TABLE 11. CELL ANALYSIS MARKET FOR OTHERS, BY REGION, 2022-2032 ($MILLION)
- TABLE 12. GLOBAL CELL ANALYSIS MARKET, BY APPLICATION, 2022-2032 ($MILLION)
- TABLE 13. CELL ANALYSIS MARKET FOR ONCOLOGY, BY REGION, 2022-2032 ($MILLION)
- TABLE 14. CELL ANALYSIS MARKET FOR IMMUNOLOGY, BY REGION, 2022-2032 ($MILLION)
- TABLE 15. CELL ANALYSIS MARKET FOR CARDIOLOGY, BY REGION, 2022-2032 ($MILLION)
- TABLE 16. CELL ANALYSIS MARKET FOR GENETIC DISEASE, BY REGION, 2022-2032 ($MILLION)
- TABLE 17. CELL ANALYSIS MARKET FOR STEM CELLS, BY REGION, 2022-2032 ($MILLION)
- TABLE 18. CELL ANALYSIS MARKET FOR OTHERS, BY REGION, 2022-2032 ($MILLION)
- TABLE 19. GLOBAL CELL ANALYSIS MARKET, BY END USER, 2022-2032 ($MILLION)
- TABLE 20. CELL ANALYSIS MARKET FOR BIOTECHNOLOGY AND PHARMACEUTICAL COMPANIES, BY REGION, 2022-2032 ($MILLION)
- TABLE 21. CELL ANALYSIS MARKET FOR HOSPITALS AND DIAGNOSTIC LABORATORIES, BY REGION, 2022-2032 ($MILLION)
- TABLE 22. CELL ANALYSIS MARKET FOR ACADEMIC AND RESEARCH LABORATORIES, BY REGION, 2022-2032 ($MILLION)
- TABLE 23. CELL ANALYSIS MARKET FOR OTHERS, BY REGION, 2022-2032 ($MILLION)
- TABLE 24. CELL ANALYSIS MARKET, BY REGION, 2022-2032 ($MILLION)
- TABLE 25. NORTH AMERICA CELL ANALYSIS MARKET, BY PRODUCT, 2022-2032 ($MILLION)
- TABLE 26. NORTH AMERICA CELL ANALYSIS MARKET, BY TECHNIQUE, 2022-2032 ($MILLION)
- TABLE 27. NORTH AMERICA CELL ANALYSIS MARKET, BY APPLICATION, 2022-2032 ($MILLION)
- TABLE 28. NORTH AMERICA CELL ANALYSIS MARKET, BY END USER, 2022-2032 ($MILLION)
- TABLE 29. NORTH AMERICA CELL ANALYSIS MARKET, BY COUNTRY, 2022-2032 ($MILLION)
- TABLE 30. U.S. CELL ANALYSIS MARKET, BY PRODUCT, 2022-2032 ($MILLION)
- TABLE 31. U.S. CELL ANALYSIS MARKET, BY TECHNIQUE, 2022-2032 ($MILLION)
- TABLE 32. U.S. CELL ANALYSIS MARKET, BY APPLICATION, 2022-2032 ($MILLION)
- TABLE 33. U.S. CELL ANALYSIS MARKET, BY END USER, 2022-2032 ($MILLION)
- TABLE 34. CANADA CELL ANALYSIS MARKET, BY PRODUCT, 2022-2032 ($MILLION)
- TABLE 35. CANADA CELL ANALYSIS MARKET, BY TECHNIQUE, 2022-2032 ($MILLION)
- TABLE 36. CANADA CELL ANALYSIS MARKET, BY APPLICATION, 2022-2032 ($MILLION)
- TABLE 37. CANADA CELL ANALYSIS MARKET, BY END USER, 2022-2032 ($MILLION)
- TABLE 38. MEXICO CELL ANALYSIS MARKET, BY PRODUCT, 2022-2032 ($MILLION)
- TABLE 39. MEXICO CELL ANALYSIS MARKET, BY TECHNIQUE, 2022-2032 ($MILLION)
- TABLE 40. MEXICO CELL ANALYSIS MARKET, BY APPLICATION, 2022-2032 ($MILLION)
- TABLE 41. MEXICO CELL ANALYSIS MARKET, BY END USER, 2022-2032 ($MILLION)
- TABLE 42. EUROPE CELL ANALYSIS MARKET, BY PRODUCT, 2022-2032 ($MILLION)
- TABLE 43. EUROPE CELL ANALYSIS MARKET, BY TECHNIQUE, 2022-2032 ($MILLION)
- TABLE 44. EUROPE CELL ANALYSIS MARKET, BY APPLICATION, 2022-2032 ($MILLION)
- TABLE 45. EUROPE CELL ANALYSIS MARKET, BY END USER, 2022-2032 ($MILLION)
- TABLE 46. EUROPE CELL ANALYSIS MARKET, BY COUNTRY, 2022-2032 ($MILLION)
- TABLE 47. GERMANY CELL ANALYSIS MARKET, BY PRODUCT, 2022-2032 ($MILLION)
- TABLE 48. GERMANY CELL ANALYSIS MARKET, BY TECHNIQUE, 2022-2032 ($MILLION)
- TABLE 49. GERMANY CELL ANALYSIS MARKET, BY APPLICATION, 2022-2032 ($MILLION)
- TABLE 50. GERMANY CELL ANALYSIS MARKET, BY END USER, 2022-2032 ($MILLION)
- TABLE 51. FRANCE CELL ANALYSIS MARKET, BY PRODUCT, 2022-2032 ($MILLION)
- TABLE 52. FRANCE CELL ANALYSIS MARKET, BY TECHNIQUE, 2022-2032 ($MILLION)
- TABLE 53. FRANCE CELL ANALYSIS MARKET, BY APPLICATION, 2022-2032 ($MILLION)
- TABLE 54. FRANCE CELL ANALYSIS MARKET, BY END USER, 2022-2032 ($MILLION)
- TABLE 55. UK CELL ANALYSIS MARKET, BY PRODUCT, 2022-2032 ($MILLION)
- TABLE 56. UK CELL ANALYSIS MARKET, BY TECHNIQUE, 2022-2032 ($MILLION)
- TABLE 57. UK CELL ANALYSIS MARKET, BY APPLICATION, 2022-2032 ($MILLION)
- TABLE 58. UK CELL ANALYSIS MARKET, BY END USER, 2022-2032 ($MILLION)
- TABLE 59. ITALY CELL ANALYSIS MARKET, BY PRODUCT, 2022-2032 ($MILLION)
- TABLE 60. ITALY CELL ANALYSIS MARKET, BY TECHNIQUE, 2022-2032 ($MILLION)
- TABLE 61. ITALY CELL ANALYSIS MARKET, BY APPLICATION, 2022-2032 ($MILLION)
- TABLE 62. ITALY CELL ANALYSIS MARKET, BY END USER, 2022-2032 ($MILLION)
- TABLE 63. SPAIN CELL ANALYSIS MARKET, BY PRODUCT, 2022-2032 ($MILLION)
- TABLE 64. SPAIN CELL ANALYSIS MARKET, BY TECHNIQUE, 2022-2032 ($MILLION)
- TABLE 65. SPAIN CELL ANALYSIS MARKET, BY APPLICATION, 2022-2032 ($MILLION)
- TABLE 66. SPAIN CELL ANALYSIS MARKET, BY END USER, 2022-2032 ($MILLION)
- TABLE 67. REST OF EUROPE CELL ANALYSIS MARKET, BY PRODUCT, 2022-2032 ($MILLION)
- TABLE 68. REST OF EUROPE CELL ANALYSIS MARKET, BY TECHNIQUE, 2022-2032 ($MILLION)
- TABLE 69. REST OF EUROPE CELL ANALYSIS MARKET, BY APPLICATION, 2022-2032 ($MILLION)
- TABLE 70. REST OF EUROPE CELL ANALYSIS MARKET, BY END USER, 2022-2032 ($MILLION)
- TABLE 71. ASIA-PACIFIC CELL ANALYSIS MARKET, BY PRODUCT, 2022-2032 ($MILLION)
- TABLE 72. ASIA-PACIFIC CELL ANALYSIS MARKET, BY TECHNIQUE, 2022-2032 ($MILLION)
- TABLE 73. ASIA-PACIFIC CELL ANALYSIS MARKET, BY APPLICATION, 2022-2032 ($MILLION)
- TABLE 74. ASIA-PACIFIC CELL ANALYSIS MARKET, BY END USER, 2022-2032 ($MILLION)
- TABLE 75. ASIA-PACIFIC CELL ANALYSIS MARKET, BY COUNTRY, 2022-2032 ($MILLION)
- TABLE 76. JAPAN CELL ANALYSIS MARKET, BY PRODUCT, 2022-2032 ($MILLION)
- TABLE 77. JAPAN CELL ANALYSIS MARKET, BY TECHNIQUE, 2022-2032 ($MILLION)
- TABLE 78. JAPAN CELL ANALYSIS MARKET, BY APPLICATION, 2022-2032 ($MILLION)
- TABLE 79. JAPAN CELL ANALYSIS MARKET, BY END USER, 2022-2032 ($MILLION)
- TABLE 80. CHINA CELL ANALYSIS MARKET, BY PRODUCT, 2022-2032 ($MILLION)
- TABLE 81. CHINA CELL ANALYSIS MARKET, BY TECHNIQUE, 2022-2032 ($MILLION)
- TABLE 82. CHINA CELL ANALYSIS MARKET, BY APPLICATION, 2022-2032 ($MILLION)
- TABLE 83. CHINA CELL ANALYSIS MARKET, BY END USER, 2022-2032 ($MILLION)
- TABLE 84. AUSTRALIA CELL ANALYSIS MARKET, BY PRODUCT, 2022-2032 ($MILLION)
- TABLE 85. AUSTRALIA CELL ANALYSIS MARKET, BY TECHNIQUE, 2022-2032 ($MILLION)
- TABLE 86. AUSTRALIA CELL ANALYSIS MARKET, BY APPLICATION, 2022-2032 ($MILLION)
- TABLE 87. AUSTRALIA CELL ANALYSIS MARKET, BY END USER, 2022-2032 ($MILLION)
- TABLE 88. SOUTH KOREA CELL ANALYSIS MARKET, BY PRODUCT, 2022-2032 ($MILLION)
- TABLE 89. SOUTH KOREA CELL ANALYSIS MARKET, BY TECHNIQUE, 2022-2032 ($MILLION)
- TABLE 90. SOUTH KOREA CELL ANALYSIS MARKET, BY APPLICATION, 2022-2032 ($MILLION)
- TABLE 91. SOUTH KOREA CELL ANALYSIS MARKET, BY END USER, 2022-2032 ($MILLION)
- TABLE 92. INDIA CELL ANALYSIS MARKET, BY PRODUCT, 2022-2032 ($MILLION)
- TABLE 93. INDIA CELL ANALYSIS MARKET, BY TECHNIQUE, 2022-2032 ($MILLION)
- TABLE 94. INDIA CELL ANALYSIS MARKET, BY APPLICATION, 2022-2032 ($MILLION)
- TABLE 95. INDIA CELL ANALYSIS MARKET, BY END USER, 2022-2032 ($MILLION)
- TABLE 96. REST OF ASIA-PACIFIC CELL ANALYSIS MARKET, BY PRODUCT, 2022-2032 ($MILLION)
- TABLE 97. REST OF ASIA-PACIFIC CELL ANALYSIS MARKET, BY TECHNIQUE, 2022-2032 ($MILLION)
- TABLE 98. REST OF ASIA-PACIFIC CELL ANALYSIS MARKET, BY APPLICATION, 2022-2032 ($MILLION)
- TABLE 99. REST OF ASIA-PACIFIC CELL ANALYSIS MARKET, BY END USER, 2022-2032 ($MILLION)
- TABLE 100. LAMEA CELL ANALYSIS MARKET, BY PRODUCT, 2022-2032 ($MILLION)
- TABLE 101. LAMEA CELL ANALYSIS MARKET, BY TECHNIQUE, 2022-2032 ($MILLION)
- TABLE 102. LAMEA CELL ANALYSIS MARKET, BY APPLICATION, 2022-2032 ($MILLION)
- TABLE 103. LAMEA CELL ANALYSIS MARKET, BY END USER, 2022-2032 ($MILLION)
- TABLE 104. LAMEA CELL ANALYSIS MARKET, BY COUNTRY, 2022-2032 ($MILLION)
- TABLE 105. BRAZIL CELL ANALYSIS MARKET, BY PRODUCT, 2022-2032 ($MILLION)
- TABLE 106. BRAZIL CELL ANALYSIS MARKET, BY TECHNIQUE, 2022-2032 ($MILLION)
- TABLE 107. BRAZIL CELL ANALYSIS MARKET, BY APPLICATION, 2022-2032 ($MILLION)
- TABLE 108. BRAZIL CELL ANALYSIS MARKET, BY END USER, 2022-2032 ($MILLION)
- TABLE 109. SAUDI ARABIA CELL ANALYSIS MARKET, BY PRODUCT, 2022-2032 ($MILLION)
- TABLE 110. SAUDI ARABIA CELL ANALYSIS MARKET, BY TECHNIQUE, 2022-2032 ($MILLION)
- TABLE 111. SAUDI ARABIA CELL ANALYSIS MARKET, BY APPLICATION, 2022-2032 ($MILLION)
- TABLE 112. SAUDI ARABIA CELL ANALYSIS MARKET, BY END USER, 2022-2032 ($MILLION)
- TABLE 113. SOUTH AFRICA CELL ANALYSIS MARKET, BY PRODUCT, 2022-2032 ($MILLION)
- TABLE 114. SOUTH AFRICA CELL ANALYSIS MARKET, BY TECHNIQUE, 2022-2032 ($MILLION)
- TABLE 115. SOUTH AFRICA CELL ANALYSIS MARKET, BY APPLICATION, 2022-2032 ($MILLION)
- TABLE 116. SOUTH AFRICA CELL ANALYSIS MARKET, BY END USER, 2022-2032 ($MILLION)
- TABLE 117. REST OF LAMEA CELL ANALYSIS MARKET, BY PRODUCT, 2022-2032 ($MILLION)
- TABLE 118. REST OF LAMEA CELL ANALYSIS MARKET, BY TECHNIQUE, 2022-2032 ($MILLION)
- TABLE 119. REST OF LAMEA CELL ANALYSIS MARKET, BY APPLICATION, 2022-2032 ($MILLION)
- TABLE 120. REST OF LAMEA CELL ANALYSIS MARKET, BY END USER, 2022-2032 ($MILLION)
- TABLE 121. AGILENT TECHNOLOGIES, INC.: KEY EXECUTIVES
- TABLE 122. AGILENT TECHNOLOGIES, INC.: COMPANY SNAPSHOT
- TABLE 123. AGILENT TECHNOLOGIES, INC.: PRODUCT SEGMENTS
- TABLE 124. AGILENT TECHNOLOGIES, INC.: SERVICE SEGMENTS
- TABLE 125. AGILENT TECHNOLOGIES, INC.: PRODUCT PORTFOLIO
- TABLE 126. AGILENT TECHNOLOGIES, INC.: KEY STRATERGIES
- TABLE 127. BECTON, DICKINSON AND COMPANY: KEY EXECUTIVES
- TABLE 128. BECTON, DICKINSON AND COMPANY: COMPANY SNAPSHOT
- TABLE 129. BECTON, DICKINSON AND COMPANY: PRODUCT SEGMENTS
- TABLE 130. BECTON, DICKINSON AND COMPANY: PRODUCT PORTFOLIO
- TABLE 131. BECTON, DICKINSON AND COMPANY: KEY STRATERGIES
- TABLE 132. BIOMERIEUX SA: KEY EXECUTIVES
- TABLE 133. BIOMERIEUX SA: COMPANY SNAPSHOT
- TABLE 134. BIOMERIEUX SA: PRODUCT SEGMENTS
- TABLE 135. BIOMERIEUX SA: PRODUCT PORTFOLIO
- TABLE 136. BIOMERIEUX SA: KEY STRATERGIES
- TABLE 137. BIO-RAD LABORATORIES, INC. : KEY EXECUTIVES
- TABLE 138. BIO-RAD LABORATORIES, INC. : COMPANY SNAPSHOT
- TABLE 139. BIO-RAD LABORATORIES, INC. : PRODUCT SEGMENTS
- TABLE 140. BIO-RAD LABORATORIES, INC. : PRODUCT PORTFOLIO
- TABLE 141. BIO-RAD LABORATORIES, INC. : KEY STRATERGIES
- TABLE 142. DANAHER CORPORATION: KEY EXECUTIVES
- TABLE 143. DANAHER CORPORATION: COMPANY SNAPSHOT
- TABLE 144. DANAHER CORPORATION: PRODUCT SEGMENTS
- TABLE 145. DANAHER CORPORATION: PRODUCT PORTFOLIO
- TABLE 146. DANAHER CORPORATION: KEY STRATERGIES
- TABLE 147. SARTORIUS AG: KEY EXECUTIVES
- TABLE 148. SARTORIUS AG: COMPANY SNAPSHOT
- TABLE 149. SARTORIUS AG: PRODUCT SEGMENTS
- TABLE 150. SARTORIUS AG: PRODUCT PORTFOLIO
- TABLE 151. SARTORIUS AG: KEY STRATERGIES
- TABLE 152. ILLUMINA, INC.: KEY EXECUTIVES
- TABLE 153. ILLUMINA, INC.: COMPANY SNAPSHOT
- TABLE 154. ILLUMINA, INC.: PRODUCT SEGMENTS
- TABLE 155. ILLUMINA, INC.: PRODUCT PORTFOLIO
- TABLE 156. ILLUMINA, INC.: KEY STRATERGIES
- TABLE 157. THERMO FISHER SCIENTIFIC, INC.: KEY EXECUTIVES
- TABLE 158. THERMO FISHER SCIENTIFIC, INC.: COMPANY SNAPSHOT
- TABLE 159. THERMO FISHER SCIENTIFIC, INC.: SERVICE SEGMENTS
- TABLE 160. THERMO FISHER SCIENTIFIC, INC.: PRODUCT PORTFOLIO
- TABLE 161. QIAGEN N.V.: KEY EXECUTIVES
- TABLE 162. QIAGEN N.V.: COMPANY SNAPSHOT
- TABLE 163. QIAGEN N.V.: PRODUCT SEGMENTS
- TABLE 164. QIAGEN N.V.: PRODUCT PORTFOLIO
- TABLE 165. QIAGEN N.V.: KEY STRATERGIES
- TABLE 166. STANDARD BIOTOOLS INC.: KEY EXECUTIVES
- TABLE 167. STANDARD BIOTOOLS INC.: COMPANY SNAPSHOT
- TABLE 168. STANDARD BIOTOOLS INC.: PRODUCT SEGMENTS
- TABLE 169. STANDARD BIOTOOLS INC.: PRODUCT PORTFOLIO
- TABLE 170. STANDARD BIOTOOLS INC.: KEY STRATERGIES
LIST OF FIGURES
- FIGURE 01. CELL ANALYSIS MARKET, 2022-2032
- FIGURE 02. SEGMENTATION OF CELL ANALYSIS MARKET, 2022-2032
- FIGURE 03. TOP INVESTMENT POCKETS IN CELL ANALYSIS MARKET (2023-2032)
- FIGURE 04. HIGH BARGAINING POWER OF SUPPLIERS
- FIGURE 05. MODERATE BARGAINING POWER OF BUYERS
- FIGURE 06. MODERATE THREAT OF SUBSTITUTES
- FIGURE 07. LOW THREAT OF NEW ENTRANTS
- FIGURE 08. MODERATE INTENSITY OF RIVALRY
- FIGURE 09. DRIVERS, RESTRAINTS AND OPPORTUNITIES: GLOBALCELL ANALYSIS MARKET
- FIGURE 10. CELL ANALYSIS MARKET, BY PRODUCT, 2022(%)
- FIGURE 11. COMPARATIVE SHARE ANALYSIS OF CELL ANALYSIS MARKET FOR CONSUMABLES, BY COUNTRY 2022 AND 2032(%)
- FIGURE 12. COMPARATIVE SHARE ANALYSIS OF CELL ANALYSIS MARKET FOR SERVICES, BY COUNTRY 2022 AND 2032(%)
- FIGURE 13. COMPARATIVE SHARE ANALYSIS OF CELL ANALYSIS MARKET FOR INSTRUMENTS, BY COUNTRY 2022 AND 2032(%)
- FIGURE 14. COMPARATIVE SHARE ANALYSIS OF CELL ANALYSIS MARKET FOR SOFTWARE, BY COUNTRY 2022 AND 2032(%)
- FIGURE 15. CELL ANALYSIS MARKET, BY TECHNIQUE, 2022(%)
- FIGURE 16. COMPARATIVE SHARE ANALYSIS OF CELL ANALYSIS MARKET FOR FLOW CYTOMETRY, BY COUNTRY 2022 AND 2032(%)
- FIGURE 17. COMPARATIVE SHARE ANALYSIS OF CELL ANALYSIS MARKET FOR MASS SPECTROMETRY, BY COUNTRY 2022 AND 2032(%)
- FIGURE 18. COMPARATIVE SHARE ANALYSIS OF CELL ANALYSIS MARKET FOR NEXT GENERATION SEQUENCING (NGS), BY COUNTRY 2022 AND 2032(%)
- FIGURE 19. COMPARATIVE SHARE ANALYSIS OF CELL ANALYSIS MARKET FOR POLYMERASE CHAIN REACTION (PCR), BY COUNTRY 2022 AND 2032(%)
- FIGURE 20. COMPARATIVE SHARE ANALYSIS OF CELL ANALYSIS MARKET FOR OTHERS, BY COUNTRY 2022 AND 2032(%)
- FIGURE 21. CELL ANALYSIS MARKET, BY APPLICATION, 2022(%)
- FIGURE 22. COMPARATIVE SHARE ANALYSIS OF CELL ANALYSIS MARKET FOR ONCOLOGY, BY COUNTRY 2022 AND 2032(%)
- FIGURE 23. COMPARATIVE SHARE ANALYSIS OF CELL ANALYSIS MARKET FOR IMMUNOLOGY, BY COUNTRY 2022 AND 2032(%)
- FIGURE 24. COMPARATIVE SHARE ANALYSIS OF CELL ANALYSIS MARKET FOR CARDIOLOGY, BY COUNTRY 2022 AND 2032(%)
- FIGURE 25. COMPARATIVE SHARE ANALYSIS OF CELL ANALYSIS MARKET FOR GENETIC DISEASE, BY COUNTRY 2022 AND 2032(%)
- FIGURE 26. COMPARATIVE SHARE ANALYSIS OF CELL ANALYSIS MARKET FOR STEM CELLS, BY COUNTRY 2022 AND 2032(%)
- FIGURE 27. COMPARATIVE SHARE ANALYSIS OF CELL ANALYSIS MARKET FOR OTHERS, BY COUNTRY 2022 AND 2032(%)
- FIGURE 28. CELL ANALYSIS MARKET, BY END USER, 2022(%)
- FIGURE 29. COMPARATIVE SHARE ANALYSIS OF CELL ANALYSIS MARKET FOR BIOTECHNOLOGY AND PHARMACEUTICAL COMPANIES, BY COUNTRY 2022 AND 2032(%)
- FIGURE 30. COMPARATIVE SHARE ANALYSIS OF CELL ANALYSIS MARKET FOR HOSPITALS AND DIAGNOSTIC LABORATORIES, BY COUNTRY 2022 AND 2032(%)
- FIGURE 31. COMPARATIVE SHARE ANALYSIS OF CELL ANALYSIS MARKET FOR ACADEMIC AND RESEARCH LABORATORIES, BY COUNTRY 2022 AND 2032(%)
- FIGURE 32. COMPARATIVE SHARE ANALYSIS OF CELL ANALYSIS MARKET FOR OTHERS, BY COUNTRY 2022 AND 2032(%)
- FIGURE 33. CELL ANALYSIS MARKET BY REGION, 2022
- FIGURE 34. U.S. CELL ANALYSIS MARKET, 2022-2032 ($MILLION)
- FIGURE 35. CANADA CELL ANALYSIS MARKET, 2022-2032 ($MILLION)
- FIGURE 36. MEXICO CELL ANALYSIS MARKET, 2022-2032 ($MILLION)
- FIGURE 37. GERMANY CELL ANALYSIS MARKET, 2022-2032 ($MILLION)
- FIGURE 38. FRANCE CELL ANALYSIS MARKET, 2022-2032 ($MILLION)
- FIGURE 39. UK CELL ANALYSIS MARKET, 2022-2032 ($MILLION)
- FIGURE 40. ITALY CELL ANALYSIS MARKET, 2022-2032 ($MILLION)
- FIGURE 41. SPAIN CELL ANALYSIS MARKET, 2022-2032 ($MILLION)
- FIGURE 42. REST OF EUROPE CELL ANALYSIS MARKET, 2022-2032 ($MILLION)
- FIGURE 43. JAPAN CELL ANALYSIS MARKET, 2022-2032 ($MILLION)
- FIGURE 44. CHINA CELL ANALYSIS MARKET, 2022-2032 ($MILLION)
- FIGURE 45. AUSTRALIA CELL ANALYSIS MARKET, 2022-2032 ($MILLION)
- FIGURE 46. SOUTH KOREA CELL ANALYSIS MARKET, 2022-2032 ($MILLION)
- FIGURE 47. INDIA CELL ANALYSIS MARKET, 2022-2032 ($MILLION)
- FIGURE 48. REST OF ASIA-PACIFIC CELL ANALYSIS MARKET, 2022-2032 ($MILLION)
- FIGURE 49. BRAZIL CELL ANALYSIS MARKET, 2022-2032 ($MILLION)
- FIGURE 50. SAUDI ARABIA CELL ANALYSIS MARKET, 2022-2032 ($MILLION)
- FIGURE 51. SOUTH AFRICA CELL ANALYSIS MARKET, 2022-2032 ($MILLION)
- FIGURE 52. REST OF LAMEA CELL ANALYSIS MARKET, 2022-2032 ($MILLION)
- FIGURE 53. TOP WINNING STRATEGIES, BY YEAR
- FIGURE 54. TOP WINNING STRATEGIES, BY DEVELOPMENT
- FIGURE 55. TOP WINNING STRATEGIES, BY COMPANY
- FIGURE 56. PRODUCT MAPPING OF TOP 10 PLAYERS
- FIGURE 57. COMPETITIVE DASHBOARD
- FIGURE 58. COMPETITIVE HEATMAP: CELL ANALYSIS MARKET
- FIGURE 59. TOP PLAYER POSITIONING, 2022
- FIGURE 60. AGILENT TECHNOLOGIES, INC.: NET REVENUE, 2020-2022 ($MILLION)
- FIGURE 61. AGILENT TECHNOLOGIES, INC.: RESEARCH & DEVELOPMENT EXPENDITURE, 2020-2022 ($MILLION)
- FIGURE 62. AGILENT TECHNOLOGIES, INC.: REVENUE SHARE BY SEGMENT, 2022 (%)
- FIGURE 63. AGILENT TECHNOLOGIES, INC.: REVENUE SHARE BY REGION, 2022 (%)
- FIGURE 64. BECTON, DICKINSON AND COMPANY: NET REVENUE, 2020-2022 ($MILLION)
- FIGURE 65. BECTON, DICKINSON AND COMPANY: REVENUE SHARE BY SEGMENT, 2022 (%)
- FIGURE 66. BECTON, DICKINSON AND COMPANY: REVENUE SHARE BY REGION, 2022 (%)
- FIGURE 67. BIOMERIEUX SA: NET SALES, 2019-2021 ($MILLION)
- FIGURE 68. BIOMERIEUX SA: REVENUE SHARE BY SEGMENT, 2021 (%)
- FIGURE 69. BIOMERIEUX SA: REVENUE SHARE BY REGION, 2021 (%)
- FIGURE 70. BIO-RAD LABORATORIES, INC. : NET SALES, 2020-2022 ($MILLION)
- FIGURE 71. BIO-RAD LABORATORIES, INC. : REVENUE SHARE BY SEGMENT, 2022 (%)
- FIGURE 72. BIO-RAD LABORATORIES, INC. : REVENUE SHARE BY REGION, 2022 (%)
- FIGURE 73. DANAHER CORPORATION: NET SALES, 2020-2022 ($MILLION)
- FIGURE 74. DANAHER CORPORATION: REVENUE SHARE BY SEGMENT, 2022 (%)
- FIGURE 75. DANAHER CORPORATION: REVENUE SHARE BY REGION, 2022 (%)
- FIGURE 76. SARTORIUS AG: NET REVENUE, 2020-2022 ($MILLION)
- FIGURE 77. SARTORIUS AG: REVENUE SHARE BY SEGMENT, 2022 (%)
- FIGURE 78. SARTORIUS AG: REVENUE SHARE BY REGION, 2022 (%)
- FIGURE 79. ILLUMINA, INC.: NET REVENUE, 2020-2022 ($MILLION)
- FIGURE 80. ILLUMINA, INC.: REVENUE SHARE BY SEGMENT, 2022 (%)
- FIGURE 81. ILLUMINA, INC.: REVENUE SHARE BY REGION, 2022 (%)
- FIGURE 82. THERMO FISHER SCIENTIFIC, INC.: NET SALES, 2019-2021 ($MILLION)
- FIGURE 83. THERMO FISHER SCIENTIFIC, INC.: REVENUE SHARE BY REGION, 2021 (%)
- FIGURE 84. THERMO FISHER SCIENTIFIC, INC.: REVENUE SHARE BY SEGMENT, 2021 (%)
- FIGURE 85. QIAGEN N.V.: NET REVENUE, 2019-2021 ($MILLION)
- FIGURE 86. QIAGEN N.V.: REVENUE SHARE BY REGION, 2021 (%)
- FIGURE 87. STANDARD BIOTOOLS INC.: NET REVENUE, 2020-2022 ($MILLION)
- FIGURE 88. STANDARD BIOTOOLS INC.: REVENUE SHARE BY SEGMENT, 2022 (%)
- FIGURE 89. STANDARD BIOTOOLS INC.: REVENUE SHARE BY REGION, 2022 (%)

