
PUBLISHER: Allied Market Research | PRODUCT CODE: 1298423

PUBLISHER: Allied Market Research | PRODUCT CODE: 1298423
Brain Implant Market By Type (Deep brain stimulation, Vagus nerve stimulation), By Application (Parkinson's disease, Epilepsy, Others), By End User (Hospitals, Neurology clinics, Others): Global Opportunity Analysis and Industry Forecast, 2023-2032
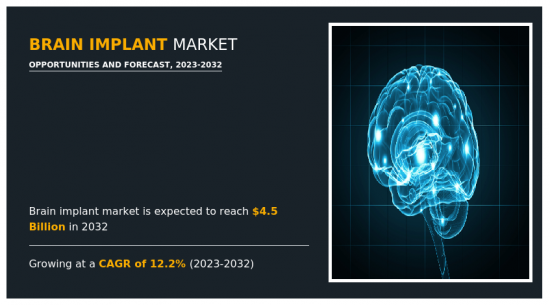
The brain implant market valued for $1.4 billion in 2022 and is estimated to reach $4.5 billion by 2032, exhibiting a CAGR of 12.2% from 2023 to 2032.
A brain implant is a medical device that is surgically implanted into the brain to monitor or control brain functions. Brain implant are also known as neural implants, neuroprosthetics, or brain-computer interfaces (BCIs). They are designed to help restore lost function or improve quality of life for those with neurological disorders or injuries. Several types of brain implant are there, each designed to serve a specific purpose. Some brain implant are used to treat neurological disorders such as Parkinson's disease and epilepsy. These implants work by delivering electrical impulses to specific regions of the brain to alleviate symptoms. In addition, compared to traditional medications, electrical stimulation of nerves can offer several advantages, such as targeted and adjustable stimulation, reduces risk of systemic side effects, and the potential for long-term benefits.
The global brain implant market growth is majorly driven by rise in prevalence of lifestyle diseases such as depression, increase in number of neurological disorders, and investment for neurological R&D. For instance, according to World Health Organization (WHO), more than 1 billion people throughout the world are affected by some type of neurological disease. Thus, prevalence of such conditions drives the demand for brain implant to manage and treat the neurological conditions. Moreover, adoption of technologically advanced products and surge in aging population propel the growth of the market as they are more susceptible to neurological disorders, such as epilepsy and parkinson's disease.
However, high costs associated with brain implant and the lack of skilled personnel in some countries hinder market growth to some extent. In addition, side effects such as allergic reaction due to implantation of device into the body and availability of other treatment options such as drug therapies and surgeries limit the growth of the market.
Moreover, development and technological advancements have improved the effectiveness and accessibility of brain implant, which is expected to drive the market growth. Furthermore, surge in awareness among healthcare providers and patients about advantages of brain implant, to treat a variety of conditions, is expected to drive demand in the market during the forecast period.
The brain implant market is segmented into type, application, end user, and region. By type, the market is categorized into deep brain stimulation and vagus nerve stimulation. By application, the market is classified into Parkinson's disease, epilepsy and others. By end user, the market is divided into hospitals, neurology clinics and others. Region wise, the market is analyzed across North America (U.S., Canada, and Mexico), Europe (Germany, France, UK, Italy, Spain, and rest of Europe), Asia-Pacific (Japan, China, India, Australia, South Korea, and rest of Asia-Pacific), and LAMEA (Brazil, South Africa, Saudi Arabia, and rest of LAMEA).
Major key players that operate in the global brain implant market are: Abbott Laboratories, Aleva Neurotherapeutics SA, Boston scientific corporation, Functional Neuromodulation Ltd., Medtronic plc, NeuroPace Inc., Beijing PINS Medical Co., Ltd, LivaNova PLC., MicroTransponder Inc. and SceneRay Co., Ltd. Key players operating in the market have adopted product approval and product launch as their key strategies to expand their product portfolio.
Key Benefits For Stakeholders
- This report provides a quantitative analysis of the market segments, current trends, estimations, and dynamics of the brain implant market analysis from 2022 to 2032 to identify the prevailing brain implant market opportunities.
- The market research is offered along with information related to key drivers, restraints, and opportunities.
- Porter's five forces analysis highlights the potency of buyers and suppliers to enable stakeholders make profit-oriented business decisions and strengthen their supplier-buyer network.
- In-depth analysis of the brain implant market segmentation assists to determine the prevailing market opportunities.
- Major countries in each region are mapped according to their revenue contribution to the global market.
- Market player positioning facilitates benchmarking and provides a clear understanding of the present position of the market players.
- The report includes the analysis of the regional as well as global brain implant market trends, key players, market segments, application areas, and market growth strategies.
Key Market Segments
By Type
- Deep brain stimulation
- Vagus nerve stimulation
By Application
- Parkinson's disease
- Epilepsy
- Others
By End User
- Hospitals
- Neurology clinics
- Others
By Region
- North America
- U.S.
- Canada
- Mexico
- Europe
- Germany
- France
- UK
- Italy
- Spain
- Rest of Europe
- Asia-Pacific
- Japan
- China
- India
- Australia
- South Korea
- Rest of Asia-Pacific
- LAMEA
- Brazil
- Saudi Arabia
- South Africa
- Rest of LAMEA
Key Market Players:
- Abbott Laboratories
- Aleva Neurotherapeutics SA
- Beijing PINS Medical Co., Ltd
- Boston Scientific Corporation
- Functional Neuromodulation, Ltd.
- LivaNova PLC
- Medtronic plc
- MicroTransponder Inc.
- NeuroPace, Inc.
- SceneRay Co., Ltd.
TABLE OF CONTENTS
CHAPTER 1: INTRODUCTION
- 1.1. Report description
- 1.2. Key market segments
- 1.3. Key benefits to the stakeholders
- 1.4. Research Methodology
- 1.4.1. Primary research
- 1.4.2. Secondary research
- 1.4.3. Analyst tools and models
CHAPTER 2: EXECUTIVE SUMMARY
- 2.1. CXO Perspective
CHAPTER 3: MARKET OVERVIEW
- 3.1. Market definition and scope
- 3.2. Key findings
- 3.2.1. Top impacting factors
- 3.2.2. Top investment pockets
- 3.3. Porter's five forces analysis
- 3.3.1. Bargaining power of suppliers
- 3.3.2. Bargaining power of buyers
- 3.3.3. Threat of substitutes
- 3.3.4. Threat of new entrants
- 3.3.5. Intensity of rivalry
- 3.4. Market dynamics
- 3.4.1. Drivers
- 3.4.1.1. Increase in prevalence neurological disorder
- 3.4.1.2. Initiatives by government and non-government organizations
- 3.4.1.3. Rise in geriatric population
- 3.4.1. Drivers
- 3.4.2. Restraints
- 3.4.2.1. High cost of brain implants
- 3.4.3. Opportunities
- 3.4.3.1. Rise in technological advancements
- 3.5. COVID-19 Impact Analysis on the market
CHAPTER 4: BRAIN IMPLANT MARKET, BY TYPE
- 4.1. Overview
- 4.1.1. Market size and forecast
- 4.2. Deep brain stimulation
- 4.2.1. Key market trends, growth factors and opportunities
- 4.2.2. Market size and forecast, by region
- 4.2.3. Market share analysis by country
- 4.3. Vagus nerve stimulation
- 4.3.1. Key market trends, growth factors and opportunities
- 4.3.2. Market size and forecast, by region
- 4.3.3. Market share analysis by country
CHAPTER 5: BRAIN IMPLANT MARKET, BY APPLICATION
- 5.1. Overview
- 5.1.1. Market size and forecast
- 5.2. Parkinson's disease
- 5.2.1. Key market trends, growth factors and opportunities
- 5.2.2. Market size and forecast, by region
- 5.2.3. Market share analysis by country
- 5.3. Epilepsy
- 5.3.1. Key market trends, growth factors and opportunities
- 5.3.2. Market size and forecast, by region
- 5.3.3. Market share analysis by country
- 5.4. Others
- 5.4.1. Key market trends, growth factors and opportunities
- 5.4.2. Market size and forecast, by region
- 5.4.3. Market share analysis by country
CHAPTER 6: BRAIN IMPLANT MARKET, BY END USER
- 6.1. Overview
- 6.1.1. Market size and forecast
- 6.2. Hospitals
- 6.2.1. Key market trends, growth factors and opportunities
- 6.2.2. Market size and forecast, by region
- 6.2.3. Market share analysis by country
- 6.3. Neurology clinics
- 6.3.1. Key market trends, growth factors and opportunities
- 6.3.2. Market size and forecast, by region
- 6.3.3. Market share analysis by country
- 6.4. Others
- 6.4.1. Key market trends, growth factors and opportunities
- 6.4.2. Market size and forecast, by region
- 6.4.3. Market share analysis by country
CHAPTER 7: BRAIN IMPLANT MARKET, BY REGION
- 7.1. Overview
- 7.1.1. Market size and forecast By Region
- 7.2. North America
- 7.2.1. Key trends and opportunities
- 7.2.2. Market size and forecast, by Type
- 7.2.3. Market size and forecast, by Application
- 7.2.4. Market size and forecast, by End User
- 7.2.5. Market size and forecast, by country
- 7.2.5.1. U.S.
- 7.2.5.1.1. Key market trends, growth factors and opportunities
- 7.2.5.1.2. Market size and forecast, by Type
- 7.2.5.1.3. Market size and forecast, by Application
- 7.2.5.1.4. Market size and forecast, by End User
- 7.2.5.2. Canada
- 7.2.5.2.1. Key market trends, growth factors and opportunities
- 7.2.5.2.2. Market size and forecast, by Type
- 7.2.5.2.3. Market size and forecast, by Application
- 7.2.5.2.4. Market size and forecast, by End User
- 7.2.5.3. Mexico
- 7.2.5.3.1. Key market trends, growth factors and opportunities
- 7.2.5.3.2. Market size and forecast, by Type
- 7.2.5.3.3. Market size and forecast, by Application
- 7.2.5.3.4. Market size and forecast, by End User
- 7.3. Europe
- 7.3.1. Key trends and opportunities
- 7.3.2. Market size and forecast, by Type
- 7.3.3. Market size and forecast, by Application
- 7.3.4. Market size and forecast, by End User
- 7.3.5. Market size and forecast, by country
- 7.3.5.1. Germany
- 7.3.5.1.1. Key market trends, growth factors and opportunities
- 7.3.5.1.2. Market size and forecast, by Type
- 7.3.5.1.3. Market size and forecast, by Application
- 7.3.5.1.4. Market size and forecast, by End User
- 7.3.5.2. France
- 7.3.5.2.1. Key market trends, growth factors and opportunities
- 7.3.5.2.2. Market size and forecast, by Type
- 7.3.5.2.3. Market size and forecast, by Application
- 7.3.5.2.4. Market size and forecast, by End User
- 7.3.5.3. UK
- 7.3.5.3.1. Key market trends, growth factors and opportunities
- 7.3.5.3.2. Market size and forecast, by Type
- 7.3.5.3.3. Market size and forecast, by Application
- 7.3.5.3.4. Market size and forecast, by End User
- 7.3.5.4. Italy
- 7.3.5.4.1. Key market trends, growth factors and opportunities
- 7.3.5.4.2. Market size and forecast, by Type
- 7.3.5.4.3. Market size and forecast, by Application
- 7.3.5.4.4. Market size and forecast, by End User
- 7.3.5.5. Spain
- 7.3.5.5.1. Key market trends, growth factors and opportunities
- 7.3.5.5.2. Market size and forecast, by Type
- 7.3.5.5.3. Market size and forecast, by Application
- 7.3.5.5.4. Market size and forecast, by End User
- 7.3.5.6. Rest of Europe
- 7.3.5.6.1. Key market trends, growth factors and opportunities
- 7.3.5.6.2. Market size and forecast, by Type
- 7.3.5.6.3. Market size and forecast, by Application
- 7.3.5.6.4. Market size and forecast, by End User
- 7.4. Asia-Pacific
- 7.4.1. Key trends and opportunities
- 7.4.2. Market size and forecast, by Type
- 7.4.3. Market size and forecast, by Application
- 7.4.4. Market size and forecast, by End User
- 7.4.5. Market size and forecast, by country
- 7.4.5.1. Japan
- 7.4.5.1.1. Key market trends, growth factors and opportunities
- 7.4.5.1.2. Market size and forecast, by Type
- 7.4.5.1.3. Market size and forecast, by Application
- 7.4.5.1.4. Market size and forecast, by End User
- 7.4.5.2. China
- 7.4.5.2.1. Key market trends, growth factors and opportunities
- 7.4.5.2.2. Market size and forecast, by Type
- 7.4.5.2.3. Market size and forecast, by Application
- 7.4.5.2.4. Market size and forecast, by End User
- 7.4.5.3. India
- 7.4.5.3.1. Key market trends, growth factors and opportunities
- 7.4.5.3.2. Market size and forecast, by Type
- 7.4.5.3.3. Market size and forecast, by Application
- 7.4.5.3.4. Market size and forecast, by End User
- 7.4.5.4. Australia
- 7.4.5.4.1. Key market trends, growth factors and opportunities
- 7.4.5.4.2. Market size and forecast, by Type
- 7.4.5.4.3. Market size and forecast, by Application
- 7.4.5.4.4. Market size and forecast, by End User
- 7.4.5.5. South Korea
- 7.4.5.5.1. Key market trends, growth factors and opportunities
- 7.4.5.5.2. Market size and forecast, by Type
- 7.4.5.5.3. Market size and forecast, by Application
- 7.4.5.5.4. Market size and forecast, by End User
- 7.4.5.6. Rest of Asia-Pacific
- 7.4.5.6.1. Key market trends, growth factors and opportunities
- 7.4.5.6.2. Market size and forecast, by Type
- 7.4.5.6.3. Market size and forecast, by Application
- 7.4.5.6.4. Market size and forecast, by End User
- 7.5. LAMEA
- 7.5.1. Key trends and opportunities
- 7.5.2. Market size and forecast, by Type
- 7.5.3. Market size and forecast, by Application
- 7.5.4. Market size and forecast, by End User
- 7.5.5. Market size and forecast, by country
- 7.5.5.1. Brazil
- 7.5.5.1.1. Key market trends, growth factors and opportunities
- 7.5.5.1.2. Market size and forecast, by Type
- 7.5.5.1.3. Market size and forecast, by Application
- 7.5.5.1.4. Market size and forecast, by End User
- 7.5.5.2. Saudi Arabia
- 7.5.5.2.1. Key market trends, growth factors and opportunities
- 7.5.5.2.2. Market size and forecast, by Type
- 7.5.5.2.3. Market size and forecast, by Application
- 7.5.5.2.4. Market size and forecast, by End User
- 7.5.5.3. South Africa
- 7.5.5.3.1. Key market trends, growth factors and opportunities
- 7.5.5.3.2. Market size and forecast, by Type
- 7.5.5.3.3. Market size and forecast, by Application
- 7.5.5.3.4. Market size and forecast, by End User
- 7.5.5.4. Rest of LAMEA
- 7.5.5.4.1. Key market trends, growth factors and opportunities
- 7.5.5.4.2. Market size and forecast, by Type
- 7.5.5.4.3. Market size and forecast, by Application
- 7.5.5.4.4. Market size and forecast, by End User
CHAPTER 8: COMPETITIVE LANDSCAPE
- 8.1. Introduction
- 8.2. Top winning strategies
- 8.3. Product Mapping of Top 10 Player
- 8.4. Competitive Dashboard
- 8.5. Competitive Heatmap
- 8.6. Top player positioning, 2022
CHAPTER 9: COMPANY PROFILES
- 9.1. Boston Scientific Corporation
- 9.1.1. Company overview
- 9.1.2. Key Executives
- 9.1.3. Company snapshot
- 9.1.4. Operating business segments
- 9.1.5. Product portfolio
- 9.1.6. Business performance
- 9.1.7. Key strategic moves and developments
- 9.2. Medtronic plc
- 9.2.1. Company overview
- 9.2.2. Key Executives
- 9.2.3. Company snapshot
- 9.2.4. Operating business segments
- 9.2.5. Product portfolio
- 9.2.6. Business performance
- 9.2.7. Key strategic moves and developments
- 9.3. LivaNova PLC
- 9.3.1. Company overview
- 9.3.2. Key Executives
- 9.3.3. Company snapshot
- 9.3.4. Operating business segments
- 9.3.5. Product portfolio
- 9.3.6. Business performance
- 9.3.7. Key strategic moves and developments
- 9.4. Aleva Neurotherapeutics SA
- 9.4.1. Company overview
- 9.4.2. Key Executives
- 9.4.3. Company snapshot
- 9.4.4. Operating business segments
- 9.4.5. Product portfolio
- 9.4.6. Key strategic moves and developments
- 9.5. NeuroPace, Inc.
- 9.5.1. Company overview
- 9.5.2. Key Executives
- 9.5.3. Company snapshot
- 9.5.4. Operating business segments
- 9.5.5. Product portfolio
- 9.5.6. Business performance
- 9.6. Functional Neuromodulation, Ltd.
- 9.6.1. Company overview
- 9.6.2. Key Executives
- 9.6.3. Company snapshot
- 9.6.4. Operating business segments
- 9.6.5. Product portfolio
- 9.7. Beijing PINS Medical Co., Ltd
- 9.7.1. Company overview
- 9.7.2. Key Executives
- 9.7.3. Company snapshot
- 9.7.4. Operating business segments
- 9.7.5. Product portfolio
- 9.8. Abbott Laboratories
- 9.8.1. Company overview
- 9.8.2. Key Executives
- 9.8.3. Company snapshot
- 9.8.4. Operating business segments
- 9.8.5. Product portfolio
- 9.8.6. Business performance
- 9.8.7. Key strategic moves and developments
- 9.9. SceneRay Co., Ltd.
- 9.9.1. Company overview
- 9.9.2. Key Executives
- 9.9.3. Company snapshot
- 9.9.4. Operating business segments
- 9.9.5. Product portfolio
- 9.10. MicroTransponder Inc.
- 9.10.1. Company overview
- 9.10.2. Key Executives
- 9.10.3. Company snapshot
- 9.10.4. Operating business segments
- 9.10.5. Product portfolio
LIST OF TABLES
- TABLE 01. GLOBAL BRAIN IMPLANT MARKET, BY TYPE, 2022-2032 ($MILLION)
- TABLE 02. BRAIN IMPLANT MARKET FOR DEEP BRAIN STIMULATION, BY REGION, 2022-2032 ($MILLION)
- TABLE 03. BRAIN IMPLANT MARKET FOR VAGUS NERVE STIMULATION, BY REGION, 2022-2032 ($MILLION)
- TABLE 04. GLOBAL BRAIN IMPLANT MARKET, BY APPLICATION, 2022-2032 ($MILLION)
- TABLE 05. BRAIN IMPLANT MARKET FOR PARKINSON'S DISEASE, BY REGION, 2022-2032 ($MILLION)
- TABLE 06. BRAIN IMPLANT MARKET FOR EPILEPSY, BY REGION, 2022-2032 ($MILLION)
- TABLE 07. BRAIN IMPLANT MARKET FOR OTHERS, BY REGION, 2022-2032 ($MILLION)
- TABLE 08. GLOBAL BRAIN IMPLANT MARKET, BY END USER, 2022-2032 ($MILLION)
- TABLE 09. BRAIN IMPLANT MARKET FOR HOSPITALS, BY REGION, 2022-2032 ($MILLION)
- TABLE 10. BRAIN IMPLANT MARKET FOR NEUROLOGY CLINICS, BY REGION, 2022-2032 ($MILLION)
- TABLE 11. BRAIN IMPLANT MARKET FOR OTHERS, BY REGION, 2022-2032 ($MILLION)
- TABLE 12. BRAIN IMPLANT MARKET, BY REGION, 2022-2032 ($MILLION)
- TABLE 13. NORTH AMERICA BRAIN IMPLANT MARKET, BY TYPE, 2022-2032 ($MILLION)
- TABLE 14. NORTH AMERICA BRAIN IMPLANT MARKET, BY APPLICATION, 2022-2032 ($MILLION)
- TABLE 15. NORTH AMERICA BRAIN IMPLANT MARKET, BY END USER, 2022-2032 ($MILLION)
- TABLE 16. NORTH AMERICA BRAIN IMPLANT MARKET, BY COUNTRY, 2022-2032 ($MILLION)
- TABLE 17. U.S. BRAIN IMPLANT MARKET, BY TYPE, 2022-2032 ($MILLION)
- TABLE 18. U.S. BRAIN IMPLANT MARKET, BY APPLICATION, 2022-2032 ($MILLION)
- TABLE 19. U.S. BRAIN IMPLANT MARKET, BY END USER, 2022-2032 ($MILLION)
- TABLE 20. CANADA BRAIN IMPLANT MARKET, BY TYPE, 2022-2032 ($MILLION)
- TABLE 21. CANADA BRAIN IMPLANT MARKET, BY APPLICATION, 2022-2032 ($MILLION)
- TABLE 22. CANADA BRAIN IMPLANT MARKET, BY END USER, 2022-2032 ($MILLION)
- TABLE 23. MEXICO BRAIN IMPLANT MARKET, BY TYPE, 2022-2032 ($MILLION)
- TABLE 24. MEXICO BRAIN IMPLANT MARKET, BY APPLICATION, 2022-2032 ($MILLION)
- TABLE 25. MEXICO BRAIN IMPLANT MARKET, BY END USER, 2022-2032 ($MILLION)
- TABLE 26. EUROPE BRAIN IMPLANT MARKET, BY TYPE, 2022-2032 ($MILLION)
- TABLE 27. EUROPE BRAIN IMPLANT MARKET, BY APPLICATION, 2022-2032 ($MILLION)
- TABLE 28. EUROPE BRAIN IMPLANT MARKET, BY END USER, 2022-2032 ($MILLION)
- TABLE 29. EUROPE BRAIN IMPLANT MARKET, BY COUNTRY, 2022-2032 ($MILLION)
- TABLE 30. GERMANY BRAIN IMPLANT MARKET, BY TYPE, 2022-2032 ($MILLION)
- TABLE 31. GERMANY BRAIN IMPLANT MARKET, BY APPLICATION, 2022-2032 ($MILLION)
- TABLE 32. GERMANY BRAIN IMPLANT MARKET, BY END USER, 2022-2032 ($MILLION)
- TABLE 33. FRANCE BRAIN IMPLANT MARKET, BY TYPE, 2022-2032 ($MILLION)
- TABLE 34. FRANCE BRAIN IMPLANT MARKET, BY APPLICATION, 2022-2032 ($MILLION)
- TABLE 35. FRANCE BRAIN IMPLANT MARKET, BY END USER, 2022-2032 ($MILLION)
- TABLE 36. UK BRAIN IMPLANT MARKET, BY TYPE, 2022-2032 ($MILLION)
- TABLE 37. UK BRAIN IMPLANT MARKET, BY APPLICATION, 2022-2032 ($MILLION)
- TABLE 38. UK BRAIN IMPLANT MARKET, BY END USER, 2022-2032 ($MILLION)
- TABLE 39. ITALY BRAIN IMPLANT MARKET, BY TYPE, 2022-2032 ($MILLION)
- TABLE 40. ITALY BRAIN IMPLANT MARKET, BY APPLICATION, 2022-2032 ($MILLION)
- TABLE 41. ITALY BRAIN IMPLANT MARKET, BY END USER, 2022-2032 ($MILLION)
- TABLE 42. SPAIN BRAIN IMPLANT MARKET, BY TYPE, 2022-2032 ($MILLION)
- TABLE 43. SPAIN BRAIN IMPLANT MARKET, BY APPLICATION, 2022-2032 ($MILLION)
- TABLE 44. SPAIN BRAIN IMPLANT MARKET, BY END USER, 2022-2032 ($MILLION)
- TABLE 45. REST OF EUROPE BRAIN IMPLANT MARKET, BY TYPE, 2022-2032 ($MILLION)
- TABLE 46. REST OF EUROPE BRAIN IMPLANT MARKET, BY APPLICATION, 2022-2032 ($MILLION)
- TABLE 47. REST OF EUROPE BRAIN IMPLANT MARKET, BY END USER, 2022-2032 ($MILLION)
- TABLE 48. ASIA-PACIFIC BRAIN IMPLANT MARKET, BY TYPE, 2022-2032 ($MILLION)
- TABLE 49. ASIA-PACIFIC BRAIN IMPLANT MARKET, BY APPLICATION, 2022-2032 ($MILLION)
- TABLE 50. ASIA-PACIFIC BRAIN IMPLANT MARKET, BY END USER, 2022-2032 ($MILLION)
- TABLE 51. ASIA-PACIFIC BRAIN IMPLANT MARKET, BY COUNTRY, 2022-2032 ($MILLION)
- TABLE 52. JAPAN BRAIN IMPLANT MARKET, BY TYPE, 2022-2032 ($MILLION)
- TABLE 53. JAPAN BRAIN IMPLANT MARKET, BY APPLICATION, 2022-2032 ($MILLION)
- TABLE 54. JAPAN BRAIN IMPLANT MARKET, BY END USER, 2022-2032 ($MILLION)
- TABLE 55. CHINA BRAIN IMPLANT MARKET, BY TYPE, 2022-2032 ($MILLION)
- TABLE 56. CHINA BRAIN IMPLANT MARKET, BY APPLICATION, 2022-2032 ($MILLION)
- TABLE 57. CHINA BRAIN IMPLANT MARKET, BY END USER, 2022-2032 ($MILLION)
- TABLE 58. INDIA BRAIN IMPLANT MARKET, BY TYPE, 2022-2032 ($MILLION)
- TABLE 59. INDIA BRAIN IMPLANT MARKET, BY APPLICATION, 2022-2032 ($MILLION)
- TABLE 60. INDIA BRAIN IMPLANT MARKET, BY END USER, 2022-2032 ($MILLION)
- TABLE 61. AUSTRALIA BRAIN IMPLANT MARKET, BY TYPE, 2022-2032 ($MILLION)
- TABLE 62. AUSTRALIA BRAIN IMPLANT MARKET, BY APPLICATION, 2022-2032 ($MILLION)
- TABLE 63. AUSTRALIA BRAIN IMPLANT MARKET, BY END USER, 2022-2032 ($MILLION)
- TABLE 64. SOUTH KOREA BRAIN IMPLANT MARKET, BY TYPE, 2022-2032 ($MILLION)
- TABLE 65. SOUTH KOREA BRAIN IMPLANT MARKET, BY APPLICATION, 2022-2032 ($MILLION)
- TABLE 66. SOUTH KOREA BRAIN IMPLANT MARKET, BY END USER, 2022-2032 ($MILLION)
- TABLE 67. REST OF ASIA-PACIFIC BRAIN IMPLANT MARKET, BY TYPE, 2022-2032 ($MILLION)
- TABLE 68. REST OF ASIA-PACIFIC BRAIN IMPLANT MARKET, BY APPLICATION, 2022-2032 ($MILLION)
- TABLE 69. REST OF ASIA-PACIFIC BRAIN IMPLANT MARKET, BY END USER, 2022-2032 ($MILLION)
- TABLE 70. LAMEA BRAIN IMPLANT MARKET, BY TYPE, 2022-2032 ($MILLION)
- TABLE 71. LAMEA BRAIN IMPLANT MARKET, BY APPLICATION, 2022-2032 ($MILLION)
- TABLE 72. LAMEA BRAIN IMPLANT MARKET, BY END USER, 2022-2032 ($MILLION)
- TABLE 73. LAMEA BRAIN IMPLANT MARKET, BY COUNTRY, 2022-2032 ($MILLION)
- TABLE 74. BRAZIL BRAIN IMPLANT MARKET, BY TYPE, 2022-2032 ($MILLION)
- TABLE 75. BRAZIL BRAIN IMPLANT MARKET, BY APPLICATION, 2022-2032 ($MILLION)
- TABLE 76. BRAZIL BRAIN IMPLANT MARKET, BY END USER, 2022-2032 ($MILLION)
- TABLE 77. SAUDI ARABIA BRAIN IMPLANT MARKET, BY TYPE, 2022-2032 ($MILLION)
- TABLE 78. SAUDI ARABIA BRAIN IMPLANT MARKET, BY APPLICATION, 2022-2032 ($MILLION)
- TABLE 79. SAUDI ARABIA BRAIN IMPLANT MARKET, BY END USER, 2022-2032 ($MILLION)
- TABLE 80. SOUTH AFRICA BRAIN IMPLANT MARKET, BY TYPE, 2022-2032 ($MILLION)
- TABLE 81. SOUTH AFRICA BRAIN IMPLANT MARKET, BY APPLICATION, 2022-2032 ($MILLION)
- TABLE 82. SOUTH AFRICA BRAIN IMPLANT MARKET, BY END USER, 2022-2032 ($MILLION)
- TABLE 83. REST OF LAMEA BRAIN IMPLANT MARKET, BY TYPE, 2022-2032 ($MILLION)
- TABLE 84. REST OF LAMEA BRAIN IMPLANT MARKET, BY APPLICATION, 2022-2032 ($MILLION)
- TABLE 85. REST OF LAMEA BRAIN IMPLANT MARKET, BY END USER, 2022-2032 ($MILLION)
- TABLE 86. BOSTON SCIENTIFIC CORPORATION: KEY EXECUTIVES
- TABLE 87. BOSTON SCIENTIFIC CORPORATION: COMPANY SNAPSHOT
- TABLE 88. BOSTON SCIENTIFIC CORPORATION: PRODUCT SEGMENTS
- TABLE 89. BOSTON SCIENTIFIC CORPORATION: PRODUCT PORTFOLIO
- TABLE 90. BOSTON SCIENTIFIC CORPORATION: KEY STRATERGIES
- TABLE 91. MEDTRONIC PLC: KEY EXECUTIVES
- TABLE 92. MEDTRONIC PLC: COMPANY SNAPSHOT
- TABLE 93. MEDTRONIC PLC: PRODUCT SEGMENTS
- TABLE 94. MEDTRONIC PLC: PRODUCT PORTFOLIO
- TABLE 95. MEDTRONIC PLC: KEY STRATERGIES
- TABLE 96. LIVANOVA PLC: KEY EXECUTIVES
- TABLE 97. LIVANOVA PLC: COMPANY SNAPSHOT
- TABLE 98. LIVANOVA PLC: PRODUCT SEGMENTS
- TABLE 99. LIVANOVA PLC: PRODUCT PORTFOLIO
- TABLE 100. LIVANOVA PLC: KEY STRATERGIES
- TABLE 101. ALEVA NEUROTHERAPEUTICS SA: KEY EXECUTIVES
- TABLE 102. ALEVA NEUROTHERAPEUTICS SA: COMPANY SNAPSHOT
- TABLE 103. ALEVA NEUROTHERAPEUTICS SA: PRODUCT SEGMENTS
- TABLE 104. ALEVA NEUROTHERAPEUTICS SA: PRODUCT PORTFOLIO
- TABLE 105. ALEVA NEUROTHERAPEUTICS SA: KEY STRATERGIES
- TABLE 106. NEUROPACE, INC.: KEY EXECUTIVES
- TABLE 107. NEUROPACE, INC.: COMPANY SNAPSHOT
- TABLE 108. NEUROPACE, INC.: PRODUCT SEGMENTS
- TABLE 109. NEUROPACE, INC.: PRODUCT PORTFOLIO
- TABLE 110. FUNCTIONAL NEUROMODULATION, LTD.: KEY EXECUTIVES
- TABLE 111. FUNCTIONAL NEUROMODULATION, LTD.: COMPANY SNAPSHOT
- TABLE 112. FUNCTIONAL NEUROMODULATION, LTD.: PRODUCT SEGMENTS
- TABLE 113. FUNCTIONAL NEUROMODULATION, LTD.: PRODUCT PORTFOLIO
- TABLE 114. BEIJING PINS MEDICAL CO., LTD: KEY EXECUTIVES
- TABLE 115. BEIJING PINS MEDICAL CO., LTD: COMPANY SNAPSHOT
- TABLE 116. BEIJING PINS MEDICAL CO., LTD: PRODUCT SEGMENTS
- TABLE 117. BEIJING PINS MEDICAL CO., LTD: PRODUCT PORTFOLIO
- TABLE 118. ABBOTT LABORATORIES: KEY EXECUTIVES
- TABLE 119. ABBOTT LABORATORIES: COMPANY SNAPSHOT
- TABLE 120. ABBOTT LABORATORIES: PRODUCT SEGMENTS
- TABLE 121. ABBOTT LABORATORIES: PRODUCT PORTFOLIO
- TABLE 122. ABBOTT LABORATORIES: KEY STRATERGIES
- TABLE 123. SCENERAY CO., LTD.: KEY EXECUTIVES
- TABLE 124. SCENERAY CO., LTD.: COMPANY SNAPSHOT
- TABLE 125. SCENERAY CO., LTD.: PRODUCT SEGMENTS
- TABLE 126. SCENERAY CO., LTD.: PRODUCT PORTFOLIO
- TABLE 127. MICROTRANSPONDER INC.: KEY EXECUTIVES
- TABLE 128. MICROTRANSPONDER INC.: COMPANY SNAPSHOT
- TABLE 129. MICROTRANSPONDER INC.: PRODUCT SEGMENTS
- TABLE 130. MICROTRANSPONDER INC.: PRODUCT PORTFOLIO
LIST OF FIGURES
- FIGURE 01. BRAIN IMPLANT MARKET, 2022-2032
- FIGURE 02. SEGMENTATION OF BRAIN IMPLANT MARKET, 2022-2032
- FIGURE 03. TOP INVESTMENT POCKETS IN BRAIN IMPLANT MARKET (2023-2032)
- FIGURE 04. LOW BARGAINING POWER OF SUPPLIERS
- FIGURE 05. LOW BARGAINING POWER OF BUYERS
- FIGURE 06. LOW THREAT OF SUBSTITUTES
- FIGURE 07. LOW THREAT OF NEW ENTRANTS
- FIGURE 08. LOW INTENSITY OF RIVALRY
- FIGURE 09. DRIVERS, RESTRAINTS AND OPPORTUNITIES: GLOBALBRAIN IMPLANT MARKET
- FIGURE 10. BRAIN IMPLANT MARKET, BY TYPE, 2022(%)
- FIGURE 11. COMPARATIVE SHARE ANALYSIS OF BRAIN IMPLANT MARKET FOR DEEP BRAIN STIMULATION, BY COUNTRY 2022 AND 2032(%)
- FIGURE 12. COMPARATIVE SHARE ANALYSIS OF BRAIN IMPLANT MARKET FOR VAGUS NERVE STIMULATION, BY COUNTRY 2022 AND 2032(%)
- FIGURE 13. BRAIN IMPLANT MARKET, BY APPLICATION, 2022(%)
- FIGURE 14. COMPARATIVE SHARE ANALYSIS OF BRAIN IMPLANT MARKET FOR PARKINSON'S DISEASE, BY COUNTRY 2022 AND 2032(%)
- FIGURE 15. COMPARATIVE SHARE ANALYSIS OF BRAIN IMPLANT MARKET FOR EPILEPSY, BY COUNTRY 2022 AND 2032(%)
- FIGURE 16. COMPARATIVE SHARE ANALYSIS OF BRAIN IMPLANT MARKET FOR OTHERS, BY COUNTRY 2022 AND 2032(%)
- FIGURE 17. BRAIN IMPLANT MARKET, BY END USER, 2022(%)
- FIGURE 18. COMPARATIVE SHARE ANALYSIS OF BRAIN IMPLANT MARKET FOR HOSPITALS, BY COUNTRY 2022 AND 2032(%)
- FIGURE 19. COMPARATIVE SHARE ANALYSIS OF BRAIN IMPLANT MARKET FOR NEUROLOGY CLINICS, BY COUNTRY 2022 AND 2032(%)
- FIGURE 20. COMPARATIVE SHARE ANALYSIS OF BRAIN IMPLANT MARKET FOR OTHERS, BY COUNTRY 2022 AND 2032(%)
- FIGURE 21. BRAIN IMPLANT MARKET BY REGION, 2022
- FIGURE 22. U.S. BRAIN IMPLANT MARKET, 2022-2032 ($MILLION)
- FIGURE 23. CANADA BRAIN IMPLANT MARKET, 2022-2032 ($MILLION)
- FIGURE 24. MEXICO BRAIN IMPLANT MARKET, 2022-2032 ($MILLION)
- FIGURE 25. GERMANY BRAIN IMPLANT MARKET, 2022-2032 ($MILLION)
- FIGURE 26. FRANCE BRAIN IMPLANT MARKET, 2022-2032 ($MILLION)
- FIGURE 27. UK BRAIN IMPLANT MARKET, 2022-2032 ($MILLION)
- FIGURE 28. ITALY BRAIN IMPLANT MARKET, 2022-2032 ($MILLION)
- FIGURE 29. SPAIN BRAIN IMPLANT MARKET, 2022-2032 ($MILLION)
- FIGURE 30. REST OF EUROPE BRAIN IMPLANT MARKET, 2022-2032 ($MILLION)
- FIGURE 31. JAPAN BRAIN IMPLANT MARKET, 2022-2032 ($MILLION)
- FIGURE 32. CHINA BRAIN IMPLANT MARKET, 2022-2032 ($MILLION)
- FIGURE 33. INDIA BRAIN IMPLANT MARKET, 2022-2032 ($MILLION)
- FIGURE 34. AUSTRALIA BRAIN IMPLANT MARKET, 2022-2032 ($MILLION)
- FIGURE 35. SOUTH KOREA BRAIN IMPLANT MARKET, 2022-2032 ($MILLION)
- FIGURE 36. REST OF ASIA-PACIFIC BRAIN IMPLANT MARKET, 2022-2032 ($MILLION)
- FIGURE 37. BRAZIL BRAIN IMPLANT MARKET, 2022-2032 ($MILLION)
- FIGURE 38. SAUDI ARABIA BRAIN IMPLANT MARKET, 2022-2032 ($MILLION)
- FIGURE 39. SOUTH AFRICA BRAIN IMPLANT MARKET, 2022-2032 ($MILLION)
- FIGURE 40. REST OF LAMEA BRAIN IMPLANT MARKET, 2022-2032 ($MILLION)
- FIGURE 41. TOP WINNING STRATEGIES, BY YEAR
- FIGURE 42. TOP WINNING STRATEGIES, BY DEVELOPMENT
- FIGURE 43. TOP WINNING STRATEGIES, BY COMPANY
- FIGURE 44. PRODUCT MAPPING OF TOP 10 PLAYERS
- FIGURE 45. COMPETITIVE DASHBOARD
- FIGURE 46. COMPETITIVE HEATMAP: BRAIN IMPLANT MARKET
- FIGURE 47. TOP PLAYER POSITIONING, 2022
- FIGURE 48. BOSTON SCIENTIFIC CORPORATION: NET SALES, 2020-2022 ($MILLION)
- FIGURE 49. BOSTON SCIENTIFIC CORPORATION: REVENUE SHARE BY SEGMENT, 2022 (%)
- FIGURE 50. BOSTON SCIENTIFIC CORPORATION: REVENUE SHARE BY REGION, 2022 (%)
- FIGURE 51. MEDTRONIC PLC: NET SALES, 2020-2022 ($MILLION)
- FIGURE 52. MEDTRONIC PLC: REVENUE SHARE BY SEGMENT, 2022 (%)
- FIGURE 53. MEDTRONIC PLC: REVENUE SHARE BY REGION, 2022 (%)
- FIGURE 54. LIVANOVA PLC: NET REVENUE, 2019-2021 ($MILLION)
- FIGURE 55. LIVANOVA PLC: REVENUE SHARE BY SEGMENT, 2021 (%)
- FIGURE 56. LIVANOVA PLC: REVENUE SHARE BY REGION, 2021 (%)
- FIGURE 57. NEUROPACE, INC.: NET REVENUE, 2020-2022 ($MILLION)
- FIGURE 58. ABBOTT LABORATORIES: NET SALES, 2020-2022 ($MILLION)
- FIGURE 59. ABBOTT LABORATORIES: RESEARCH & DEVELOPMENT EXPENDITURE, 2020-2022 ($MILLION)
- FIGURE 60. ABBOTT LABORATORIES: REVENUE SHARE BY REGION, 2022 (%)
- FIGURE 61. ABBOTT LABORATORIES: REVENUE SHARE BY SEGMENT, 2022 (%)

