
PUBLISHER: Allied Market Research | PRODUCT CODE: 1298431

PUBLISHER: Allied Market Research | PRODUCT CODE: 1298431
Commercial Water Heater Market By Type, By Storage Capacity, By Rated Capacity : Global Opportunity Analysis and Industry Forecast, 2023-2032
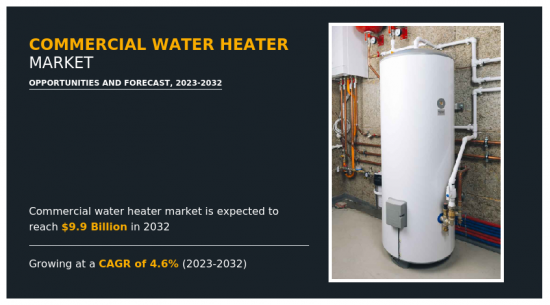
The global commercial water heater market was valued at $6.3 billion in 2022 and is projected to reach $9.9 billion by 2032, growing at a CAGR of 4.6% from 2023 to 2032.
The commercial water heater is a device that is used for the purpose of heating and storing water. These water heaters are used in several commercial applications such as offices, laundry, restaurants, cafes, hospitals, and hotels. They are often used in commercial and public infrastructure properties where the use of hot water is a basic need. These water heaters are used in large commercial buildings where continuous hot water supply is required in large quantities. Large hotel chains, resorts, commercial buildings, and public buildings requiring hot water are major consumers of commercial water heaters. The commercial sector plays a pivotal role in the development of a nation as it boosts domestic as well as foreign investments, thereby creating job opportunities.
Moreover, the expansion of the hospitality sector which offers luxury services boosts the demand for commercial water heaters. Hybrid heaters are rapidly being adopted owing to their enhanced efficiency and cost savings, which notably contribute toward the growth of the global market. In addition, they are widely used in setups where heat is produced during any operational process. These water heaters incur a higher cost of installation. Moreover, they need to be cleaned and maintained frequently to prevent damage and ensure efficient working conditions. These water heaters are prone to damage from salt or matter deposits from water, rusting, and breakage. Technological advancements in the present technology will offer lucrative opportunities for industry growth.
For the purpose of analysis, the global commercial water heater market scope covers segmentation based on type, storage capacity, rated capacity, and region. The report highlights the details about various types of commercial water heaters available in the market such as electric, gas, oil, solar, hybrid, and others. The electric segment dominated the commercial water heater market share for the year 2022. However, the solar commercial water heater segment is projected to grow at a higher pace during the forecast years owing to them being environmentally friendly as they use clean sources of energy. Furthermore, it provides information regarding water heaters with storage below 500 liters, 500-1,000 liters, 1,000-3,000 liters, 3,000-4,000 liters, and above 4,000 liters. The 500-1000 liters segment garnered the highest market share in 2022.
However, the below 500 liters segment is projected to grow at a higher pace during the projection period due to rising demand from small and medium commercial sectors. Moreover, heaters with rated capacity of 0-10 kW, 10-50 kW, 50-100 kW, and above 100 kW are described in the study. The 10-50 kW segment dominated the market growth in 2022 and is also projected to continue its dominance over the forecast period. This is due to rising demand from small and medium commercial sections, especially from resorts and hotels in the tourism industry.
Moreover, it analyzes the current market trends of commercial water heaters across different regions such as North America, Europe, Asia-Pacific, and LAMEA and suggests future growth opportunities along with consideration of the COVID-19 impact. North America garnered the highest market share in 2022 for the commercial water heater market. However, Asia-Pacific is projected to grow at a higher CAGR during the forecast period. This is due to the rising commercial sector in the developing economies. China is the largest consumer as well as producer of commercial water heaters, which acts as the key driver of the market. Moreover, the demand for hot water is at its peak during the winter season, which notably contributes toward the market growth.
The growth drivers, restraints, and opportunities are explained in the report to better understand the market dynamics. This report further highlights the key areas of investment. In addition, it includes Porter's five forces analysis to understand the competitive scenario of the industry and the role of each stakeholder. Value chain analysis for this industry, which includes R&D, components manufacturers, assembly, programming & testing, marketing & sales, customers, and post-sales services, is explained. The report features the strategies adopted by key market players to maintain their foothold in the market.
Furthermore, it highlights the competitive landscape of the key players to increase their market share and sustain intense competition in the industry. The major players profiled in the report include A.O. Smith Corporation, Danfoss A/S, Mitsubishi Electric Corporation, STIEBEL ELTRON GmbH and Co. KG, NIBE Industrier AB, Carrier Global Corporation, Robert Bosch GmbH, Rheem Manufacturing Company, Bajaj Electricals Ltd., and Bradford White Corporation. Other players in the industry are Racold, Venus, Nortiz Corporation, Daikin Industries, Valliant, and American Water Heaters.
Key Benefits For Stakeholders
- This report provides a quantitative analysis of the market segments, current trends, estimations, and dynamics of the commercial water heater market analysis from 2022 to 2032 to identify the prevailing commercial water heater market opportunities.
- The market research is offered along with information related to key drivers, restraints, and opportunities.
- Porter's five forces analysis highlights the potency of buyers and suppliers to enable stakeholders make profit-oriented business decisions and strengthen their supplier-buyer network.
- In-depth analysis of the commercial water heater market segmentation assists to determine the prevailing market opportunities.
- Major countries in each region are mapped according to their revenue contribution to the global market.
- Market player positioning facilitates benchmarking and provides a clear understanding of the present position of the market players.
- The report includes the analysis of the regional as well as global commercial water heater market trends, key players, market segments, application areas, and market growth strategies.
Key Market Segments
By Type
- Electric
- Gas
- Oil
- Solar
- Hybrid
- Others
By Storage Capacity
- Below 500 liters
- 500-1000 liters
- 1000-3000 liters
- 3000-4000 liters
- 4000 and Above
By Rated Capacity
- 0-10 kW
- 10-50 kW
- 50-100 kW
- Above 100 kW
By Region
- North America
- U.S.
- Canada
- Mexico
- Europe
- Germany
- UK
- France
- Italy
- Spain
- Rest of Europe
- Asia-Pacific
- China
- Japan
- India
- South Korea
- Australia
- Rest of Asia-Pacific
- LAMEA
- Brazil
- Saudi Arabia
- South Africa
- Rest of LAMEA
Key Market Players:
- A.O. Smith Corporation
- Bajaj Electricals Ltd
- Bradford White Corporation
- Carrier Global Corporation
- Danfoss A/S
- Mitsubishi Electric Corporation
- NIBE Industrier AB
- Rheem Manufacturing Company
- Robert Bosch GmbH
- STIEBEL ELTRON GmbH and Co. KG
TABLE OF CONTENTS
CHAPTER 1: INTRODUCTION
- 1.1. Report description
- 1.2. Key market segments
- 1.3. Key benefits to the stakeholders
- 1.4. Research Methodology
- 1.4.1. Primary research
- 1.4.2. Secondary research
- 1.4.3. Analyst tools and models
CHAPTER 2: EXECUTIVE SUMMARY
- 2.1. CXO Perspective
CHAPTER 3: MARKET OVERVIEW
- 3.1. Market definition and scope
- 3.2. Key findings
- 3.2.1. Top impacting factors
- 3.2.2. Top investment pockets
- 3.3. Porter's five forces analysis
- 3.3.1. Bargaining power of suppliers
- 3.3.2. Bargaining power of buyers
- 3.3.3. Threat of substitutes
- 3.3.4. Threat of new entrants
- 3.3.5. Intensity of rivalry
- 3.4. Market dynamics
- 3.4.1. Drivers
- 3.4.1.1. Increased investment in the commercial sector
- 3.4.1.2. Rise in use of hybrid water heaters in the commercial sector
- 3.4.1. Drivers
- 3.4.2. Restraints
- 3.4.2.1. High cost of installation and maintenance
- 3.4.3. Opportunities
- 3.4.3.1. Advancements in present technologies
- 3.5. COVID-19 Impact Analysis on the market
- 3.6. Patent Landscape
- 3.7. Value Chain Analysis
CHAPTER 4: COMMERCIAL WATER HEATER MARKET, BY TYPE
- 4.1. Overview
- 4.1.1. Market size and forecast
- 4.2. Electric
- 4.2.1. Key market trends, growth factors and opportunities
- 4.2.2. Market size and forecast, by region
- 4.2.3. Market share analysis by country
- 4.3. Gas
- 4.3.1. Key market trends, growth factors and opportunities
- 4.3.2. Market size and forecast, by region
- 4.3.3. Market share analysis by country
- 4.4. Oil
- 4.4.1. Key market trends, growth factors and opportunities
- 4.4.2. Market size and forecast, by region
- 4.4.3. Market share analysis by country
- 4.5. Solar
- 4.5.1. Key market trends, growth factors and opportunities
- 4.5.2. Market size and forecast, by region
- 4.5.3. Market share analysis by country
- 4.6. Hybrid
- 4.6.1. Key market trends, growth factors and opportunities
- 4.6.2. Market size and forecast, by region
- 4.6.3. Market share analysis by country
- 4.7. Others
- 4.7.1. Key market trends, growth factors and opportunities
- 4.7.2. Market size and forecast, by region
- 4.7.3. Market share analysis by country
CHAPTER 5: COMMERCIAL WATER HEATER MARKET, BY STORAGE CAPACITY
- 5.1. Overview
- 5.1.1. Market size and forecast
- 5.2. Below 500 liters
- 5.2.1. Key market trends, growth factors and opportunities
- 5.2.2. Market size and forecast, by region
- 5.2.3. Market share analysis by country
- 5.3. 500-1000 liters
- 5.3.1. Key market trends, growth factors and opportunities
- 5.3.2. Market size and forecast, by region
- 5.3.3. Market share analysis by country
- 5.4. 1000-3000 liters
- 5.4.1. Key market trends, growth factors and opportunities
- 5.4.2. Market size and forecast, by region
- 5.4.3. Market share analysis by country
- 5.5. 3000-4000 liters
- 5.5.1. Key market trends, growth factors and opportunities
- 5.5.2. Market size and forecast, by region
- 5.5.3. Market share analysis by country
- 5.6. 4000 and Above
- 5.6.1. Key market trends, growth factors and opportunities
- 5.6.2. Market size and forecast, by region
- 5.6.3. Market share analysis by country
CHAPTER 6: COMMERCIAL WATER HEATER MARKET, BY RATED CAPACITY
- 6.1. Overview
- 6.1.1. Market size and forecast
- 6.2. 0-10 kW
- 6.2.1. Key market trends, growth factors and opportunities
- 6.2.2. Market size and forecast, by region
- 6.2.3. Market share analysis by country
- 6.3. 10-50 kW
- 6.3.1. Key market trends, growth factors and opportunities
- 6.3.2. Market size and forecast, by region
- 6.3.3. Market share analysis by country
- 6.4. 50-100 kW
- 6.4.1. Key market trends, growth factors and opportunities
- 6.4.2. Market size and forecast, by region
- 6.4.3. Market share analysis by country
- 6.5. Above 100 kW
- 6.5.1. Key market trends, growth factors and opportunities
- 6.5.2. Market size and forecast, by region
- 6.5.3. Market share analysis by country
CHAPTER 7: COMMERCIAL WATER HEATER MARKET, BY REGION
- 7.1. Overview
- 7.1.1. Market size and forecast By Region
- 7.2. North America
- 7.2.1. Key trends and opportunities
- 7.2.2. Market size and forecast, by Type
- 7.2.3. Market size and forecast, by Storage Capacity
- 7.2.4. Market size and forecast, by Rated Capacity
- 7.2.5. Market size and forecast, by country
- 7.2.5.1. U.S.
- 7.2.5.1.1. Key market trends, growth factors and opportunities
- 7.2.5.1.2. Market size and forecast, by Type
- 7.2.5.1.3. Market size and forecast, by Storage Capacity
- 7.2.5.1.4. Market size and forecast, by Rated Capacity
- 7.2.5.2. Canada
- 7.2.5.2.1. Key market trends, growth factors and opportunities
- 7.2.5.2.2. Market size and forecast, by Type
- 7.2.5.2.3. Market size and forecast, by Storage Capacity
- 7.2.5.2.4. Market size and forecast, by Rated Capacity
- 7.2.5.3. Mexico
- 7.2.5.3.1. Key market trends, growth factors and opportunities
- 7.2.5.3.2. Market size and forecast, by Type
- 7.2.5.3.3. Market size and forecast, by Storage Capacity
- 7.2.5.3.4. Market size and forecast, by Rated Capacity
- 7.3. Europe
- 7.3.1. Key trends and opportunities
- 7.3.2. Market size and forecast, by Type
- 7.3.3. Market size and forecast, by Storage Capacity
- 7.3.4. Market size and forecast, by Rated Capacity
- 7.3.5. Market size and forecast, by country
- 7.3.5.1. Germany
- 7.3.5.1.1. Key market trends, growth factors and opportunities
- 7.3.5.1.2. Market size and forecast, by Type
- 7.3.5.1.3. Market size and forecast, by Storage Capacity
- 7.3.5.1.4. Market size and forecast, by Rated Capacity
- 7.3.5.2. UK
- 7.3.5.2.1. Key market trends, growth factors and opportunities
- 7.3.5.2.2. Market size and forecast, by Type
- 7.3.5.2.3. Market size and forecast, by Storage Capacity
- 7.3.5.2.4. Market size and forecast, by Rated Capacity
- 7.3.5.3. France
- 7.3.5.3.1. Key market trends, growth factors and opportunities
- 7.3.5.3.2. Market size and forecast, by Type
- 7.3.5.3.3. Market size and forecast, by Storage Capacity
- 7.3.5.3.4. Market size and forecast, by Rated Capacity
- 7.3.5.4. Italy
- 7.3.5.4.1. Key market trends, growth factors and opportunities
- 7.3.5.4.2. Market size and forecast, by Type
- 7.3.5.4.3. Market size and forecast, by Storage Capacity
- 7.3.5.4.4. Market size and forecast, by Rated Capacity
- 7.3.5.5. Spain
- 7.3.5.5.1. Key market trends, growth factors and opportunities
- 7.3.5.5.2. Market size and forecast, by Type
- 7.3.5.5.3. Market size and forecast, by Storage Capacity
- 7.3.5.5.4. Market size and forecast, by Rated Capacity
- 7.3.5.6. Rest of Europe
- 7.3.5.6.1. Key market trends, growth factors and opportunities
- 7.3.5.6.2. Market size and forecast, by Type
- 7.3.5.6.3. Market size and forecast, by Storage Capacity
- 7.3.5.6.4. Market size and forecast, by Rated Capacity
- 7.4. Asia-Pacific
- 7.4.1. Key trends and opportunities
- 7.4.2. Market size and forecast, by Type
- 7.4.3. Market size and forecast, by Storage Capacity
- 7.4.4. Market size and forecast, by Rated Capacity
- 7.4.5. Market size and forecast, by country
- 7.4.5.1. China
- 7.4.5.1.1. Key market trends, growth factors and opportunities
- 7.4.5.1.2. Market size and forecast, by Type
- 7.4.5.1.3. Market size and forecast, by Storage Capacity
- 7.4.5.1.4. Market size and forecast, by Rated Capacity
- 7.4.5.2. Japan
- 7.4.5.2.1. Key market trends, growth factors and opportunities
- 7.4.5.2.2. Market size and forecast, by Type
- 7.4.5.2.3. Market size and forecast, by Storage Capacity
- 7.4.5.2.4. Market size and forecast, by Rated Capacity
- 7.4.5.3. India
- 7.4.5.3.1. Key market trends, growth factors and opportunities
- 7.4.5.3.2. Market size and forecast, by Type
- 7.4.5.3.3. Market size and forecast, by Storage Capacity
- 7.4.5.3.4. Market size and forecast, by Rated Capacity
- 7.4.5.4. South Korea
- 7.4.5.4.1. Key market trends, growth factors and opportunities
- 7.4.5.4.2. Market size and forecast, by Type
- 7.4.5.4.3. Market size and forecast, by Storage Capacity
- 7.4.5.4.4. Market size and forecast, by Rated Capacity
- 7.4.5.5. Australia
- 7.4.5.5.1. Key market trends, growth factors and opportunities
- 7.4.5.5.2. Market size and forecast, by Type
- 7.4.5.5.3. Market size and forecast, by Storage Capacity
- 7.4.5.5.4. Market size and forecast, by Rated Capacity
- 7.4.5.6. Rest of Asia-Pacific
- 7.4.5.6.1. Key market trends, growth factors and opportunities
- 7.4.5.6.2. Market size and forecast, by Type
- 7.4.5.6.3. Market size and forecast, by Storage Capacity
- 7.4.5.6.4. Market size and forecast, by Rated Capacity
- 7.5. LAMEA
- 7.5.1. Key trends and opportunities
- 7.5.2. Market size and forecast, by Type
- 7.5.3. Market size and forecast, by Storage Capacity
- 7.5.4. Market size and forecast, by Rated Capacity
- 7.5.5. Market size and forecast, by country
- 7.5.5.1. Brazil
- 7.5.5.1.1. Key market trends, growth factors and opportunities
- 7.5.5.1.2. Market size and forecast, by Type
- 7.5.5.1.3. Market size and forecast, by Storage Capacity
- 7.5.5.1.4. Market size and forecast, by Rated Capacity
- 7.5.5.2. Saudi Arabia
- 7.5.5.2.1. Key market trends, growth factors and opportunities
- 7.5.5.2.2. Market size and forecast, by Type
- 7.5.5.2.3. Market size and forecast, by Storage Capacity
- 7.5.5.2.4. Market size and forecast, by Rated Capacity
- 7.5.5.3. South Africa
- 7.5.5.3.1. Key market trends, growth factors and opportunities
- 7.5.5.3.2. Market size and forecast, by Type
- 7.5.5.3.3. Market size and forecast, by Storage Capacity
- 7.5.5.3.4. Market size and forecast, by Rated Capacity
- 7.5.5.4. Rest of LAMEA
- 7.5.5.4.1. Key market trends, growth factors and opportunities
- 7.5.5.4.2. Market size and forecast, by Type
- 7.5.5.4.3. Market size and forecast, by Storage Capacity
- 7.5.5.4.4. Market size and forecast, by Rated Capacity
CHAPTER 8: COMPETITIVE LANDSCAPE
- 8.1. Introduction
- 8.2. Top winning strategies
- 8.3. Product Mapping of Top 10 Player
- 8.4. Competitive Dashboard
- 8.5. Competitive Heatmap
- 8.6. Top player positioning, 2022
CHAPTER 9: COMPANY PROFILES
- 9.1. A.O. Smith Corporation
- 9.1.1. Company overview
- 9.1.2. Key Executives
- 9.1.3. Company snapshot
- 9.1.4. Operating business segments
- 9.1.5. Product portfolio
- 9.1.6. Business performance
- 9.2. Danfoss A/S
- 9.2.1. Company overview
- 9.2.2. Key Executives
- 9.2.3. Company snapshot
- 9.2.4. Operating business segments
- 9.2.5. Product portfolio
- 9.2.6. Business performance
- 9.3. Mitsubishi Electric Corporation
- 9.3.1. Company overview
- 9.3.2. Key Executives
- 9.3.3. Company snapshot
- 9.3.4. Operating business segments
- 9.3.5. Product portfolio
- 9.3.6. Business performance
- 9.4. STIEBEL ELTRON GmbH and Co. KG
- 9.4.1. Company overview
- 9.4.2. Key Executives
- 9.4.3. Company snapshot
- 9.4.4. Operating business segments
- 9.4.5. Product portfolio
- 9.5. Robert Bosch GmbH
- 9.5.1. Company overview
- 9.5.2. Key Executives
- 9.5.3. Company snapshot
- 9.5.4. Operating business segments
- 9.5.5. Product portfolio
- 9.5.6. Business performance
- 9.6. Rheem Manufacturing Company
- 9.6.1. Company overview
- 9.6.2. Key Executives
- 9.6.3. Company snapshot
- 9.6.4. Operating business segments
- 9.6.5. Product portfolio
- 9.7. Bajaj Electricals Ltd
- 9.7.1. Company overview
- 9.7.2. Key Executives
- 9.7.3. Company snapshot
- 9.7.4. Operating business segments
- 9.7.5. Product portfolio
- 9.7.6. Business performance
- 9.8. Bradford White Corporation
- 9.8.1. Company overview
- 9.8.2. Key Executives
- 9.8.3. Company snapshot
- 9.8.4. Operating business segments
- 9.8.5. Product portfolio
- 9.9. NIBE Industrier AB
- 9.9.1. Company overview
- 9.9.2. Key Executives
- 9.9.3. Company snapshot
- 9.9.4. Operating business segments
- 9.9.5. Product portfolio
- 9.9.6. Business performance
- 9.10. Carrier Global Corporation
- 9.10.1. Company overview
- 9.10.2. Key Executives
- 9.10.3. Company snapshot
- 9.10.4. Operating business segments
- 9.10.5. Product portfolio
- 9.10.6. Business performance
LIST OF TABLES
- TABLE 01. GLOBAL COMMERCIAL WATER HEATER MARKET, BY TYPE, 2022-2032 ($MILLION)
- TABLE 02. COMMERCIAL WATER HEATER MARKET FOR ELECTRIC, BY REGION, 2022-2032 ($MILLION)
- TABLE 03. COMMERCIAL WATER HEATER MARKET FOR GAS, BY REGION, 2022-2032 ($MILLION)
- TABLE 04. COMMERCIAL WATER HEATER MARKET FOR OIL, BY REGION, 2022-2032 ($MILLION)
- TABLE 05. COMMERCIAL WATER HEATER MARKET FOR SOLAR, BY REGION, 2022-2032 ($MILLION)
- TABLE 06. COMMERCIAL WATER HEATER MARKET FOR HYBRID, BY REGION, 2022-2032 ($MILLION)
- TABLE 07. COMMERCIAL WATER HEATER MARKET FOR OTHERS, BY REGION, 2022-2032 ($MILLION)
- TABLE 08. GLOBAL COMMERCIAL WATER HEATER MARKET, BY STORAGE CAPACITY, 2022-2032 ($MILLION)
- TABLE 09. COMMERCIAL WATER HEATER MARKET FOR BELOW 500 LITERS, BY REGION, 2022-2032 ($MILLION)
- TABLE 10. COMMERCIAL WATER HEATER MARKET FOR 500-1000 LITERS, BY REGION, 2022-2032 ($MILLION)
- TABLE 11. COMMERCIAL WATER HEATER MARKET FOR 1000-3000 LITERS, BY REGION, 2022-2032 ($MILLION)
- TABLE 12. COMMERCIAL WATER HEATER MARKET FOR 3000-4000 LITERS, BY REGION, 2022-2032 ($MILLION)
- TABLE 13. COMMERCIAL WATER HEATER MARKET FOR 4000 AND ABOVE, BY REGION, 2022-2032 ($MILLION)
- TABLE 14. GLOBAL COMMERCIAL WATER HEATER MARKET, BY RATED CAPACITY, 2022-2032 ($MILLION)
- TABLE 15. COMMERCIAL WATER HEATER MARKET FOR 0-10 KW, BY REGION, 2022-2032 ($MILLION)
- TABLE 16. COMMERCIAL WATER HEATER MARKET FOR 10-50 KW, BY REGION, 2022-2032 ($MILLION)
- TABLE 17. COMMERCIAL WATER HEATER MARKET FOR 50-100 KW, BY REGION, 2022-2032 ($MILLION)
- TABLE 18. COMMERCIAL WATER HEATER MARKET FOR ABOVE 100 KW, BY REGION, 2022-2032 ($MILLION)
- TABLE 19. COMMERCIAL WATER HEATER MARKET, BY REGION, 2022-2032 ($MILLION)
- TABLE 20. NORTH AMERICA COMMERCIAL WATER HEATER MARKET, BY TYPE, 2022-2032 ($MILLION)
- TABLE 21. NORTH AMERICA COMMERCIAL WATER HEATER MARKET, BY STORAGE CAPACITY, 2022-2032 ($MILLION)
- TABLE 22. NORTH AMERICA COMMERCIAL WATER HEATER MARKET, BY RATED CAPACITY, 2022-2032 ($MILLION)
- TABLE 23. NORTH AMERICA COMMERCIAL WATER HEATER MARKET, BY COUNTRY, 2022-2032 ($MILLION)
- TABLE 24. U.S. COMMERCIAL WATER HEATER MARKET, BY TYPE, 2022-2032 ($MILLION)
- TABLE 25. U.S. COMMERCIAL WATER HEATER MARKET, BY STORAGE CAPACITY, 2022-2032 ($MILLION)
- TABLE 26. U.S. COMMERCIAL WATER HEATER MARKET, BY RATED CAPACITY, 2022-2032 ($MILLION)
- TABLE 27. CANADA COMMERCIAL WATER HEATER MARKET, BY TYPE, 2022-2032 ($MILLION)
- TABLE 28. CANADA COMMERCIAL WATER HEATER MARKET, BY STORAGE CAPACITY, 2022-2032 ($MILLION)
- TABLE 29. CANADA COMMERCIAL WATER HEATER MARKET, BY RATED CAPACITY, 2022-2032 ($MILLION)
- TABLE 30. MEXICO COMMERCIAL WATER HEATER MARKET, BY TYPE, 2022-2032 ($MILLION)
- TABLE 31. MEXICO COMMERCIAL WATER HEATER MARKET, BY STORAGE CAPACITY, 2022-2032 ($MILLION)
- TABLE 32. MEXICO COMMERCIAL WATER HEATER MARKET, BY RATED CAPACITY, 2022-2032 ($MILLION)
- TABLE 33. EUROPE COMMERCIAL WATER HEATER MARKET, BY TYPE, 2022-2032 ($MILLION)
- TABLE 34. EUROPE COMMERCIAL WATER HEATER MARKET, BY STORAGE CAPACITY, 2022-2032 ($MILLION)
- TABLE 35. EUROPE COMMERCIAL WATER HEATER MARKET, BY RATED CAPACITY, 2022-2032 ($MILLION)
- TABLE 36. EUROPE COMMERCIAL WATER HEATER MARKET, BY COUNTRY, 2022-2032 ($MILLION)
- TABLE 37. GERMANY COMMERCIAL WATER HEATER MARKET, BY TYPE, 2022-2032 ($MILLION)
- TABLE 38. GERMANY COMMERCIAL WATER HEATER MARKET, BY STORAGE CAPACITY, 2022-2032 ($MILLION)
- TABLE 39. GERMANY COMMERCIAL WATER HEATER MARKET, BY RATED CAPACITY, 2022-2032 ($MILLION)
- TABLE 40. UK COMMERCIAL WATER HEATER MARKET, BY TYPE, 2022-2032 ($MILLION)
- TABLE 41. UK COMMERCIAL WATER HEATER MARKET, BY STORAGE CAPACITY, 2022-2032 ($MILLION)
- TABLE 42. UK COMMERCIAL WATER HEATER MARKET, BY RATED CAPACITY, 2022-2032 ($MILLION)
- TABLE 43. FRANCE COMMERCIAL WATER HEATER MARKET, BY TYPE, 2022-2032 ($MILLION)
- TABLE 44. FRANCE COMMERCIAL WATER HEATER MARKET, BY STORAGE CAPACITY, 2022-2032 ($MILLION)
- TABLE 45. FRANCE COMMERCIAL WATER HEATER MARKET, BY RATED CAPACITY, 2022-2032 ($MILLION)
- TABLE 46. ITALY COMMERCIAL WATER HEATER MARKET, BY TYPE, 2022-2032 ($MILLION)
- TABLE 47. ITALY COMMERCIAL WATER HEATER MARKET, BY STORAGE CAPACITY, 2022-2032 ($MILLION)
- TABLE 48. ITALY COMMERCIAL WATER HEATER MARKET, BY RATED CAPACITY, 2022-2032 ($MILLION)
- TABLE 49. SPAIN COMMERCIAL WATER HEATER MARKET, BY TYPE, 2022-2032 ($MILLION)
- TABLE 50. SPAIN COMMERCIAL WATER HEATER MARKET, BY STORAGE CAPACITY, 2022-2032 ($MILLION)
- TABLE 51. SPAIN COMMERCIAL WATER HEATER MARKET, BY RATED CAPACITY, 2022-2032 ($MILLION)
- TABLE 52. REST OF EUROPE COMMERCIAL WATER HEATER MARKET, BY TYPE, 2022-2032 ($MILLION)
- TABLE 53. REST OF EUROPE COMMERCIAL WATER HEATER MARKET, BY STORAGE CAPACITY, 2022-2032 ($MILLION)
- TABLE 54. REST OF EUROPE COMMERCIAL WATER HEATER MARKET, BY RATED CAPACITY, 2022-2032 ($MILLION)
- TABLE 55. ASIA-PACIFIC COMMERCIAL WATER HEATER MARKET, BY TYPE, 2022-2032 ($MILLION)
- TABLE 56. ASIA-PACIFIC COMMERCIAL WATER HEATER MARKET, BY STORAGE CAPACITY, 2022-2032 ($MILLION)
- TABLE 57. ASIA-PACIFIC COMMERCIAL WATER HEATER MARKET, BY RATED CAPACITY, 2022-2032 ($MILLION)
- TABLE 58. ASIA-PACIFIC COMMERCIAL WATER HEATER MARKET, BY COUNTRY, 2022-2032 ($MILLION)
- TABLE 59. CHINA COMMERCIAL WATER HEATER MARKET, BY TYPE, 2022-2032 ($MILLION)
- TABLE 60. CHINA COMMERCIAL WATER HEATER MARKET, BY STORAGE CAPACITY, 2022-2032 ($MILLION)
- TABLE 61. CHINA COMMERCIAL WATER HEATER MARKET, BY RATED CAPACITY, 2022-2032 ($MILLION)
- TABLE 62. JAPAN COMMERCIAL WATER HEATER MARKET, BY TYPE, 2022-2032 ($MILLION)
- TABLE 63. JAPAN COMMERCIAL WATER HEATER MARKET, BY STORAGE CAPACITY, 2022-2032 ($MILLION)
- TABLE 64. JAPAN COMMERCIAL WATER HEATER MARKET, BY RATED CAPACITY, 2022-2032 ($MILLION)
- TABLE 65. INDIA COMMERCIAL WATER HEATER MARKET, BY TYPE, 2022-2032 ($MILLION)
- TABLE 66. INDIA COMMERCIAL WATER HEATER MARKET, BY STORAGE CAPACITY, 2022-2032 ($MILLION)
- TABLE 67. INDIA COMMERCIAL WATER HEATER MARKET, BY RATED CAPACITY, 2022-2032 ($MILLION)
- TABLE 68. SOUTH KOREA COMMERCIAL WATER HEATER MARKET, BY TYPE, 2022-2032 ($MILLION)
- TABLE 69. SOUTH KOREA COMMERCIAL WATER HEATER MARKET, BY STORAGE CAPACITY, 2022-2032 ($MILLION)
- TABLE 70. SOUTH KOREA COMMERCIAL WATER HEATER MARKET, BY RATED CAPACITY, 2022-2032 ($MILLION)
- TABLE 71. AUSTRALIA COMMERCIAL WATER HEATER MARKET, BY TYPE, 2022-2032 ($MILLION)
- TABLE 72. AUSTRALIA COMMERCIAL WATER HEATER MARKET, BY STORAGE CAPACITY, 2022-2032 ($MILLION)
- TABLE 73. AUSTRALIA COMMERCIAL WATER HEATER MARKET, BY RATED CAPACITY, 2022-2032 ($MILLION)
- TABLE 74. REST OF ASIA-PACIFIC COMMERCIAL WATER HEATER MARKET, BY TYPE, 2022-2032 ($MILLION)
- TABLE 75. REST OF ASIA-PACIFIC COMMERCIAL WATER HEATER MARKET, BY STORAGE CAPACITY, 2022-2032 ($MILLION)
- TABLE 76. REST OF ASIA-PACIFIC COMMERCIAL WATER HEATER MARKET, BY RATED CAPACITY, 2022-2032 ($MILLION)
- TABLE 77. LAMEA COMMERCIAL WATER HEATER MARKET, BY TYPE, 2022-2032 ($MILLION)
- TABLE 78. LAMEA COMMERCIAL WATER HEATER MARKET, BY STORAGE CAPACITY, 2022-2032 ($MILLION)
- TABLE 79. LAMEA COMMERCIAL WATER HEATER MARKET, BY RATED CAPACITY, 2022-2032 ($MILLION)
- TABLE 80. LAMEA COMMERCIAL WATER HEATER MARKET, BY COUNTRY, 2022-2032 ($MILLION)
- TABLE 81. BRAZIL COMMERCIAL WATER HEATER MARKET, BY TYPE, 2022-2032 ($MILLION)
- TABLE 82. BRAZIL COMMERCIAL WATER HEATER MARKET, BY STORAGE CAPACITY, 2022-2032 ($MILLION)
- TABLE 83. BRAZIL COMMERCIAL WATER HEATER MARKET, BY RATED CAPACITY, 2022-2032 ($MILLION)
- TABLE 84. SAUDI ARABIA COMMERCIAL WATER HEATER MARKET, BY TYPE, 2022-2032 ($MILLION)
- TABLE 85. SAUDI ARABIA COMMERCIAL WATER HEATER MARKET, BY STORAGE CAPACITY, 2022-2032 ($MILLION)
- TABLE 86. SAUDI ARABIA COMMERCIAL WATER HEATER MARKET, BY RATED CAPACITY, 2022-2032 ($MILLION)
- TABLE 87. SOUTH AFRICA COMMERCIAL WATER HEATER MARKET, BY TYPE, 2022-2032 ($MILLION)
- TABLE 88. SOUTH AFRICA COMMERCIAL WATER HEATER MARKET, BY STORAGE CAPACITY, 2022-2032 ($MILLION)
- TABLE 89. SOUTH AFRICA COMMERCIAL WATER HEATER MARKET, BY RATED CAPACITY, 2022-2032 ($MILLION)
- TABLE 90. REST OF LAMEA COMMERCIAL WATER HEATER MARKET, BY TYPE, 2022-2032 ($MILLION)
- TABLE 91. REST OF LAMEA COMMERCIAL WATER HEATER MARKET, BY STORAGE CAPACITY, 2022-2032 ($MILLION)
- TABLE 92. REST OF LAMEA COMMERCIAL WATER HEATER MARKET, BY RATED CAPACITY, 2022-2032 ($MILLION)
- TABLE 93. A.O. SMITH CORPORATION: KEY EXECUTIVES
- TABLE 94. A.O. SMITH CORPORATION: COMPANY SNAPSHOT
- TABLE 95. A.O. SMITH CORPORATION: PRODUCT SEGMENTS
- TABLE 96. A.O. SMITH CORPORATION: PRODUCT PORTFOLIO
- TABLE 97. DANFOSS A/S: KEY EXECUTIVES
- TABLE 98. DANFOSS A/S: COMPANY SNAPSHOT
- TABLE 99. DANFOSS A/S: PRODUCT SEGMENTS
- TABLE 100. DANFOSS A/S: PRODUCT PORTFOLIO
- TABLE 101. MITSUBISHI ELECTRIC CORPORATION: KEY EXECUTIVES
- TABLE 102. MITSUBISHI ELECTRIC CORPORATION: COMPANY SNAPSHOT
- TABLE 103. MITSUBISHI ELECTRIC CORPORATION: PRODUCT SEGMENTS
- TABLE 104. MITSUBISHI ELECTRIC CORPORATION: PRODUCT PORTFOLIO
- TABLE 105. STIEBEL ELTRON GMBH AND CO. KG: KEY EXECUTIVES
- TABLE 106. STIEBEL ELTRON GMBH AND CO. KG: COMPANY SNAPSHOT
- TABLE 107. STIEBEL ELTRON GMBH AND CO. KG: PRODUCT SEGMENTS
- TABLE 108. STIEBEL ELTRON GMBH AND CO. KG: PRODUCT PORTFOLIO
- TABLE 109. ROBERT BOSCH GMBH: KEY EXECUTIVES
- TABLE 110. ROBERT BOSCH GMBH: COMPANY SNAPSHOT
- TABLE 111. ROBERT BOSCH GMBH: PRODUCT SEGMENTS
- TABLE 112. ROBERT BOSCH GMBH: PRODUCT PORTFOLIO
- TABLE 113. RHEEM MANUFACTURING COMPANY: KEY EXECUTIVES
- TABLE 114. RHEEM MANUFACTURING COMPANY: COMPANY SNAPSHOT
- TABLE 115. RHEEM MANUFACTURING COMPANY: PRODUCT SEGMENTS
- TABLE 116. RHEEM MANUFACTURING COMPANY: PRODUCT PORTFOLIO
- TABLE 117. BAJAJ ELECTRICALS LTD: KEY EXECUTIVES
- TABLE 118. BAJAJ ELECTRICALS LTD: COMPANY SNAPSHOT
- TABLE 119. BAJAJ ELECTRICALS LTD: PRODUCT SEGMENTS
- TABLE 120. BAJAJ ELECTRICALS LTD: PRODUCT PORTFOLIO
- TABLE 121. BRADFORD WHITE CORPORATION: KEY EXECUTIVES
- TABLE 122. BRADFORD WHITE CORPORATION: COMPANY SNAPSHOT
- TABLE 123. BRADFORD WHITE CORPORATION: PRODUCT SEGMENTS
- TABLE 124. BRADFORD WHITE CORPORATION: PRODUCT PORTFOLIO
- TABLE 125. NIBE INDUSTRIER AB: KEY EXECUTIVES
- TABLE 126. NIBE INDUSTRIER AB: COMPANY SNAPSHOT
- TABLE 127. NIBE INDUSTRIER AB: PRODUCT SEGMENTS
- TABLE 128. NIBE INDUSTRIER AB: PRODUCT PORTFOLIO
- TABLE 129. CARRIER GLOBAL CORPORATION: KEY EXECUTIVES
- TABLE 130. CARRIER GLOBAL CORPORATION: COMPANY SNAPSHOT
- TABLE 131. CARRIER GLOBAL CORPORATION: PRODUCT SEGMENTS
- TABLE 132. CARRIER GLOBAL CORPORATION: PRODUCT PORTFOLIO
LIST OF FIGURES
- FIGURE 01. COMMERCIAL WATER HEATER MARKET, 2022-2032
- FIGURE 02. SEGMENTATION OF COMMERCIAL WATER HEATER MARKET, 2022-2032
- FIGURE 03. TOP INVESTMENT POCKETS IN COMMERCIAL WATER HEATER MARKET (2023-2032)
- FIGURE 04. LOW BARGAINING POWER OF SUPPLIERS
- FIGURE 05. LOW BARGAINING POWER OF BUYERS
- FIGURE 06. LOW THREAT OF SUBSTITUTES
- FIGURE 07. LOW THREAT OF NEW ENTRANTS
- FIGURE 08. LOW INTENSITY OF RIVALRY
- FIGURE 09. DRIVERS, RESTRAINTS AND OPPORTUNITIES: GLOBALCOMMERCIAL WATER HEATER MARKET
- FIGURE 10. PATENT ANALYSIS BY COMPANY
- FIGURE 11. PATENT ANALYSIS BY COUNTRY
- FIGURE 12. VALUE CHAIN ANALYSIS: COMMERCIAL WATER HEATER MARKET
- FIGURE 13. COMMERCIAL WATER HEATER MARKET, BY TYPE, 2022(%)
- FIGURE 14. COMPARATIVE SHARE ANALYSIS OF COMMERCIAL WATER HEATER MARKET FOR ELECTRIC, BY COUNTRY 2022 AND 2032(%)
- FIGURE 15. COMPARATIVE SHARE ANALYSIS OF COMMERCIAL WATER HEATER MARKET FOR GAS, BY COUNTRY 2022 AND 2032(%)
- FIGURE 16. COMPARATIVE SHARE ANALYSIS OF COMMERCIAL WATER HEATER MARKET FOR OIL, BY COUNTRY 2022 AND 2032(%)
- FIGURE 17. COMPARATIVE SHARE ANALYSIS OF COMMERCIAL WATER HEATER MARKET FOR SOLAR, BY COUNTRY 2022 AND 2032(%)
- FIGURE 18. COMPARATIVE SHARE ANALYSIS OF COMMERCIAL WATER HEATER MARKET FOR HYBRID, BY COUNTRY 2022 AND 2032(%)
- FIGURE 19. COMPARATIVE SHARE ANALYSIS OF COMMERCIAL WATER HEATER MARKET FOR OTHERS, BY COUNTRY 2022 AND 2032(%)
- FIGURE 20. COMMERCIAL WATER HEATER MARKET, BY STORAGE CAPACITY, 2022(%)
- FIGURE 21. COMPARATIVE SHARE ANALYSIS OF COMMERCIAL WATER HEATER MARKET FOR BELOW 500 LITERS, BY COUNTRY 2022 AND 2032(%)
- FIGURE 22. COMPARATIVE SHARE ANALYSIS OF COMMERCIAL WATER HEATER MARKET FOR 500-1000 LITERS, BY COUNTRY 2022 AND 2032(%)
- FIGURE 23. COMPARATIVE SHARE ANALYSIS OF COMMERCIAL WATER HEATER MARKET FOR 1000-3000 LITERS, BY COUNTRY 2022 AND 2032(%)
- FIGURE 24. COMPARATIVE SHARE ANALYSIS OF COMMERCIAL WATER HEATER MARKET FOR 3000-4000 LITERS, BY COUNTRY 2022 AND 2032(%)
- FIGURE 25. COMPARATIVE SHARE ANALYSIS OF COMMERCIAL WATER HEATER MARKET FOR 4000 AND ABOVE, BY COUNTRY 2022 AND 2032(%)
- FIGURE 26. COMMERCIAL WATER HEATER MARKET, BY RATED CAPACITY, 2022(%)
- FIGURE 27. COMPARATIVE SHARE ANALYSIS OF COMMERCIAL WATER HEATER MARKET FOR 0-10 KW, BY COUNTRY 2022 AND 2032(%)
- FIGURE 28. COMPARATIVE SHARE ANALYSIS OF COMMERCIAL WATER HEATER MARKET FOR 10-50 KW, BY COUNTRY 2022 AND 2032(%)
- FIGURE 29. COMPARATIVE SHARE ANALYSIS OF COMMERCIAL WATER HEATER MARKET FOR 50-100 KW, BY COUNTRY 2022 AND 2032(%)
- FIGURE 30. COMPARATIVE SHARE ANALYSIS OF COMMERCIAL WATER HEATER MARKET FOR ABOVE 100 KW, BY COUNTRY 2022 AND 2032(%)
- FIGURE 31. COMMERCIAL WATER HEATER MARKET BY REGION, 2022
- FIGURE 32. U.S. COMMERCIAL WATER HEATER MARKET, 2022-2032 ($MILLION)
- FIGURE 33. CANADA COMMERCIAL WATER HEATER MARKET, 2022-2032 ($MILLION)
- FIGURE 34. MEXICO COMMERCIAL WATER HEATER MARKET, 2022-2032 ($MILLION)
- FIGURE 35. GERMANY COMMERCIAL WATER HEATER MARKET, 2022-2032 ($MILLION)
- FIGURE 36. UK COMMERCIAL WATER HEATER MARKET, 2022-2032 ($MILLION)
- FIGURE 37. FRANCE COMMERCIAL WATER HEATER MARKET, 2022-2032 ($MILLION)
- FIGURE 38. ITALY COMMERCIAL WATER HEATER MARKET, 2022-2032 ($MILLION)
- FIGURE 39. SPAIN COMMERCIAL WATER HEATER MARKET, 2022-2032 ($MILLION)
- FIGURE 40. REST OF EUROPE COMMERCIAL WATER HEATER MARKET, 2022-2032 ($MILLION)
- FIGURE 41. CHINA COMMERCIAL WATER HEATER MARKET, 2022-2032 ($MILLION)
- FIGURE 42. JAPAN COMMERCIAL WATER HEATER MARKET, 2022-2032 ($MILLION)
- FIGURE 43. INDIA COMMERCIAL WATER HEATER MARKET, 2022-2032 ($MILLION)
- FIGURE 44. SOUTH KOREA COMMERCIAL WATER HEATER MARKET, 2022-2032 ($MILLION)
- FIGURE 45. AUSTRALIA COMMERCIAL WATER HEATER MARKET, 2022-2032 ($MILLION)
- FIGURE 46. REST OF ASIA-PACIFIC COMMERCIAL WATER HEATER MARKET, 2022-2032 ($MILLION)
- FIGURE 47. BRAZIL COMMERCIAL WATER HEATER MARKET, 2022-2032 ($MILLION)
- FIGURE 48. SAUDI ARABIA COMMERCIAL WATER HEATER MARKET, 2022-2032 ($MILLION)
- FIGURE 49. SOUTH AFRICA COMMERCIAL WATER HEATER MARKET, 2022-2032 ($MILLION)
- FIGURE 50. REST OF LAMEA COMMERCIAL WATER HEATER MARKET, 2022-2032 ($MILLION)
- FIGURE 51. TOP WINNING STRATEGIES, BY YEAR
- FIGURE 52. TOP WINNING STRATEGIES, BY DEVELOPMENT
- FIGURE 53. TOP WINNING STRATEGIES, BY COMPANY
- FIGURE 54. PRODUCT MAPPING OF TOP 10 PLAYERS
- FIGURE 55. COMPETITIVE DASHBOARD
- FIGURE 56. COMPETITIVE HEATMAP: COMMERCIAL WATER HEATER MARKET
- FIGURE 57. TOP PLAYER POSITIONING, 2022
- FIGURE 58. A.O. SMITH CORPORATION: NET SALES, 2020-2022 ($MILLION)
- FIGURE 59. A.O. SMITH CORPORATION: RESEARCH & DEVELOPMENT EXPENDITURE, 2020-2022 ($MILLION)
- FIGURE 60. A.O. SMITH CORPORATION: REVENUE SHARE BY SEGMENT, 2021 (%)
- FIGURE 61. A.O. SMITH CORPORATION: REVENUE SHARE BY REGION, 2022 (%)
- FIGURE 62. DANFOSS A/S: NET REVENUE, 2020-2022 ($MILLION)
- FIGURE 63. DANFOSS A/S: RESEARCH & DEVELOPMENT EXPENDITURE, 2020-2022 ($MILLION)
- FIGURE 64. DANFOSS A/S: REVENUE SHARE BY SEGMENT, 2022 (%)
- FIGURE 65. DANFOSS A/S: REVENUE SHARE BY REGION, 2022 (%)
- FIGURE 66. MITSUBISHI ELECTRIC CORPORATION: NET REVENUE, 2020-2022 ($MILLION)
- FIGURE 67. MITSUBISHI ELECTRIC CORPORATION: RESEARCH & DEVELOPMENT EXPENDITURE, 2020-2022 ($MILLION)
- FIGURE 68. MITSUBISHI ELECTRIC CORPORATION: REVENUE SHARE BY SEGMENT, 2022 (%)
- FIGURE 69. MITSUBISHI ELECTRIC CORPORATION: REVENUE SHARE BY REGION, 2022 (%)
- FIGURE 70. ROBERT BOSCH GMBH: NET SALES, 2020-2022 ($MILLION)
- FIGURE 71. ROBERT BOSCH GMBH: REVENUE SHARE BY SEGMENT, 2022 (%)
- FIGURE 72. ROBERT BOSCH GMBH: REVENUE SHARE BY REGION, 2022 (%)
- FIGURE 73. BAJAJ ELECTRICALS LTD: NET REVENUE, 2019-2021 ($MILLION)
- FIGURE 74. BAJAJ ELECTRICALS LTD: REVENUE SHARE BY REGION, 2021 (%)
- FIGURE 75. NIBE INDUSTRIER AB: NET REVENUE, 2019-2021 ($MILLION)
- FIGURE 76. NIBE INDUSTRIER AB: REVENUE SHARE BY SEGMENT, 2021 (%)
- FIGURE 77. NIBE INDUSTRIER AB: REVENUE SHARE BY REGION, 2021 (%)
- FIGURE 78. CARRIER GLOBAL CORPORATION: NET REVENUE, 2019-2021 ($MILLION)
- FIGURE 79. CARRIER GLOBAL CORPORATION: RESEARCH & DEVELOPMENT EXPENDITURE, 2019-2021 ($MILLION)
- FIGURE 80. CARRIER GLOBAL CORPORATION: REVENUE SHARE BY SEGMENT, 2021 (%)
- FIGURE 81. CARRIER GLOBAL CORPORATION: REVENUE SHARE BY REGION, 2021 (%)

