
PUBLISHER: Allied Market Research | PRODUCT CODE: 1298433

PUBLISHER: Allied Market Research | PRODUCT CODE: 1298433
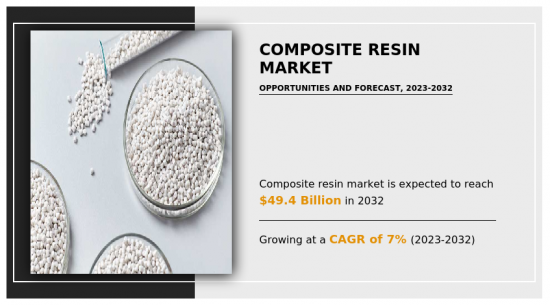
Composite Resin Market By Resin Type, By Manufacturing Process, By Application : Global Opportunity Analysis and Industry Forecast, 2023-2032
The global composite resin market was valued at $25.4 billion in 2022, and is projected to reach $49.4 billion by 2032, growing at a CAGR of 7% from 2023 to 2032.
Composites are a combination of fiber reinforcement and a resin matrix. The resin system holds everything together and transfers mechanical loads through the fibers to the rest of the structure. In addition to binding the composite structure together, it protects from impact, abrasion, corrosion, other environmental factors, and rough handling. Resin systems come in a variety of chemical families, each designed and designated to serve industries providing certain advantages like economic, structural performance, resistance to various factors, and legislation compliance. Only the most common resins of the thermoset family and the ones mostly used in composite construction are described below. These include polyester, vinyl ester, epoxy, and phenolic. Fibermax Composites carry only epoxy resin systems.
Thermoset resin is a type of polymer that undergoes a chemical reaction during the curing process to create a rigid, durable material that cannot be re-melted or re-shaped once cured. This process is irreversible, which means that the final shape and properties of the material are set. There are several types of thermoset resins, including epoxy, polyester, vinyl ester, phenolic, and urethane. These resins are used in a wide range of applications, including automotive and aerospace parts, electrical and electronic components, construction materials, and consumer goods. Epoxy resins are a common type of thermoset resins widely used in the manufacturing of composites. They are known for their excellent adhesion, high strength, and resistance to chemicals and heat.
Epoxy resins are often used in the construction of aircraft, boats, and wind turbine blades. Polyester resins are another type of thermoset resins often used in the production of fiberglass composites. They are known for their low cost and easy processability, making them a popular choice in the construction and marine industries. Thermoset resins are an important class of materials that offer a wide range of properties and applications. Their irreversible curing process makes them suitable for high-stress applications that require durability, strength, and resistance to heat and chemicals.
Thermoset resin is expected to experience significant growth in the coming years, driven by several factors. One of the main growth factors is the increase in demand for lightweight, high-performance materials in various industries, such as automotive, aerospace, and construction. Thermoset resins, with their high strength-to-weight ratio and resistance to heat and chemicals, are well-positioned to meet this demand. The growing trend toward sustainability and environmental responsibility is driving the demand for thermoset resins, as they are often used as a substitute for traditional materials that are less environment-friendly. For instance, thermoset resins can be used in the production of composite materials, which are lighter and more durable than traditional materials, resulting in lower fuel consumption and reduced emissions in the transportation industry.
In addition, the increase in demand for electrical and electronic components is driving the demand for thermoset resins, as they are widely used in the production of printed circuit boards, electronic encapsulants, and insulation materials. The Asia-Pacific region is expected to be a major market for thermoset resins, driven by rapid industrialization and infrastructure development in countries such as China and India. However, the thermoset resins market also faces several challenges, such as the high cost of raw materials and the stringent regulations regarding the use of hazardous chemicals in their production. Nevertheless, ongoing research and development efforts are aimed at overcoming these challenges and improving the performance and sustainability of thermoset resins.
The composite resins market is segmented on the basis of resin type, manufacturing process, application and region. By resin type, the market is bifurcated into thermosets and thermoplastics. By resin type, the market is categorized into layup, filament, winding, injection molding, pultrusion, compression molding, and resin transfer molding. By application, the market is fragmented into construction & infrastructure, transportation, electricals & electronics, pipes & tanks, wind energy, marine, aerospace & defense and others. By region, the market is analyzed across North America, Europe, Asia-Pacific, and LAMEA.
The major players operating in the industry include: Hexion Inc., SABIC, Celanese Corporation, Huntsman International LLC, Dow, Evonik Industries AG, Scott Bader Company Ltd., DSM, Allnex GmbH, and Sumitomo Bakelite Co., Ltd. Corp. These players have adopted product launch as their key strategy to increase their market shares.
IMPACT OF COVID-19 ON THE GLOBAL COMPOSITE RESIN MARKET
The COVID-19 outbreak has had a significant impact on the composite resins market, as it has affected the supply chain, production, and demand for these materials. The pandemic has disrupted global trade, causing supply chain disruptions, raw material shortages, and transportation delays, which have resulted in increased prices and reduced availability of composite resins.
The closure of manufacturing facilities and reduced demand for end-use products due to lockdowns and economic uncertainty have also affected the demand for composite resins. The construction, automotive, and aerospace industries, which are major end-users of composite resins, have been particularly affected by the pandemic, resulting in reduced demand for composite resins.
Key Benefits For Stakeholders
- This report provides a quantitative analysis of the market segments, current trends, estimations, and dynamics of the composite resin market analysis from 2022 to 2032 to identify the prevailing composite resin market opportunities.
- The market research is offered along with information related to key drivers, restraints, and opportunities.
- Porter's five forces analysis highlights the potency of buyers and suppliers to enable stakeholders make profit-oriented business decisions and strengthen their supplier-buyer network.
- In-depth analysis of the composite resin market segmentation assists to determine the prevailing market opportunities.
- Major countries in each region are mapped according to their revenue contribution to the global market.
- Market player positioning facilitates benchmarking and provides a clear understanding of the present position of the market players.
- The report includes the analysis of the regional as well as global composite resin market trends, key players, market segments, application areas, and market growth strategies.
Key Market Segments
By Resin Type
- Thermoset Resin
- Thermoplastic Resin
By Manufacturing Process
- Layup
- Filament Winding
- Injection Molding
- Pultrusion
- Compression Molding
- Resin Transfer Molding
By Application
- Marine
- Aerospace and Defense
- Other
- Construction and Infrastructure
- Automotive and Transportation
- Electricals and Electronics
- Pipes and Tanks
- Wind Energy
By Region
- North America
- U.S.
- Canada
- Mexico
- Europe
- Germany
- France
- UK
- Spain
- Italy
- Rest of Europe
- Asia-Pacific
- China
- India
- Japan
- South Korea
- Australia
- Rest of Asia-Pacific
- LAMEA
- Brazil
- Saudi Arabia
- South Africa
- Rest of LAMEA
Key Market Players:
- SABIC
- Huntsman International LLC
- Evonik Industries AG
- DSM
- Allnex GmbH
- Hexion Inc.
- Celanese Corporation
- Dow
- Scott Bader Company Ltd.
- Sumitomo Bakelite Co., Ltd.
TABLE OF CONTENTS
CHAPTER 1: INTRODUCTION
- 1.1. Report description
- 1.2. Key market segments
- 1.3. Key benefits to the stakeholders
- 1.4. Research Methodology
- 1.4.1. Primary research
- 1.4.2. Secondary research
- 1.4.3. Analyst tools and models
CHAPTER 2: EXECUTIVE SUMMARY
- 2.1. CXO Perspective
CHAPTER 3: MARKET OVERVIEW
- 3.1. Market definition and scope
- 3.2. Key findings
- 3.2.1. Top impacting factors
- 3.2.2. Top investment pockets
- 3.3. Porter's five forces analysis
- 3.3.1. Bargaining power of suppliers
- 3.3.2. Bargaining power of buyers
- 3.3.3. Threat of substitutes
- 3.3.4. Threat of new entrants
- 3.3.5. Intensity of rivalry
- 3.4. Market dynamics
- 3.4.1. Drivers
- 3.4.1.1. Increase in Demand for Composite Resins in Several Industries
- 3.4.1.2. Developments in the Transportation Industry
- 3.4.1. Drivers
- 3.4.2. Restraints
- 3.4.2.1. High Production Cost of Composite Resins
- 3.4.3. Opportunities
- 3.4.3.1. Rise in Use of Composite Resins in the Medical Sector
- 3.5. COVID-19 Impact Analysis on the market
- 3.6. Key Regulation Analysis
- 3.7. Patent Landscape
- 3.8. Pricing Analysis
- 3.9. Value Chain Analysis
CHAPTER 4: COMPOSITE RESIN MARKET, BY RESIN TYPE
- 4.1. Overview
- 4.1.1. Market size and forecast
- 4.2. Thermoset Resin
- 4.2.1. Key market trends, growth factors and opportunities
- 4.2.2. Market size and forecast, by region
- 4.2.3. Market share analysis by country
- 4.3. Thermoplastic Resin
- 4.3.1. Key market trends, growth factors and opportunities
- 4.3.2. Market size and forecast, by region
- 4.3.3. Market share analysis by country
CHAPTER 5: COMPOSITE RESIN MARKET, BY MANUFACTURING PROCESS
- 5.1. Overview
- 5.1.1. Market size and forecast
- 5.2. Layup
- 5.2.1. Key market trends, growth factors and opportunities
- 5.2.2. Market size and forecast, by region
- 5.2.3. Market share analysis by country
- 5.3. Filament Winding
- 5.3.1. Key market trends, growth factors and opportunities
- 5.3.2. Market size and forecast, by region
- 5.3.3. Market share analysis by country
- 5.4. Injection Molding
- 5.4.1. Key market trends, growth factors and opportunities
- 5.4.2. Market size and forecast, by region
- 5.4.3. Market share analysis by country
- 5.5. Pultrusion
- 5.5.1. Key market trends, growth factors and opportunities
- 5.5.2. Market size and forecast, by region
- 5.5.3. Market share analysis by country
- 5.6. Compression Molding
- 5.6.1. Key market trends, growth factors and opportunities
- 5.6.2. Market size and forecast, by region
- 5.6.3. Market share analysis by country
- 5.7. Resin Transfer Molding
- 5.7.1. Key market trends, growth factors and opportunities
- 5.7.2. Market size and forecast, by region
- 5.7.3. Market share analysis by country
CHAPTER 6: COMPOSITE RESIN MARKET, BY APPLICATION
- 6.1. Overview
- 6.1.1. Market size and forecast
- 6.2. Construction and Infrastructure
- 6.2.1. Key market trends, growth factors and opportunities
- 6.2.2. Market size and forecast, by region
- 6.2.3. Market share analysis by country
- 6.3. Automotive and Transportation
- 6.3.1. Key market trends, growth factors and opportunities
- 6.3.2. Market size and forecast, by region
- 6.3.3. Market share analysis by country
- 6.4. Electricals and Electronics
- 6.4.1. Key market trends, growth factors and opportunities
- 6.4.2. Market size and forecast, by region
- 6.4.3. Market share analysis by country
- 6.5. Pipes and Tanks
- 6.5.1. Key market trends, growth factors and opportunities
- 6.5.2. Market size and forecast, by region
- 6.5.3. Market share analysis by country
- 6.6. Wind Energy
- 6.6.1. Key market trends, growth factors and opportunities
- 6.6.2. Market size and forecast, by region
- 6.6.3. Market share analysis by country
- 6.7. Marine
- 6.7.1. Key market trends, growth factors and opportunities
- 6.7.2. Market size and forecast, by region
- 6.7.3. Market share analysis by country
- 6.8. Aerospace and Defense
- 6.8.1. Key market trends, growth factors and opportunities
- 6.8.2. Market size and forecast, by region
- 6.8.3. Market share analysis by country
- 6.9. Other
- 6.9.1. Key market trends, growth factors and opportunities
- 6.9.2. Market size and forecast, by region
- 6.9.3. Market share analysis by country
CHAPTER 7: COMPOSITE RESIN MARKET, BY REGION
- 7.1. Overview
- 7.1.1. Market size and forecast By Region
- 7.2. North America
- 7.2.1. Key trends and opportunities
- 7.2.2. Market size and forecast, by Resin Type
- 7.2.3. Market size and forecast, by Manufacturing Process
- 7.2.4. Market size and forecast, by Application
- 7.2.5. Market size and forecast, by country
- 7.2.5.1. U.S.
- 7.2.5.1.1. Key market trends, growth factors and opportunities
- 7.2.5.1.2. Market size and forecast, by Resin Type
- 7.2.5.1.3. Market size and forecast, by Manufacturing Process
- 7.2.5.1.4. Market size and forecast, by Application
- 7.2.5.2. Canada
- 7.2.5.2.1. Key market trends, growth factors and opportunities
- 7.2.5.2.2. Market size and forecast, by Resin Type
- 7.2.5.2.3. Market size and forecast, by Manufacturing Process
- 7.2.5.2.4. Market size and forecast, by Application
- 7.2.5.3. Mexico
- 7.2.5.3.1. Key market trends, growth factors and opportunities
- 7.2.5.3.2. Market size and forecast, by Resin Type
- 7.2.5.3.3. Market size and forecast, by Manufacturing Process
- 7.2.5.3.4. Market size and forecast, by Application
- 7.3. Europe
- 7.3.1. Key trends and opportunities
- 7.3.2. Market size and forecast, by Resin Type
- 7.3.3. Market size and forecast, by Manufacturing Process
- 7.3.4. Market size and forecast, by Application
- 7.3.5. Market size and forecast, by country
- 7.3.5.1. Germany
- 7.3.5.1.1. Key market trends, growth factors and opportunities
- 7.3.5.1.2. Market size and forecast, by Resin Type
- 7.3.5.1.3. Market size and forecast, by Manufacturing Process
- 7.3.5.1.4. Market size and forecast, by Application
- 7.3.5.2. France
- 7.3.5.2.1. Key market trends, growth factors and opportunities
- 7.3.5.2.2. Market size and forecast, by Resin Type
- 7.3.5.2.3. Market size and forecast, by Manufacturing Process
- 7.3.5.2.4. Market size and forecast, by Application
- 7.3.5.3. UK
- 7.3.5.3.1. Key market trends, growth factors and opportunities
- 7.3.5.3.2. Market size and forecast, by Resin Type
- 7.3.5.3.3. Market size and forecast, by Manufacturing Process
- 7.3.5.3.4. Market size and forecast, by Application
- 7.3.5.4. Spain
- 7.3.5.4.1. Key market trends, growth factors and opportunities
- 7.3.5.4.2. Market size and forecast, by Resin Type
- 7.3.5.4.3. Market size and forecast, by Manufacturing Process
- 7.3.5.4.4. Market size and forecast, by Application
- 7.3.5.5. Italy
- 7.3.5.5.1. Key market trends, growth factors and opportunities
- 7.3.5.5.2. Market size and forecast, by Resin Type
- 7.3.5.5.3. Market size and forecast, by Manufacturing Process
- 7.3.5.5.4. Market size and forecast, by Application
- 7.3.5.6. Rest of Europe
- 7.3.5.6.1. Key market trends, growth factors and opportunities
- 7.3.5.6.2. Market size and forecast, by Resin Type
- 7.3.5.6.3. Market size and forecast, by Manufacturing Process
- 7.3.5.6.4. Market size and forecast, by Application
- 7.4. Asia-Pacific
- 7.4.1. Key trends and opportunities
- 7.4.2. Market size and forecast, by Resin Type
- 7.4.3. Market size and forecast, by Manufacturing Process
- 7.4.4. Market size and forecast, by Application
- 7.4.5. Market size and forecast, by country
- 7.4.5.1. China
- 7.4.5.1.1. Key market trends, growth factors and opportunities
- 7.4.5.1.2. Market size and forecast, by Resin Type
- 7.4.5.1.3. Market size and forecast, by Manufacturing Process
- 7.4.5.1.4. Market size and forecast, by Application
- 7.4.5.2. India
- 7.4.5.2.1. Key market trends, growth factors and opportunities
- 7.4.5.2.2. Market size and forecast, by Resin Type
- 7.4.5.2.3. Market size and forecast, by Manufacturing Process
- 7.4.5.2.4. Market size and forecast, by Application
- 7.4.5.3. Japan
- 7.4.5.3.1. Key market trends, growth factors and opportunities
- 7.4.5.3.2. Market size and forecast, by Resin Type
- 7.4.5.3.3. Market size and forecast, by Manufacturing Process
- 7.4.5.3.4. Market size and forecast, by Application
- 7.4.5.4. South Korea
- 7.4.5.4.1. Key market trends, growth factors and opportunities
- 7.4.5.4.2. Market size and forecast, by Resin Type
- 7.4.5.4.3. Market size and forecast, by Manufacturing Process
- 7.4.5.4.4. Market size and forecast, by Application
- 7.4.5.5. Australia
- 7.4.5.5.1. Key market trends, growth factors and opportunities
- 7.4.5.5.2. Market size and forecast, by Resin Type
- 7.4.5.5.3. Market size and forecast, by Manufacturing Process
- 7.4.5.5.4. Market size and forecast, by Application
- 7.4.5.6. Rest of Asia-Pacific
- 7.4.5.6.1. Key market trends, growth factors and opportunities
- 7.4.5.6.2. Market size and forecast, by Resin Type
- 7.4.5.6.3. Market size and forecast, by Manufacturing Process
- 7.4.5.6.4. Market size and forecast, by Application
- 7.5. LAMEA
- 7.5.1. Key trends and opportunities
- 7.5.2. Market size and forecast, by Resin Type
- 7.5.3. Market size and forecast, by Manufacturing Process
- 7.5.4. Market size and forecast, by Application
- 7.5.5. Market size and forecast, by country
- 7.5.5.1. Brazil
- 7.5.5.1.1. Key market trends, growth factors and opportunities
- 7.5.5.1.2. Market size and forecast, by Resin Type
- 7.5.5.1.3. Market size and forecast, by Manufacturing Process
- 7.5.5.1.4. Market size and forecast, by Application
- 7.5.5.2. Saudi Arabia
- 7.5.5.2.1. Key market trends, growth factors and opportunities
- 7.5.5.2.2. Market size and forecast, by Resin Type
- 7.5.5.2.3. Market size and forecast, by Manufacturing Process
- 7.5.5.2.4. Market size and forecast, by Application
- 7.5.5.3. South Africa
- 7.5.5.3.1. Key market trends, growth factors and opportunities
- 7.5.5.3.2. Market size and forecast, by Resin Type
- 7.5.5.3.3. Market size and forecast, by Manufacturing Process
- 7.5.5.3.4. Market size and forecast, by Application
- 7.5.5.4. Rest of LAMEA
- 7.5.5.4.1. Key market trends, growth factors and opportunities
- 7.5.5.4.2. Market size and forecast, by Resin Type
- 7.5.5.4.3. Market size and forecast, by Manufacturing Process
- 7.5.5.4.4. Market size and forecast, by Application
CHAPTER 8: COMPETITIVE LANDSCAPE
- 8.1. Introduction
- 8.2. Top winning strategies
- 8.3. Product Mapping of Top 10 Player
- 8.4. Competitive Dashboard
- 8.5. Competitive Heatmap
- 8.6. Top player positioning, 2022
CHAPTER 9: COMPANY PROFILES
- 9.1. Huntsman International LLC
- 9.1.1. Company overview
- 9.1.2. Key Executives
- 9.1.3. Company snapshot
- 9.1.4. Operating business segments
- 9.1.5. Product portfolio
- 9.1.6. Business performance
- 9.1.7. Key strategic moves and developments
- 9.2. Hexion Inc.
- 9.2.1. Company overview
- 9.2.2. Key Executives
- 9.2.3. Company snapshot
- 9.2.4. Operating business segments
- 9.2.5. Product portfolio
- 9.2.6. Business performance
- 9.3. Scott Bader Company Ltd.
- 9.3.1. Company overview
- 9.3.2. Key Executives
- 9.3.3. Company snapshot
- 9.3.4. Operating business segments
- 9.3.5. Product portfolio
- 9.4. DSM
- 9.4.1. Company overview
- 9.4.2. Key Executives
- 9.4.3. Company snapshot
- 9.4.4. Operating business segments
- 9.4.5. Product portfolio
- 9.4.6. Business performance
- 9.5. Allnex GmbH
- 9.5.1. Company overview
- 9.5.2. Key Executives
- 9.5.3. Company snapshot
- 9.5.4. Operating business segments
- 9.5.5. Product portfolio
- 9.5.6. Key strategic moves and developments
- 9.6. Evonik Industries AG
- 9.6.1. Company overview
- 9.6.2. Key Executives
- 9.6.3. Company snapshot
- 9.6.4. Operating business segments
- 9.6.5. Product portfolio
- 9.6.6. Business performance
- 9.7. SABIC
- 9.7.1. Company overview
- 9.7.2. Key Executives
- 9.7.3. Company snapshot
- 9.7.4. Operating business segments
- 9.7.5. Product portfolio
- 9.7.6. Business performance
- 9.7.7. Key strategic moves and developments
- 9.8. Celanese Corporation
- 9.8.1. Company overview
- 9.8.2. Key Executives
- 9.8.3. Company snapshot
- 9.8.4. Operating business segments
- 9.8.5. Product portfolio
- 9.8.6. Business performance
- 9.8.7. Key strategic moves and developments
- 9.9. Dow
- 9.9.1. Company overview
- 9.9.2. Key Executives
- 9.9.3. Company snapshot
- 9.9.4. Operating business segments
- 9.9.5. Product portfolio
- 9.9.6. Business performance
- 9.10. Sumitomo Bakelite Co., Ltd.
- 9.10.1. Company overview
- 9.10.2. Key Executives
- 9.10.3. Company snapshot
- 9.10.4. Operating business segments
- 9.10.5. Product portfolio
- 9.10.6. Business performance
LIST OF TABLES
- TABLE 01. GLOBAL COMPOSITE RESIN MARKET, BY RESIN TYPE, 2022-2032 ($MILLION)
- TABLE 02. GLOBAL COMPOSITE RESIN MARKET, BY RESIN TYPE, 2022-2032 (KILOTON)
- TABLE 03. COMPOSITE RESIN MARKET FOR THERMOSET RESIN, BY REGION, 2022-2032 ($MILLION)
- TABLE 04. COMPOSITE RESIN MARKET FOR THERMOSET RESIN, BY REGION, 2022-2032 (KILOTON)
- TABLE 05. COMPOSITE RESIN MARKET FOR THERMOPLASTIC RESIN, BY REGION, 2022-2032 ($MILLION)
- TABLE 06. COMPOSITE RESIN MARKET FOR THERMOPLASTIC RESIN, BY REGION, 2022-2032 (KILOTON)
- TABLE 07. GLOBAL COMPOSITE RESIN MARKET, BY MANUFACTURING PROCESS, 2022-2032 ($MILLION)
- TABLE 08. GLOBAL COMPOSITE RESIN MARKET, BY MANUFACTURING PROCESS, 2022-2032 (KILOTON)
- TABLE 09. COMPOSITE RESIN MARKET FOR LAYUP, BY REGION, 2022-2032 ($MILLION)
- TABLE 10. COMPOSITE RESIN MARKET FOR LAYUP, BY REGION, 2022-2032 (KILOTON)
- TABLE 11. COMPOSITE RESIN MARKET FOR FILAMENT WINDING, BY REGION, 2022-2032 ($MILLION)
- TABLE 12. COMPOSITE RESIN MARKET FOR FILAMENT WINDING, BY REGION, 2022-2032 (KILOTON)
- TABLE 13. COMPOSITE RESIN MARKET FOR INJECTION MOLDING, BY REGION, 2022-2032 ($MILLION)
- TABLE 14. COMPOSITE RESIN MARKET FOR INJECTION MOLDING, BY REGION, 2022-2032 (KILOTON)
- TABLE 15. COMPOSITE RESIN MARKET FOR PULTRUSION, BY REGION, 2022-2032 ($MILLION)
- TABLE 16. COMPOSITE RESIN MARKET FOR PULTRUSION, BY REGION, 2022-2032 (KILOTON)
- TABLE 17. COMPOSITE RESIN MARKET FOR COMPRESSION MOLDING, BY REGION, 2022-2032 ($MILLION)
- TABLE 18. COMPOSITE RESIN MARKET FOR COMPRESSION MOLDING, BY REGION, 2022-2032 (KILOTON)
- TABLE 19. COMPOSITE RESIN MARKET FOR RESIN TRANSFER MOLDING, BY REGION, 2022-2032 ($MILLION)
- TABLE 20. COMPOSITE RESIN MARKET FOR RESIN TRANSFER MOLDING, BY REGION, 2022-2032 (KILOTON)
- TABLE 21. GLOBAL COMPOSITE RESIN MARKET, BY APPLICATION, 2022-2032 ($MILLION)
- TABLE 22. GLOBAL COMPOSITE RESIN MARKET, BY APPLICATION, 2022-2032 (KILOTON)
- TABLE 23. COMPOSITE RESIN MARKET FOR CONSTRUCTION AND INFRASTRUCTURE, BY REGION, 2022-2032 ($MILLION)
- TABLE 24. COMPOSITE RESIN MARKET FOR CONSTRUCTION AND INFRASTRUCTURE, BY REGION, 2022-2032 (KILOTON)
- TABLE 25. COMPOSITE RESIN MARKET FOR AUTOMOTIVE AND TRANSPORTATION, BY REGION, 2022-2032 ($MILLION)
- TABLE 26. COMPOSITE RESIN MARKET FOR AUTOMOTIVE AND TRANSPORTATION, BY REGION, 2022-2032 (KILOTON)
- TABLE 27. COMPOSITE RESIN MARKET FOR ELECTRICALS AND ELECTRONICS, BY REGION, 2022-2032 ($MILLION)
- TABLE 28. COMPOSITE RESIN MARKET FOR ELECTRICALS AND ELECTRONICS, BY REGION, 2022-2032 (KILOTON)
- TABLE 29. COMPOSITE RESIN MARKET FOR PIPES AND TANKS, BY REGION, 2022-2032 ($MILLION)
- TABLE 30. COMPOSITE RESIN MARKET FOR PIPES AND TANKS, BY REGION, 2022-2032 (KILOTON)
- TABLE 31. COMPOSITE RESIN MARKET FOR WIND ENERGY, BY REGION, 2022-2032 ($MILLION)
- TABLE 32. COMPOSITE RESIN MARKET FOR WIND ENERGY, BY REGION, 2022-2032 (KILOTON)
- TABLE 33. COMPOSITE RESIN MARKET FOR MARINE, BY REGION, 2022-2032 ($MILLION)
- TABLE 34. COMPOSITE RESIN MARKET FOR MARINE, BY REGION, 2022-2032 (KILOTON)
- TABLE 35. COMPOSITE RESIN MARKET FOR AEROSPACE AND DEFENSE, BY REGION, 2022-2032 ($MILLION)
- TABLE 36. COMPOSITE RESIN MARKET FOR AEROSPACE AND DEFENSE, BY REGION, 2022-2032 (KILOTON)
- TABLE 37. COMPOSITE RESIN MARKET FOR OTHER, BY REGION, 2022-2032 ($MILLION)
- TABLE 38. COMPOSITE RESIN MARKET FOR OTHER, BY REGION, 2022-2032 (KILOTON)
- TABLE 39. COMPOSITE RESIN MARKET, BY REGION, 2022-2032 ($MILLION)
- TABLE 40. COMPOSITE RESIN MARKET, BY REGION, 2022-2032 (KILOTON)
- TABLE 41. NORTH AMERICA COMPOSITE RESIN MARKET, BY RESIN TYPE, 2022-2032 ($MILLION)
- TABLE 42. NORTH AMERICA COMPOSITE RESIN MARKET, BY RESIN TYPE, 2022-2032 (KILOTON)
- TABLE 43. NORTH AMERICA COMPOSITE RESIN MARKET, BY MANUFACTURING PROCESS, 2022-2032 ($MILLION)
- TABLE 44. NORTH AMERICA COMPOSITE RESIN MARKET, BY MANUFACTURING PROCESS, 2022-2032 (KILOTON)
- TABLE 45. NORTH AMERICA COMPOSITE RESIN MARKET, BY APPLICATION, 2022-2032 ($MILLION)
- TABLE 46. NORTH AMERICA COMPOSITE RESIN MARKET, BY APPLICATION, 2022-2032 (KILOTON)
- TABLE 47. NORTH AMERICA COMPOSITE RESIN MARKET, BY COUNTRY, 2022-2032 ($MILLION)
- TABLE 48. NORTH AMERICA COMPOSITE RESIN MARKET, BY COUNTRY, 2022-2032 (KILOTON)
- TABLE 49. U.S. COMPOSITE RESIN MARKET, BY RESIN TYPE, 2022-2032 ($MILLION)
- TABLE 50. U.S. COMPOSITE RESIN MARKET, BY RESIN TYPE, 2022-2032 (KILOTON)
- TABLE 51. U.S. COMPOSITE RESIN MARKET, BY MANUFACTURING PROCESS, 2022-2032 ($MILLION)
- TABLE 52. U.S. COMPOSITE RESIN MARKET, BY MANUFACTURING PROCESS, 2022-2032 (KILOTON)
- TABLE 53. U.S. COMPOSITE RESIN MARKET, BY APPLICATION, 2022-2032 ($MILLION)
- TABLE 54. U.S. COMPOSITE RESIN MARKET, BY APPLICATION, 2022-2032 (KILOTON)
- TABLE 55. CANADA COMPOSITE RESIN MARKET, BY RESIN TYPE, 2022-2032 ($MILLION)
- TABLE 56. CANADA COMPOSITE RESIN MARKET, BY RESIN TYPE, 2022-2032 (KILOTON)
- TABLE 57. CANADA COMPOSITE RESIN MARKET, BY MANUFACTURING PROCESS, 2022-2032 ($MILLION)
- TABLE 58. CANADA COMPOSITE RESIN MARKET, BY MANUFACTURING PROCESS, 2022-2032 (KILOTON)
- TABLE 59. CANADA COMPOSITE RESIN MARKET, BY APPLICATION, 2022-2032 ($MILLION)
- TABLE 60. CANADA COMPOSITE RESIN MARKET, BY APPLICATION, 2022-2032 (KILOTON)
- TABLE 61. MEXICO COMPOSITE RESIN MARKET, BY RESIN TYPE, 2022-2032 ($MILLION)
- TABLE 62. MEXICO COMPOSITE RESIN MARKET, BY RESIN TYPE, 2022-2032 (KILOTON)
- TABLE 63. MEXICO COMPOSITE RESIN MARKET, BY MANUFACTURING PROCESS, 2022-2032 ($MILLION)
- TABLE 64. MEXICO COMPOSITE RESIN MARKET, BY MANUFACTURING PROCESS, 2022-2032 (KILOTON)
- TABLE 65. MEXICO COMPOSITE RESIN MARKET, BY APPLICATION, 2022-2032 ($MILLION)
- TABLE 66. MEXICO COMPOSITE RESIN MARKET, BY APPLICATION, 2022-2032 (KILOTON)
- TABLE 67. EUROPE COMPOSITE RESIN MARKET, BY RESIN TYPE, 2022-2032 ($MILLION)
- TABLE 68. EUROPE COMPOSITE RESIN MARKET, BY RESIN TYPE, 2022-2032 (KILOTON)
- TABLE 69. EUROPE COMPOSITE RESIN MARKET, BY MANUFACTURING PROCESS, 2022-2032 ($MILLION)
- TABLE 70. EUROPE COMPOSITE RESIN MARKET, BY MANUFACTURING PROCESS, 2022-2032 (KILOTON)
- TABLE 71. EUROPE COMPOSITE RESIN MARKET, BY APPLICATION, 2022-2032 ($MILLION)
- TABLE 72. EUROPE COMPOSITE RESIN MARKET, BY APPLICATION, 2022-2032 (KILOTON)
- TABLE 73. EUROPE COMPOSITE RESIN MARKET, BY COUNTRY, 2022-2032 ($MILLION)
- TABLE 74. EUROPE COMPOSITE RESIN MARKET, BY COUNTRY, 2022-2032 (KILOTON)
- TABLE 75. GERMANY COMPOSITE RESIN MARKET, BY RESIN TYPE, 2022-2032 ($MILLION)
- TABLE 76. GERMANY COMPOSITE RESIN MARKET, BY RESIN TYPE, 2022-2032 (KILOTON)
- TABLE 77. GERMANY COMPOSITE RESIN MARKET, BY MANUFACTURING PROCESS, 2022-2032 ($MILLION)
- TABLE 78. GERMANY COMPOSITE RESIN MARKET, BY MANUFACTURING PROCESS, 2022-2032 (KILOTON)
- TABLE 79. GERMANY COMPOSITE RESIN MARKET, BY APPLICATION, 2022-2032 ($MILLION)
- TABLE 80. GERMANY COMPOSITE RESIN MARKET, BY APPLICATION, 2022-2032 (KILOTON)
- TABLE 81. FRANCE COMPOSITE RESIN MARKET, BY RESIN TYPE, 2022-2032 ($MILLION)
- TABLE 82. FRANCE COMPOSITE RESIN MARKET, BY RESIN TYPE, 2022-2032 (KILOTON)
- TABLE 83. FRANCE COMPOSITE RESIN MARKET, BY MANUFACTURING PROCESS, 2022-2032 ($MILLION)
- TABLE 84. FRANCE COMPOSITE RESIN MARKET, BY MANUFACTURING PROCESS, 2022-2032 (KILOTON)
- TABLE 85. FRANCE COMPOSITE RESIN MARKET, BY APPLICATION, 2022-2032 ($MILLION)
- TABLE 86. FRANCE COMPOSITE RESIN MARKET, BY APPLICATION, 2022-2032 (KILOTON)
- TABLE 87. UK COMPOSITE RESIN MARKET, BY RESIN TYPE, 2022-2032 ($MILLION)
- TABLE 88. UK COMPOSITE RESIN MARKET, BY RESIN TYPE, 2022-2032 (KILOTON)
- TABLE 89. UK COMPOSITE RESIN MARKET, BY MANUFACTURING PROCESS, 2022-2032 ($MILLION)
- TABLE 90. UK COMPOSITE RESIN MARKET, BY MANUFACTURING PROCESS, 2022-2032 (KILOTON)
- TABLE 91. UK COMPOSITE RESIN MARKET, BY APPLICATION, 2022-2032 ($MILLION)
- TABLE 92. UK COMPOSITE RESIN MARKET, BY APPLICATION, 2022-2032 (KILOTON)
- TABLE 93. SPAIN COMPOSITE RESIN MARKET, BY RESIN TYPE, 2022-2032 ($MILLION)
- TABLE 94. SPAIN COMPOSITE RESIN MARKET, BY RESIN TYPE, 2022-2032 (KILOTON)
- TABLE 95. SPAIN COMPOSITE RESIN MARKET, BY MANUFACTURING PROCESS, 2022-2032 ($MILLION)
- TABLE 96. SPAIN COMPOSITE RESIN MARKET, BY MANUFACTURING PROCESS, 2022-2032 (KILOTON)
- TABLE 97. SPAIN COMPOSITE RESIN MARKET, BY APPLICATION, 2022-2032 ($MILLION)
- TABLE 98. SPAIN COMPOSITE RESIN MARKET, BY APPLICATION, 2022-2032 (KILOTON)
- TABLE 99. ITALY COMPOSITE RESIN MARKET, BY RESIN TYPE, 2022-2032 ($MILLION)
- TABLE 100. ITALY COMPOSITE RESIN MARKET, BY RESIN TYPE, 2022-2032 (KILOTON)
- TABLE 101. ITALY COMPOSITE RESIN MARKET, BY MANUFACTURING PROCESS, 2022-2032 ($MILLION)
- TABLE 102. ITALY COMPOSITE RESIN MARKET, BY MANUFACTURING PROCESS, 2022-2032 (KILOTON)
- TABLE 103. ITALY COMPOSITE RESIN MARKET, BY APPLICATION, 2022-2032 ($MILLION)
- TABLE 104. ITALY COMPOSITE RESIN MARKET, BY APPLICATION, 2022-2032 (KILOTON)
- TABLE 105. REST OF EUROPE COMPOSITE RESIN MARKET, BY RESIN TYPE, 2022-2032 ($MILLION)
- TABLE 106. REST OF EUROPE COMPOSITE RESIN MARKET, BY RESIN TYPE, 2022-2032 (KILOTON)
- TABLE 107. REST OF EUROPE COMPOSITE RESIN MARKET, BY MANUFACTURING PROCESS, 2022-2032 ($MILLION)
- TABLE 108. REST OF EUROPE COMPOSITE RESIN MARKET, BY MANUFACTURING PROCESS, 2022-2032 (KILOTON)
- TABLE 109. REST OF EUROPE COMPOSITE RESIN MARKET, BY APPLICATION, 2022-2032 ($MILLION)
- TABLE 110. REST OF EUROPE COMPOSITE RESIN MARKET, BY APPLICATION, 2022-2032 (KILOTON)
- TABLE 111. ASIA-PACIFIC COMPOSITE RESIN MARKET, BY RESIN TYPE, 2022-2032 ($MILLION)
- TABLE 112. ASIA-PACIFIC COMPOSITE RESIN MARKET, BY RESIN TYPE, 2022-2032 (KILOTON)
- TABLE 113. ASIA-PACIFIC COMPOSITE RESIN MARKET, BY MANUFACTURING PROCESS, 2022-2032 ($MILLION)
- TABLE 114. ASIA-PACIFIC COMPOSITE RESIN MARKET, BY MANUFACTURING PROCESS, 2022-2032 (KILOTON)
- TABLE 115. ASIA-PACIFIC COMPOSITE RESIN MARKET, BY APPLICATION, 2022-2032 ($MILLION)
- TABLE 116. ASIA-PACIFIC COMPOSITE RESIN MARKET, BY APPLICATION, 2022-2032 (KILOTON)
- TABLE 117. ASIA-PACIFIC COMPOSITE RESIN MARKET, BY COUNTRY, 2022-2032 ($MILLION)
- TABLE 118. ASIA-PACIFIC COMPOSITE RESIN MARKET, BY COUNTRY, 2022-2032 (KILOTON)
- TABLE 119. CHINA COMPOSITE RESIN MARKET, BY RESIN TYPE, 2022-2032 ($MILLION)
- TABLE 120. CHINA COMPOSITE RESIN MARKET, BY RESIN TYPE, 2022-2032 (KILOTON)
- TABLE 121. CHINA COMPOSITE RESIN MARKET, BY MANUFACTURING PROCESS, 2022-2032 ($MILLION)
- TABLE 122. CHINA COMPOSITE RESIN MARKET, BY MANUFACTURING PROCESS, 2022-2032 (KILOTON)
- TABLE 123. CHINA COMPOSITE RESIN MARKET, BY APPLICATION, 2022-2032 ($MILLION)
- TABLE 124. CHINA COMPOSITE RESIN MARKET, BY APPLICATION, 2022-2032 (KILOTON)
- TABLE 125. INDIA COMPOSITE RESIN MARKET, BY RESIN TYPE, 2022-2032 ($MILLION)
- TABLE 126. INDIA COMPOSITE RESIN MARKET, BY RESIN TYPE, 2022-2032 (KILOTON)
- TABLE 127. INDIA COMPOSITE RESIN MARKET, BY MANUFACTURING PROCESS, 2022-2032 ($MILLION)
- TABLE 128. INDIA COMPOSITE RESIN MARKET, BY MANUFACTURING PROCESS, 2022-2032 (KILOTON)
- TABLE 129. INDIA COMPOSITE RESIN MARKET, BY APPLICATION, 2022-2032 ($MILLION)
- TABLE 130. INDIA COMPOSITE RESIN MARKET, BY APPLICATION, 2022-2032 (KILOTON)
- TABLE 131. JAPAN COMPOSITE RESIN MARKET, BY RESIN TYPE, 2022-2032 ($MILLION)
- TABLE 132. JAPAN COMPOSITE RESIN MARKET, BY RESIN TYPE, 2022-2032 (KILOTON)
- TABLE 133. JAPAN COMPOSITE RESIN MARKET, BY MANUFACTURING PROCESS, 2022-2032 ($MILLION)
- TABLE 134. JAPAN COMPOSITE RESIN MARKET, BY MANUFACTURING PROCESS, 2022-2032 (KILOTON)
- TABLE 135. JAPAN COMPOSITE RESIN MARKET, BY APPLICATION, 2022-2032 ($MILLION)
- TABLE 136. JAPAN COMPOSITE RESIN MARKET, BY APPLICATION, 2022-2032 (KILOTON)
- TABLE 137. SOUTH KOREA COMPOSITE RESIN MARKET, BY RESIN TYPE, 2022-2032 ($MILLION)
- TABLE 138. SOUTH KOREA COMPOSITE RESIN MARKET, BY RESIN TYPE, 2022-2032 (KILOTON)
- TABLE 139. SOUTH KOREA COMPOSITE RESIN MARKET, BY MANUFACTURING PROCESS, 2022-2032 ($MILLION)
- TABLE 140. SOUTH KOREA COMPOSITE RESIN MARKET, BY MANUFACTURING PROCESS, 2022-2032 (KILOTON)
- TABLE 141. SOUTH KOREA COMPOSITE RESIN MARKET, BY APPLICATION, 2022-2032 ($MILLION)
- TABLE 142. SOUTH KOREA COMPOSITE RESIN MARKET, BY APPLICATION, 2022-2032 (KILOTON)
- TABLE 143. AUSTRALIA COMPOSITE RESIN MARKET, BY RESIN TYPE, 2022-2032 ($MILLION)
- TABLE 144. AUSTRALIA COMPOSITE RESIN MARKET, BY RESIN TYPE, 2022-2032 (KILOTON)
- TABLE 145. AUSTRALIA COMPOSITE RESIN MARKET, BY MANUFACTURING PROCESS, 2022-2032 ($MILLION)
- TABLE 146. AUSTRALIA COMPOSITE RESIN MARKET, BY MANUFACTURING PROCESS, 2022-2032 (KILOTON)
- TABLE 147. AUSTRALIA COMPOSITE RESIN MARKET, BY APPLICATION, 2022-2032 ($MILLION)
- TABLE 148. AUSTRALIA COMPOSITE RESIN MARKET, BY APPLICATION, 2022-2032 (KILOTON)
- TABLE 149. REST OF ASIA-PACIFIC COMPOSITE RESIN MARKET, BY RESIN TYPE, 2022-2032 ($MILLION)
- TABLE 150. REST OF ASIA-PACIFIC COMPOSITE RESIN MARKET, BY RESIN TYPE, 2022-2032 (KILOTON)
- TABLE 151. REST OF ASIA-PACIFIC COMPOSITE RESIN MARKET, BY MANUFACTURING PROCESS, 2022-2032 ($MILLION)
- TABLE 152. REST OF ASIA-PACIFIC COMPOSITE RESIN MARKET, BY MANUFACTURING PROCESS, 2022-2032 (KILOTON)
- TABLE 153. REST OF ASIA-PACIFIC COMPOSITE RESIN MARKET, BY APPLICATION, 2022-2032 ($MILLION)
- TABLE 154. REST OF ASIA-PACIFIC COMPOSITE RESIN MARKET, BY APPLICATION, 2022-2032 (KILOTON)
- TABLE 155. LAMEA COMPOSITE RESIN MARKET, BY RESIN TYPE, 2022-2032 ($MILLION)
- TABLE 156. LAMEA COMPOSITE RESIN MARKET, BY RESIN TYPE, 2022-2032 (KILOTON)
- TABLE 157. LAMEA COMPOSITE RESIN MARKET, BY MANUFACTURING PROCESS, 2022-2032 ($MILLION)
- TABLE 158. LAMEA COMPOSITE RESIN MARKET, BY MANUFACTURING PROCESS, 2022-2032 (KILOTON)
- TABLE 159. LAMEA COMPOSITE RESIN MARKET, BY APPLICATION, 2022-2032 ($MILLION)
- TABLE 160. LAMEA COMPOSITE RESIN MARKET, BY APPLICATION, 2022-2032 (KILOTON)
- TABLE 161. LAMEA COMPOSITE RESIN MARKET, BY COUNTRY, 2022-2032 ($MILLION)
- TABLE 162. LAMEA COMPOSITE RESIN MARKET, BY COUNTRY, 2022-2032 (KILOTON)
- TABLE 163. BRAZIL COMPOSITE RESIN MARKET, BY RESIN TYPE, 2022-2032 ($MILLION)
- TABLE 164. BRAZIL COMPOSITE RESIN MARKET, BY RESIN TYPE, 2022-2032 (KILOTON)
- TABLE 165. BRAZIL COMPOSITE RESIN MARKET, BY MANUFACTURING PROCESS, 2022-2032 ($MILLION)
- TABLE 166. BRAZIL COMPOSITE RESIN MARKET, BY MANUFACTURING PROCESS, 2022-2032 (KILOTON)
- TABLE 167. BRAZIL COMPOSITE RESIN MARKET, BY APPLICATION, 2022-2032 ($MILLION)
- TABLE 168. BRAZIL COMPOSITE RESIN MARKET, BY APPLICATION, 2022-2032 (KILOTON)
- TABLE 169. SAUDI ARABIA COMPOSITE RESIN MARKET, BY RESIN TYPE, 2022-2032 ($MILLION)
- TABLE 170. SAUDI ARABIA COMPOSITE RESIN MARKET, BY RESIN TYPE, 2022-2032 (KILOTON)
- TABLE 171. SAUDI ARABIA COMPOSITE RESIN MARKET, BY MANUFACTURING PROCESS, 2022-2032 ($MILLION)
- TABLE 172. SAUDI ARABIA COMPOSITE RESIN MARKET, BY MANUFACTURING PROCESS, 2022-2032 (KILOTON)
- TABLE 173. SAUDI ARABIA COMPOSITE RESIN MARKET, BY APPLICATION, 2022-2032 ($MILLION)
- TABLE 174. SAUDI ARABIA COMPOSITE RESIN MARKET, BY APPLICATION, 2022-2032 (KILOTON)
- TABLE 175. SOUTH AFRICA COMPOSITE RESIN MARKET, BY RESIN TYPE, 2022-2032 ($MILLION)
- TABLE 176. SOUTH AFRICA COMPOSITE RESIN MARKET, BY RESIN TYPE, 2022-2032 (KILOTON)
- TABLE 177. SOUTH AFRICA COMPOSITE RESIN MARKET, BY MANUFACTURING PROCESS, 2022-2032 ($MILLION)
- TABLE 178. SOUTH AFRICA COMPOSITE RESIN MARKET, BY MANUFACTURING PROCESS, 2022-2032 (KILOTON)
- TABLE 179. SOUTH AFRICA COMPOSITE RESIN MARKET, BY APPLICATION, 2022-2032 ($MILLION)
- TABLE 180. SOUTH AFRICA COMPOSITE RESIN MARKET, BY APPLICATION, 2022-2032 (KILOTON)
- TABLE 181. REST OF LAMEA COMPOSITE RESIN MARKET, BY RESIN TYPE, 2022-2032 ($MILLION)
- TABLE 182. REST OF LAMEA COMPOSITE RESIN MARKET, BY RESIN TYPE, 2022-2032 (KILOTON)
- TABLE 183. REST OF LAMEA COMPOSITE RESIN MARKET, BY MANUFACTURING PROCESS, 2022-2032 ($MILLION)
- TABLE 184. REST OF LAMEA COMPOSITE RESIN MARKET, BY MANUFACTURING PROCESS, 2022-2032 (KILOTON)
- TABLE 185. REST OF LAMEA COMPOSITE RESIN MARKET, BY APPLICATION, 2022-2032 ($MILLION)
- TABLE 186. REST OF LAMEA COMPOSITE RESIN MARKET, BY APPLICATION, 2022-2032 (KILOTON)
- TABLE 187. HUNTSMAN INTERNATIONAL LLC: KEY EXECUTIVES
- TABLE 188. HUNTSMAN INTERNATIONAL LLC: COMPANY SNAPSHOT
- TABLE 189. HUNTSMAN INTERNATIONAL LLC: PRODUCT SEGMENTS
- TABLE 190. HUNTSMAN INTERNATIONAL LLC: PRODUCT PORTFOLIO
- TABLE 191. HUNTSMAN INTERNATIONAL LLC: KEY STRATERGIES
- TABLE 192. HEXION INC.: KEY EXECUTIVES
- TABLE 193. HEXION INC.: COMPANY SNAPSHOT
- TABLE 194. HEXION INC.: PRODUCT SEGMENTS
- TABLE 195. HEXION INC.: PRODUCT PORTFOLIO
- TABLE 196. SCOTT BADER COMPANY LTD.: KEY EXECUTIVES
- TABLE 197. SCOTT BADER COMPANY LTD.: COMPANY SNAPSHOT
- TABLE 198. SCOTT BADER COMPANY LTD.: PRODUCT SEGMENTS
- TABLE 199. SCOTT BADER COMPANY LTD.: PRODUCT PORTFOLIO
- TABLE 200. DSM: KEY EXECUTIVES
- TABLE 201. DSM: COMPANY SNAPSHOT
- TABLE 202. DSM: PRODUCT SEGMENTS
- TABLE 203. DSM: PRODUCT PORTFOLIO
- TABLE 204. ALLNEX GMBH: KEY EXECUTIVES
- TABLE 205. ALLNEX GMBH: COMPANY SNAPSHOT
- TABLE 206. ALLNEX GMBH: PRODUCT SEGMENTS
- TABLE 207. ALLNEX GMBH: PRODUCT PORTFOLIO
- TABLE 208. ALLNEX GMBH: KEY STRATERGIES
- TABLE 209. EVONIK INDUSTRIES AG: KEY EXECUTIVES
- TABLE 210. EVONIK INDUSTRIES AG: COMPANY SNAPSHOT
- TABLE 211. EVONIK INDUSTRIES AG: PRODUCT SEGMENTS
- TABLE 212. EVONIK INDUSTRIES AG: PRODUCT PORTFOLIO
- TABLE 213. SABIC: KEY EXECUTIVES
- TABLE 214. SABIC: COMPANY SNAPSHOT
- TABLE 215. SABIC: PRODUCT SEGMENTS
- TABLE 216. SABIC: PRODUCT PORTFOLIO
- TABLE 217. SABIC: KEY STRATERGIES
- TABLE 218. CELANESE CORPORATION: KEY EXECUTIVES
- TABLE 219. CELANESE CORPORATION: COMPANY SNAPSHOT
- TABLE 220. CELANESE CORPORATION: PRODUCT SEGMENTS
- TABLE 221. CELANESE CORPORATION: PRODUCT PORTFOLIO
- TABLE 222. CELANESE CORPORATION: KEY STRATERGIES
- TABLE 223. DOW: KEY EXECUTIVES
- TABLE 224. DOW: COMPANY SNAPSHOT
- TABLE 225. DOW: PRODUCT SEGMENTS
- TABLE 226. DOW: PRODUCT PORTFOLIO
- TABLE 227. SUMITOMO BAKELITE CO., LTD.: KEY EXECUTIVES
- TABLE 228. SUMITOMO BAKELITE CO., LTD.: COMPANY SNAPSHOT
- TABLE 229. SUMITOMO BAKELITE CO., LTD.: PRODUCT SEGMENTS
- TABLE 230. SUMITOMO BAKELITE CO., LTD.: PRODUCT PORTFOLIO
LIST OF FIGURES
- FIGURE 01. COMPOSITE RESIN MARKET, 2022-2032
- FIGURE 02. SEGMENTATION OF COMPOSITE RESIN MARKET, 2022-2032
- FIGURE 03. TOP INVESTMENT POCKETS IN COMPOSITE RESIN MARKET (2023-2032)
- FIGURE 04. LOW BARGAINING POWER OF SUPPLIERS
- FIGURE 05. LOW BARGAINING POWER OF BUYERS
- FIGURE 06. LOW THREAT OF SUBSTITUTES
- FIGURE 07. LOW THREAT OF NEW ENTRANTS
- FIGURE 08. LOW INTENSITY OF RIVALRY
- FIGURE 09. DRIVERS, RESTRAINTS AND OPPORTUNITIES: GLOBALCOMPOSITE RESIN MARKET
- FIGURE 10. IMPACT OF KEY REGULATION: COMPOSITE RESIN MARKET
- FIGURE 11. PATENT ANALYSIS BY COMPANY
- FIGURE 12. PATENT ANALYSIS BY COUNTRY
- FIGURE 13. PRICING ANALYSIS: COMPOSITE RESIN MARKET 2022 AND 2032
- FIGURE 14. VALUE CHAIN ANALYSIS: COMPOSITE RESIN MARKET
- FIGURE 15. COMPOSITE RESIN MARKET, BY RESIN TYPE, 2022(%)
- FIGURE 16. COMPARATIVE SHARE ANALYSIS OF COMPOSITE RESIN MARKET FOR THERMOSET RESIN, BY COUNTRY 2022 AND 2032(%)
- FIGURE 17. COMPARATIVE SHARE ANALYSIS OF COMPOSITE RESIN MARKET FOR THERMOPLASTIC RESIN, BY COUNTRY 2022 AND 2032(%)
- FIGURE 18. COMPOSITE RESIN MARKET, BY MANUFACTURING PROCESS, 2022(%)
- FIGURE 19. COMPARATIVE SHARE ANALYSIS OF COMPOSITE RESIN MARKET FOR LAYUP, BY COUNTRY 2022 AND 2032(%)
- FIGURE 20. COMPARATIVE SHARE ANALYSIS OF COMPOSITE RESIN MARKET FOR FILAMENT WINDING, BY COUNTRY 2022 AND 2032(%)
- FIGURE 21. COMPARATIVE SHARE ANALYSIS OF COMPOSITE RESIN MARKET FOR INJECTION MOLDING, BY COUNTRY 2022 AND 2032(%)
- FIGURE 22. COMPARATIVE SHARE ANALYSIS OF COMPOSITE RESIN MARKET FOR PULTRUSION, BY COUNTRY 2022 AND 2032(%)
- FIGURE 23. COMPARATIVE SHARE ANALYSIS OF COMPOSITE RESIN MARKET FOR COMPRESSION MOLDING, BY COUNTRY 2022 AND 2032(%)
- FIGURE 24. COMPARATIVE SHARE ANALYSIS OF COMPOSITE RESIN MARKET FOR RESIN TRANSFER MOLDING, BY COUNTRY 2022 AND 2032(%)
- FIGURE 25. COMPOSITE RESIN MARKET, BY APPLICATION, 2022(%)
- FIGURE 26. COMPARATIVE SHARE ANALYSIS OF COMPOSITE RESIN MARKET FOR CONSTRUCTION AND INFRASTRUCTURE, BY COUNTRY 2022 AND 2032(%)
- FIGURE 27. COMPARATIVE SHARE ANALYSIS OF COMPOSITE RESIN MARKET FOR AUTOMOTIVE AND TRANSPORTATION, BY COUNTRY 2022 AND 2032(%)
- FIGURE 28. COMPARATIVE SHARE ANALYSIS OF COMPOSITE RESIN MARKET FOR ELECTRICALS AND ELECTRONICS, BY COUNTRY 2022 AND 2032(%)
- FIGURE 29. COMPARATIVE SHARE ANALYSIS OF COMPOSITE RESIN MARKET FOR PIPES AND TANKS, BY COUNTRY 2022 AND 2032(%)
- FIGURE 30. COMPARATIVE SHARE ANALYSIS OF COMPOSITE RESIN MARKET FOR WIND ENERGY, BY COUNTRY 2022 AND 2032(%)
- FIGURE 31. COMPARATIVE SHARE ANALYSIS OF COMPOSITE RESIN MARKET FOR MARINE, BY COUNTRY 2022 AND 2032(%)
- FIGURE 32. COMPARATIVE SHARE ANALYSIS OF COMPOSITE RESIN MARKET FOR AEROSPACE AND DEFENSE, BY COUNTRY 2022 AND 2032(%)
- FIGURE 33. COMPARATIVE SHARE ANALYSIS OF COMPOSITE RESIN MARKET FOR OTHER, BY COUNTRY 2022 AND 2032(%)
- FIGURE 34. COMPOSITE RESIN MARKET BY REGION, 2022
- FIGURE 35. U.S. COMPOSITE RESIN MARKET, 2022-2032 ($MILLION)
- FIGURE 36. CANADA COMPOSITE RESIN MARKET, 2022-2032 ($MILLION)
- FIGURE 37. MEXICO COMPOSITE RESIN MARKET, 2022-2032 ($MILLION)
- FIGURE 38. GERMANY COMPOSITE RESIN MARKET, 2022-2032 ($MILLION)
- FIGURE 39. FRANCE COMPOSITE RESIN MARKET, 2022-2032 ($MILLION)
- FIGURE 40. UK COMPOSITE RESIN MARKET, 2022-2032 ($MILLION)
- FIGURE 41. SPAIN COMPOSITE RESIN MARKET, 2022-2032 ($MILLION)
- FIGURE 42. ITALY COMPOSITE RESIN MARKET, 2022-2032 ($MILLION)
- FIGURE 43. REST OF EUROPE COMPOSITE RESIN MARKET, 2022-2032 ($MILLION)
- FIGURE 44. CHINA COMPOSITE RESIN MARKET, 2022-2032 ($MILLION)
- FIGURE 45. INDIA COMPOSITE RESIN MARKET, 2022-2032 ($MILLION)
- FIGURE 46. JAPAN COMPOSITE RESIN MARKET, 2022-2032 ($MILLION)
- FIGURE 47. SOUTH KOREA COMPOSITE RESIN MARKET, 2022-2032 ($MILLION)
- FIGURE 48. AUSTRALIA COMPOSITE RESIN MARKET, 2022-2032 ($MILLION)
- FIGURE 49. REST OF ASIA-PACIFIC COMPOSITE RESIN MARKET, 2022-2032 ($MILLION)
- FIGURE 50. BRAZIL COMPOSITE RESIN MARKET, 2022-2032 ($MILLION)
- FIGURE 51. SAUDI ARABIA COMPOSITE RESIN MARKET, 2022-2032 ($MILLION)
- FIGURE 52. SOUTH AFRICA COMPOSITE RESIN MARKET, 2022-2032 ($MILLION)
- FIGURE 53. REST OF LAMEA COMPOSITE RESIN MARKET, 2022-2032 ($MILLION)
- FIGURE 54. TOP WINNING STRATEGIES, BY YEAR
- FIGURE 55. TOP WINNING STRATEGIES, BY DEVELOPMENT
- FIGURE 56. TOP WINNING STRATEGIES, BY COMPANY
- FIGURE 57. PRODUCT MAPPING OF TOP 10 PLAYERS
- FIGURE 58. COMPETITIVE DASHBOARD
- FIGURE 59. COMPETITIVE HEATMAP: COMPOSITE RESIN MARKET
- FIGURE 60. TOP PLAYER POSITIONING, 2022
- FIGURE 61. HUNTSMAN INTERNATIONAL LLC: NET REVENUE, 2019-2021 ($MILLION)
- FIGURE 62. HUNTSMAN INTERNATIONAL LLC: REVENUE SHARE BY SEGMENT, 2021 (%)
- FIGURE 63. HUNTSMAN INTERNATIONAL LLC: REVENUE SHARE BY REGION, 2021 (%)
- FIGURE 64. HEXION INC.: NET SALES, 2017-2019 ($MILLION)
- FIGURE 65. HEXION INC.: REVENUE SHARE BY REGION, 2019 (%)
- FIGURE 66. DSM: NET SALES, 2020-2022 ($MILLION)
- FIGURE 67. DSM: REVENUE SHARE BY SEGMENT, 2022 (%)
- FIGURE 68. DSM: REVENUE SHARE BY SEGMENT, 2022 (%)
- FIGURE 69. EVONIK INDUSTRIES AG: NET REVENUE, 2019-2021 ($MILLION)
- FIGURE 70. EVONIK INDUSTRIES AG: REVENUE SHARE BY REGION, 2021 (%)
- FIGURE 71. EVONIK INDUSTRIES AG: REVENUE SHARE BY SEGMENT, 2021 (%)
- FIGURE 72. SABIC: NET SALES, 2020-2022 ($MILLION)
- FIGURE 73. SABIC: REVENUE SHARE BY SEGMENT, 2022 (%)
- FIGURE 74. SABIC: REVENUE SHARE BY REGION, 2022 (%)
- FIGURE 75. CELANESE CORPORATION: NET REVENUE, 2019-2021 ($MILLION)
- FIGURE 76. CELANESE CORPORATION: RESEARCH & DEVELOPMENT EXPENDITURE, 2019-2021
- FIGURE 77. DOW: NET SALES, 2020-2022 ($MILLION)
- FIGURE 78. DOW: RESEARCH & DEVELOPMENT EXPENDITURE, 2020-2022 ($MILLION)
- FIGURE 79. DOW: REVENUE SHARE BY SEGMENT, 2022 (%)
- FIGURE 80. DOW: REVENUE SHARE BY REGION, 2022 (%)
- FIGURE 81. SUMITOMO BAKELITE CO., LTD.: NET REVENUE, 2019-2021 ($MILLION)
- FIGURE 82. SUMITOMO BAKELITE CO., LTD.: REVENUE SHARE BY SEGMENT, 2021 (%)

