
PUBLISHER: Allied Market Research | PRODUCT CODE: 1298442

PUBLISHER: Allied Market Research | PRODUCT CODE: 1298442
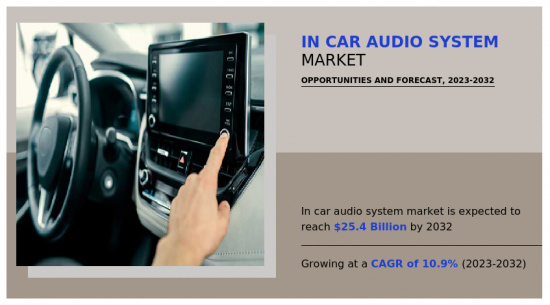
In Car Audio System Market By Component, By Manufacturer, By Vehicle Type, By Sales Channel : Global Opportunity Analysis and Industry Forecast, 2022-2032
In-car audio system comprises the electronic devices installed in cars or other vehicles, which provide in-car entertainment and information for vehicle occupants. Common car audio components include stereos, speakers, subwoofers, amplifiers, and auxiliary inputs, such as USB ports and headphone jacks. There are many different types and models of car audio systems available from various manufacturers, ranging from basic budget units to high-end audiophile systems with advanced features such as voice control, digital signal processing, and Bluetooth connectivity. The power output, connectivity choices, sound quality, and general electrical system compatibility should all be considered when choosing a car audio system.
The German new car market increased by 1.1% in the full year 2022 to 2,651,357 passenger cars, the second lowest number of new passenger vehicle registrations in a calendar year in Germany in decades. Sales of light commercial vehicles, trucks, buses, and motorcycles sales were weaker. Only 17.8% of all new cars in Germany were diesel-powered, but sales of electric vehicles increased by a third to a record 17.7% share of the market. At 3,240,478 cars, the overall number of new motorized vehicle registrations in Germany increased by 0.2% in 2022, a little over 7,000 more than in 2021 but almost a million less than in 2019.
In 2022, Germany's car output increased by 11% to 3.4 million vehicles. The number of automobiles produced in 2021-3.1 million-was the lowest since 1975. The fundamental constraint on global auto manufacturing, as in Germany, was supply constraints rather than demand. The VDA estimates that German auto exports climbed by a comparable 10% in 2022, reaching 2.6 million vehicles exported. The German car market is not able to match its pre COVID sales, but the market is making progress as the year over year sales are improving and creating demand for cars and components related to the market.
Owing to strong sales of electric vehicles and large fleets, new automobile registrations in the UK increased for the sixth consecutive month in January 2023 rising by 14.7% annually. Full-year sales are anticipated to surpass 2021, an industry association predicted on Monday. According to the Society of Motor Manufacturers and Traders (SMMT), 131,994 vehicles were registered in the UK during February 2023, making this the industry's best start to a year since January 2020. In addition, it is predicted that registrations would reach 1.96 million units by 2024 and that sales would increase by more than 11% to 1.79 million. However, compared to a 16.6% annual share in 2022, battery electric cars (BEVs) only represented 13.1% of new registrations in January. To 17,294 vehicles, BEV registrations increased by 19.8%. Developments like these are expected to escalate the demand for in-car audio systems and components.
In February 2023, passenger automobile sales in Italy increased. According to the Italian Automobile Manufacturers Association (ANFIA), there were 130,365 new passenger cars registered in February, a 17.5% increase over the same month in 2022. With 258,689 cars registered in the first two months of 2023, year-to-date sales had grown 18.2%. In February 2023, registrations for the Fiat brand fell by 4.7% year over year (11.7% market share), while those for the VW brand rose by 56.6% (8.7% share), Toyota registrations rose by 46.5% (6.6% share), and Dacia registrations rose by 51.6% (6.0% market share).
The foreign car distributor association (UNRAE) reported that sales of gasoline-powered passenger cars rose 16.5% year over year to 34,591 units (26.1% share) in February 2023, while sales of diesel cars rose 1.5% to 25,363 units (19.2%), hybrid car sales rose 25.3% to 48,312 units (36.5% share), combined sales of plug-in hybrid and electric vehicles (PHEV and REx) rose 2.2% to 5,615 units (4.2% share), and sales of electric. The sales in the automotive Italian market are on rise, which is expected to boost the demand for in-car audio system.
The OEM car audio systems market is constantly evolving, as OEM car audio systems are increasingly being designed to integrate with other vehicle systems, such as infotainment systems, driver assistance features, and navigation systems. This allows a more seamless and intuitive user experience. Furthermore, OEM car audio systems are incorporating more advanced digital signal processing to enhance audio quality and provide more precise control over the sound. Other OEM car audio systems are now incorporating voice control features, allowing drivers to control the audio system without their hands off the wheels. Thus, all these factors collectively contribute toward the growth of the overall market.
The aftermarket car audio system is designed to work seamlessly with smartphones and other mobile devices, allowing for easy connectivity and access to music, podcasts, and other audio content. Aftermarket car audio systems incorporate more advanced digital signal processing methods to improve audio quality, similar to that of OEM car audio systems. Voice control capabilities are now being included into certain aftermarket automobile audio systems, enabling users to operate the stereo system with their voice. Some aftermarket automobile audio systems are made considering sustainability, thus employing more eco-friendly materials and components, as some buyers are more ecologically conscious. The aftermarket car audio system market is growing and presents significant opportunities for businesses that can meet the evolving needs of consumers.
The in car audio system market is segmented on the basis of component, make, vehicle type, sales channel, and region. On the basis of component, it is divided into head unit, speaker, amplifier, subwoofer, and others. On the basis of make, it is classified into branded, and non-branded. On the basis of vehicle type, it is classified into ICE, and EV. On the basis of sales channel, it is classified into OEM, and aftermarket. On the basis of region, the market is analyzed across North America, Europe, Asia-Pacific, and LAMEA.
Growth drivers, restraints, and opportunities are explained in the study to better understand the market dynamics. This study further highlights key areas of investment. In addition, it includes Porter's five forces analysis to understand the competitive scenario of the industry and the role of each stakeholder. The study features strategies adopted by key market players to maintain their foothold in the market.
Companies have adopted product development, partnership, and product launch as their key development strategies in the in-car audio system market.
The key players operating in this market are: Alpine Electronics, Inc., Bang & Olufsen, Blaupunkt GmbH, Clarion Co., Ltd., HARMAN International, JLAudio, JVC Kenwood Holdings Inc., Panasonic Industry Co., Ltd., Pioneer Corporation, and Sony Group Corporation.
Key Benefits For Stakeholders
- This report provides a quantitative analysis of the market segments, current trends, estimations, and dynamics of the in car audio system market analysis from 2022 to 2032 to identify the prevailing in car audio system market opportunities.
- The market research is offered along with information related to key drivers, restraints, and opportunities.
- Porter's five forces analysis highlights the potency of buyers and suppliers to enable stakeholders make profit-oriented business decisions and strengthen their supplier-buyer network.
- In-depth analysis of the in car audio system market segmentation assists to determine the prevailing market opportunities.
- Major countries in each region are mapped according to their revenue contribution to the global market.
- Market player positioning facilitates benchmarking and provides a clear understanding of the present position of the market players.
- The report includes the analysis of the regional as well as global in car audio system market trends, key players, market segments, application areas, and market growth strategies.
Key Market Segments
By Component
- Speaker
- Amplifier
- Subwoofer
- Others
- Head Unit
By Manufacturer
- Branded
- Non-Branded
By Vehicle Type
- ICE
- EV
By Sales Channel
- OEM
- Aftermarket
By Region
- North America
- U.S.
- Canada
- Mexico
- Europe
- UK
- Germany
- Italy
- France
- Russia
- Rest of Europe
- Asia-Pacific
- China
- Japan
- India
- South Korea
- Rest of Asia-Pacific
- LAMEA
- Latin America
- Middle East
- Africa
Key Market Players:
- Panasonic Industry Co., Ltd.
- Sony group corporation
- JVCKENWOOD Corporation
- ALPS ALPINE CO., LTD.
- Bang & Olufsen
- FORVIA Faurecia
- Blaupunkt
- Pioneer Corporation
- HARMAN International
- JLAudio
TABLE OF CONTENTS
CHAPTER 1: INTRODUCTION
- 1.1. Report description
- 1.2. Key market segments
- 1.3. Key benefits to the stakeholders
- 1.4. Research Methodology
- 1.4.1. Primary research
- 1.4.2. Secondary research
- 1.4.3. Analyst tools and models
CHAPTER 2: EXECUTIVE SUMMARY
- 2.1. CXO Perspective
CHAPTER 3: MARKET OVERVIEW
- 3.1. Market definition and scope
- 3.2. Key findings
- 3.2.1. Top impacting factors
- 3.2.2. Top investment pockets
- 3.3. Porter's five forces analysis
- 3.3.1. Bargaining power of suppliers
- 3.3.2. Bargaining power of buyers
- 3.3.3. Threat of substitutes
- 3.3.4. Threat of new entrants
- 3.3.5. Intensity of rivalry
- 3.4. Market dynamics
- 3.4.1. Drivers
- 3.4.1.1. Adoption of IOT and ADAS in in-car audio system
- 3.4.1.2. Increasing demand for high quality sound systems in luxury cars
- 3.4.1.3. Rising sales of passenger cars to support the growth of in-car audio system
- 3.4.1. Drivers
- 3.4.2. Restraints
- 3.4.2.1. High cost of in car audio system to act as a barrier
- 3.4.2.2. Huge competition from other audio sources
- 3.4.3. Opportunities
- 3.4.3.1. Growing demand for connected cars
- 3.4.3.2. Geographical expansions and technological advancements to offer huge opportunity for manufacturers
- 3.5. COVID-19 Impact Analysis on the market
CHAPTER 4: IN CAR AUDIO SYSTEM MARKET, BY COMPONENT
- 4.1. Overview
- 4.1.1. Market size and forecast
- 4.2. Head Unit
- 4.2.1. Key market trends, growth factors and opportunities
- 4.2.2. Market size and forecast, by region
- 4.2.3. Market share analysis by country
- 4.3. Speaker
- 4.3.1. Key market trends, growth factors and opportunities
- 4.3.2. Market size and forecast, by region
- 4.3.3. Market share analysis by country
- 4.4. Amplifier
- 4.4.1. Key market trends, growth factors and opportunities
- 4.4.2. Market size and forecast, by region
- 4.4.3. Market share analysis by country
- 4.5. Subwoofer
- 4.5.1. Key market trends, growth factors and opportunities
- 4.5.2. Market size and forecast, by region
- 4.5.3. Market share analysis by country
- 4.6. Others
- 4.6.1. Key market trends, growth factors and opportunities
- 4.6.2. Market size and forecast, by region
- 4.6.3. Market share analysis by country
CHAPTER 5: IN CAR AUDIO SYSTEM MARKET, BY MANUFACTURER
- 5.1. Overview
- 5.1.1. Market size and forecast
- 5.2. Branded
- 5.2.1. Key market trends, growth factors and opportunities
- 5.2.2. Market size and forecast, by region
- 5.2.3. Market share analysis by country
- 5.3. Non-Branded
- 5.3.1. Key market trends, growth factors and opportunities
- 5.3.2. Market size and forecast, by region
- 5.3.3. Market share analysis by country
CHAPTER 6: IN CAR AUDIO SYSTEM MARKET, BY VEHICLE TYPE
- 6.1. Overview
- 6.1.1. Market size and forecast
- 6.2. ICE
- 6.2.1. Key market trends, growth factors and opportunities
- 6.2.2. Market size and forecast, by region
- 6.2.3. Market share analysis by country
- 6.3. EV
- 6.3.1. Key market trends, growth factors and opportunities
- 6.3.2. Market size and forecast, by region
- 6.3.3. Market share analysis by country
CHAPTER 7: IN CAR AUDIO SYSTEM MARKET, BY SALES CHANNEL
- 7.1. Overview
- 7.1.1. Market size and forecast
- 7.2. OEM
- 7.2.1. Key market trends, growth factors and opportunities
- 7.2.2. Market size and forecast, by region
- 7.2.3. Market share analysis by country
- 7.3. Aftermarket
- 7.3.1. Key market trends, growth factors and opportunities
- 7.3.2. Market size and forecast, by region
- 7.3.3. Market share analysis by country
CHAPTER 8: IN CAR AUDIO SYSTEM MARKET, BY REGION
- 8.1. Overview
- 8.1.1. Market size and forecast By Region
- 8.2. North America
- 8.2.1. Key trends and opportunities
- 8.2.2. Market size and forecast, by Component
- 8.2.3. Market size and forecast, by Manufacturer
- 8.2.4. Market size and forecast, by Vehicle Type
- 8.2.5. Market size and forecast, by Sales Channel
- 8.2.6. Market size and forecast, by country
- 8.2.6.1. U.S.
- 8.2.6.1.1. Key market trends, growth factors and opportunities
- 8.2.6.1.2. Market size and forecast, by Component
- 8.2.6.1.3. Market size and forecast, by Manufacturer
- 8.2.6.1.4. Market size and forecast, by Vehicle Type
- 8.2.6.1.5. Market size and forecast, by Sales Channel
- 8.2.6.2. Canada
- 8.2.6.2.1. Key market trends, growth factors and opportunities
- 8.2.6.2.2. Market size and forecast, by Component
- 8.2.6.2.3. Market size and forecast, by Manufacturer
- 8.2.6.2.4. Market size and forecast, by Vehicle Type
- 8.2.6.2.5. Market size and forecast, by Sales Channel
- 8.2.6.3. Mexico
- 8.2.6.3.1. Key market trends, growth factors and opportunities
- 8.2.6.3.2. Market size and forecast, by Component
- 8.2.6.3.3. Market size and forecast, by Manufacturer
- 8.2.6.3.4. Market size and forecast, by Vehicle Type
- 8.2.6.3.5. Market size and forecast, by Sales Channel
- 8.3. Europe
- 8.3.1. Key trends and opportunities
- 8.3.2. Market size and forecast, by Component
- 8.3.3. Market size and forecast, by Manufacturer
- 8.3.4. Market size and forecast, by Vehicle Type
- 8.3.5. Market size and forecast, by Sales Channel
- 8.3.6. Market size and forecast, by country
- 8.3.6.1. UK
- 8.3.6.1.1. Key market trends, growth factors and opportunities
- 8.3.6.1.2. Market size and forecast, by Component
- 8.3.6.1.3. Market size and forecast, by Manufacturer
- 8.3.6.1.4. Market size and forecast, by Vehicle Type
- 8.3.6.1.5. Market size and forecast, by Sales Channel
- 8.3.6.2. Germany
- 8.3.6.2.1. Key market trends, growth factors and opportunities
- 8.3.6.2.2. Market size and forecast, by Component
- 8.3.6.2.3. Market size and forecast, by Manufacturer
- 8.3.6.2.4. Market size and forecast, by Vehicle Type
- 8.3.6.2.5. Market size and forecast, by Sales Channel
- 8.3.6.3. Italy
- 8.3.6.3.1. Key market trends, growth factors and opportunities
- 8.3.6.3.2. Market size and forecast, by Component
- 8.3.6.3.3. Market size and forecast, by Manufacturer
- 8.3.6.3.4. Market size and forecast, by Vehicle Type
- 8.3.6.3.5. Market size and forecast, by Sales Channel
- 8.3.6.4. France
- 8.3.6.4.1. Key market trends, growth factors and opportunities
- 8.3.6.4.2. Market size and forecast, by Component
- 8.3.6.4.3. Market size and forecast, by Manufacturer
- 8.3.6.4.4. Market size and forecast, by Vehicle Type
- 8.3.6.4.5. Market size and forecast, by Sales Channel
- 8.3.6.5. Russia
- 8.3.6.5.1. Key market trends, growth factors and opportunities
- 8.3.6.5.2. Market size and forecast, by Component
- 8.3.6.5.3. Market size and forecast, by Manufacturer
- 8.3.6.5.4. Market size and forecast, by Vehicle Type
- 8.3.6.5.5. Market size and forecast, by Sales Channel
- 8.3.6.6. Rest of Europe
- 8.3.6.6.1. Key market trends, growth factors and opportunities
- 8.3.6.6.2. Market size and forecast, by Component
- 8.3.6.6.3. Market size and forecast, by Manufacturer
- 8.3.6.6.4. Market size and forecast, by Vehicle Type
- 8.3.6.6.5. Market size and forecast, by Sales Channel
- 8.4. Asia-Pacific
- 8.4.1. Key trends and opportunities
- 8.4.2. Market size and forecast, by Component
- 8.4.3. Market size and forecast, by Manufacturer
- 8.4.4. Market size and forecast, by Vehicle Type
- 8.4.5. Market size and forecast, by Sales Channel
- 8.4.6. Market size and forecast, by country
- 8.4.6.1. China
- 8.4.6.1.1. Key market trends, growth factors and opportunities
- 8.4.6.1.2. Market size and forecast, by Component
- 8.4.6.1.3. Market size and forecast, by Manufacturer
- 8.4.6.1.4. Market size and forecast, by Vehicle Type
- 8.4.6.1.5. Market size and forecast, by Sales Channel
- 8.4.6.2. Japan
- 8.4.6.2.1. Key market trends, growth factors and opportunities
- 8.4.6.2.2. Market size and forecast, by Component
- 8.4.6.2.3. Market size and forecast, by Manufacturer
- 8.4.6.2.4. Market size and forecast, by Vehicle Type
- 8.4.6.2.5. Market size and forecast, by Sales Channel
- 8.4.6.3. India
- 8.4.6.3.1. Key market trends, growth factors and opportunities
- 8.4.6.3.2. Market size and forecast, by Component
- 8.4.6.3.3. Market size and forecast, by Manufacturer
- 8.4.6.3.4. Market size and forecast, by Vehicle Type
- 8.4.6.3.5. Market size and forecast, by Sales Channel
- 8.4.6.4. South Korea
- 8.4.6.4.1. Key market trends, growth factors and opportunities
- 8.4.6.4.2. Market size and forecast, by Component
- 8.4.6.4.3. Market size and forecast, by Manufacturer
- 8.4.6.4.4. Market size and forecast, by Vehicle Type
- 8.4.6.4.5. Market size and forecast, by Sales Channel
- 8.4.6.5. Rest of Asia-Pacific
- 8.4.6.5.1. Key market trends, growth factors and opportunities
- 8.4.6.5.2. Market size and forecast, by Component
- 8.4.6.5.3. Market size and forecast, by Manufacturer
- 8.4.6.5.4. Market size and forecast, by Vehicle Type
- 8.4.6.5.5. Market size and forecast, by Sales Channel
- 8.5. LAMEA
- 8.5.1. Key trends and opportunities
- 8.5.2. Market size and forecast, by Component
- 8.5.3. Market size and forecast, by Manufacturer
- 8.5.4. Market size and forecast, by Vehicle Type
- 8.5.5. Market size and forecast, by Sales Channel
- 8.5.6. Market size and forecast, by country
- 8.5.6.1. Latin America
- 8.5.6.1.1. Key market trends, growth factors and opportunities
- 8.5.6.1.2. Market size and forecast, by Component
- 8.5.6.1.3. Market size and forecast, by Manufacturer
- 8.5.6.1.4. Market size and forecast, by Vehicle Type
- 8.5.6.1.5. Market size and forecast, by Sales Channel
- 8.5.6.2. Middle East
- 8.5.6.2.1. Key market trends, growth factors and opportunities
- 8.5.6.2.2. Market size and forecast, by Component
- 8.5.6.2.3. Market size and forecast, by Manufacturer
- 8.5.6.2.4. Market size and forecast, by Vehicle Type
- 8.5.6.2.5. Market size and forecast, by Sales Channel
- 8.5.6.3. Africa
- 8.5.6.3.1. Key market trends, growth factors and opportunities
- 8.5.6.3.2. Market size and forecast, by Component
- 8.5.6.3.3. Market size and forecast, by Manufacturer
- 8.5.6.3.4. Market size and forecast, by Vehicle Type
- 8.5.6.3.5. Market size and forecast, by Sales Channel
CHAPTER 9: COMPETITIVE LANDSCAPE
- 9.1. Introduction
- 9.2. Top winning strategies
- 9.3. Product Mapping of Top 10 Player
- 9.4. Competitive Dashboard
- 9.5. Competitive Heatmap
- 9.6. Top player positioning, 2022
CHAPTER 10: COMPANY PROFILES
- 10.1. ALPS ALPINE CO., LTD.
- 10.1.1. Company overview
- 10.1.2. Key Executives
- 10.1.3. Company snapshot
- 10.1.4. Operating business segments
- 10.1.5. Product portfolio
- 10.1.6. Business performance
- 10.1.7. Key strategic moves and developments
- 10.2. Bang & Olufsen
- 10.2.1. Company overview
- 10.2.2. Key Executives
- 10.2.3. Company snapshot
- 10.2.4. Operating business segments
- 10.2.5. Product portfolio
- 10.2.6. Business performance
- 10.3. Blaupunkt
- 10.3.1. Company overview
- 10.3.2. Key Executives
- 10.3.3. Company snapshot
- 10.3.4. Operating business segments
- 10.3.5. Product portfolio
- 10.3.6. Key strategic moves and developments
- 10.4. FORVIA Faurecia
- 10.4.1. Company overview
- 10.4.2. Key Executives
- 10.4.3. Company snapshot
- 10.4.4. Operating business segments
- 10.4.5. Product portfolio
- 10.4.6. Business performance
- 10.5. HARMAN International
- 10.5.1. Company overview
- 10.5.2. Key Executives
- 10.5.3. Company snapshot
- 10.5.4. Operating business segments
- 10.5.5. Product portfolio
- 10.5.6. Key strategic moves and developments
- 10.6. JLAudio
- 10.6.1. Company overview
- 10.6.2. Key Executives
- 10.6.3. Company snapshot
- 10.6.4. Operating business segments
- 10.6.5. Product portfolio
- 10.6.6. Key strategic moves and developments
- 10.7. JVCKENWOOD Corporation
- 10.7.1. Company overview
- 10.7.2. Key Executives
- 10.7.3. Company snapshot
- 10.7.4. Operating business segments
- 10.7.5. Product portfolio
- 10.7.6. Business performance
- 10.8. Panasonic Industry Co., Ltd.
- 10.8.1. Company overview
- 10.8.2. Key Executives
- 10.8.3. Company snapshot
- 10.8.4. Operating business segments
- 10.8.5. Product portfolio
- 10.8.6. Business performance
- 10.9. Pioneer Corporation
- 10.9.1. Company overview
- 10.9.2. Key Executives
- 10.9.3. Company snapshot
- 10.9.4. Operating business segments
- 10.9.5. Product portfolio
- 10.9.6. Key strategic moves and developments
- 10.10. Sony group corporation
- 10.10.1. Company overview
- 10.10.2. Key Executives
- 10.10.3. Company snapshot
- 10.10.4. Operating business segments
- 10.10.5. Product portfolio
- 10.10.6. Business performance
- 10.10.7. Key strategic moves and developments
LIST OF TABLES
- TABLE 01. GLOBAL IN CAR AUDIO SYSTEM MARKET, BY COMPONENT, 2022-2032 ($MILLION)
- TABLE 02. IN CAR AUDIO SYSTEM MARKET FOR HEAD UNIT, BY REGION, 2022-2032 ($MILLION)
- TABLE 03. IN CAR AUDIO SYSTEM MARKET FOR SPEAKER, BY REGION, 2022-2032 ($MILLION)
- TABLE 04. IN CAR AUDIO SYSTEM MARKET FOR AMPLIFIER, BY REGION, 2022-2032 ($MILLION)
- TABLE 05. IN CAR AUDIO SYSTEM MARKET FOR SUBWOOFER, BY REGION, 2022-2032 ($MILLION)
- TABLE 06. IN CAR AUDIO SYSTEM MARKET FOR OTHERS, BY REGION, 2022-2032 ($MILLION)
- TABLE 07. GLOBAL IN CAR AUDIO SYSTEM MARKET, BY MANUFACTURER, 2022-2032 ($MILLION)
- TABLE 08. IN CAR AUDIO SYSTEM MARKET FOR BRANDED, BY REGION, 2022-2032 ($MILLION)
- TABLE 09. IN CAR AUDIO SYSTEM MARKET FOR NON-BRANDED, BY REGION, 2022-2032 ($MILLION)
- TABLE 10. GLOBAL IN CAR AUDIO SYSTEM MARKET, BY VEHICLE TYPE, 2022-2032 ($MILLION)
- TABLE 11. IN CAR AUDIO SYSTEM MARKET FOR ICE, BY REGION, 2022-2032 ($MILLION)
- TABLE 12. IN CAR AUDIO SYSTEM MARKET FOR EV, BY REGION, 2022-2032 ($MILLION)
- TABLE 13. GLOBAL IN CAR AUDIO SYSTEM MARKET, BY SALES CHANNEL, 2022-2032 ($MILLION)
- TABLE 14. IN CAR AUDIO SYSTEM MARKET FOR OEM, BY REGION, 2022-2032 ($MILLION)
- TABLE 15. IN CAR AUDIO SYSTEM MARKET FOR AFTERMARKET, BY REGION, 2022-2032 ($MILLION)
- TABLE 16. IN CAR AUDIO SYSTEM MARKET, BY REGION, 2022-2032 ($MILLION)
- TABLE 17. NORTH AMERICA IN CAR AUDIO SYSTEM MARKET, BY COMPONENT, 2022-2032 ($MILLION)
- TABLE 18. NORTH AMERICA IN CAR AUDIO SYSTEM MARKET, BY MANUFACTURER, 2022-2032 ($MILLION)
- TABLE 19. NORTH AMERICA IN CAR AUDIO SYSTEM MARKET, BY VEHICLE TYPE, 2022-2032 ($MILLION)
- TABLE 20. NORTH AMERICA IN CAR AUDIO SYSTEM MARKET, BY SALES CHANNEL, 2022-2032 ($MILLION)
- TABLE 21. NORTH AMERICA IN CAR AUDIO SYSTEM MARKET, BY COUNTRY, 2022-2032 ($MILLION)
- TABLE 22. U.S. IN CAR AUDIO SYSTEM MARKET, BY COMPONENT, 2022-2032 ($MILLION)
- TABLE 23. U.S. IN CAR AUDIO SYSTEM MARKET, BY MANUFACTURER, 2022-2032 ($MILLION)
- TABLE 24. U.S. IN CAR AUDIO SYSTEM MARKET, BY VEHICLE TYPE, 2022-2032 ($MILLION)
- TABLE 25. U.S. IN CAR AUDIO SYSTEM MARKET, BY SALES CHANNEL, 2022-2032 ($MILLION)
- TABLE 26. CANADA IN CAR AUDIO SYSTEM MARKET, BY COMPONENT, 2022-2032 ($MILLION)
- TABLE 27. CANADA IN CAR AUDIO SYSTEM MARKET, BY MANUFACTURER, 2022-2032 ($MILLION)
- TABLE 28. CANADA IN CAR AUDIO SYSTEM MARKET, BY VEHICLE TYPE, 2022-2032 ($MILLION)
- TABLE 29. CANADA IN CAR AUDIO SYSTEM MARKET, BY SALES CHANNEL, 2022-2032 ($MILLION)
- TABLE 30. MEXICO IN CAR AUDIO SYSTEM MARKET, BY COMPONENT, 2022-2032 ($MILLION)
- TABLE 31. MEXICO IN CAR AUDIO SYSTEM MARKET, BY MANUFACTURER, 2022-2032 ($MILLION)
- TABLE 32. MEXICO IN CAR AUDIO SYSTEM MARKET, BY VEHICLE TYPE, 2022-2032 ($MILLION)
- TABLE 33. MEXICO IN CAR AUDIO SYSTEM MARKET, BY SALES CHANNEL, 2022-2032 ($MILLION)
- TABLE 34. EUROPE IN CAR AUDIO SYSTEM MARKET, BY COMPONENT, 2022-2032 ($MILLION)
- TABLE 35. EUROPE IN CAR AUDIO SYSTEM MARKET, BY MANUFACTURER, 2022-2032 ($MILLION)
- TABLE 36. EUROPE IN CAR AUDIO SYSTEM MARKET, BY VEHICLE TYPE, 2022-2032 ($MILLION)
- TABLE 37. EUROPE IN CAR AUDIO SYSTEM MARKET, BY SALES CHANNEL, 2022-2032 ($MILLION)
- TABLE 38. EUROPE IN CAR AUDIO SYSTEM MARKET, BY COUNTRY, 2022-2032 ($MILLION)
- TABLE 39. UK IN CAR AUDIO SYSTEM MARKET, BY COMPONENT, 2022-2032 ($MILLION)
- TABLE 40. UK IN CAR AUDIO SYSTEM MARKET, BY MANUFACTURER, 2022-2032 ($MILLION)
- TABLE 41. UK IN CAR AUDIO SYSTEM MARKET, BY VEHICLE TYPE, 2022-2032 ($MILLION)
- TABLE 42. UK IN CAR AUDIO SYSTEM MARKET, BY SALES CHANNEL, 2022-2032 ($MILLION)
- TABLE 43. GERMANY IN CAR AUDIO SYSTEM MARKET, BY COMPONENT, 2022-2032 ($MILLION)
- TABLE 44. GERMANY IN CAR AUDIO SYSTEM MARKET, BY MANUFACTURER, 2022-2032 ($MILLION)
- TABLE 45. GERMANY IN CAR AUDIO SYSTEM MARKET, BY VEHICLE TYPE, 2022-2032 ($MILLION)
- TABLE 46. GERMANY IN CAR AUDIO SYSTEM MARKET, BY SALES CHANNEL, 2022-2032 ($MILLION)
- TABLE 47. ITALY IN CAR AUDIO SYSTEM MARKET, BY COMPONENT, 2022-2032 ($MILLION)
- TABLE 48. ITALY IN CAR AUDIO SYSTEM MARKET, BY MANUFACTURER, 2022-2032 ($MILLION)
- TABLE 49. ITALY IN CAR AUDIO SYSTEM MARKET, BY VEHICLE TYPE, 2022-2032 ($MILLION)
- TABLE 50. ITALY IN CAR AUDIO SYSTEM MARKET, BY SALES CHANNEL, 2022-2032 ($MILLION)
- TABLE 51. FRANCE IN CAR AUDIO SYSTEM MARKET, BY COMPONENT, 2022-2032 ($MILLION)
- TABLE 52. FRANCE IN CAR AUDIO SYSTEM MARKET, BY MANUFACTURER, 2022-2032 ($MILLION)
- TABLE 53. FRANCE IN CAR AUDIO SYSTEM MARKET, BY VEHICLE TYPE, 2022-2032 ($MILLION)
- TABLE 54. FRANCE IN CAR AUDIO SYSTEM MARKET, BY SALES CHANNEL, 2022-2032 ($MILLION)
- TABLE 55. RUSSIA IN CAR AUDIO SYSTEM MARKET, BY COMPONENT, 2022-2032 ($MILLION)
- TABLE 56. RUSSIA IN CAR AUDIO SYSTEM MARKET, BY MANUFACTURER, 2022-2032 ($MILLION)
- TABLE 57. RUSSIA IN CAR AUDIO SYSTEM MARKET, BY VEHICLE TYPE, 2022-2032 ($MILLION)
- TABLE 58. RUSSIA IN CAR AUDIO SYSTEM MARKET, BY SALES CHANNEL, 2022-2032 ($MILLION)
- TABLE 59. REST OF EUROPE IN CAR AUDIO SYSTEM MARKET, BY COMPONENT, 2022-2032 ($MILLION)
- TABLE 60. REST OF EUROPE IN CAR AUDIO SYSTEM MARKET, BY MANUFACTURER, 2022-2032 ($MILLION)
- TABLE 61. REST OF EUROPE IN CAR AUDIO SYSTEM MARKET, BY VEHICLE TYPE, 2022-2032 ($MILLION)
- TABLE 62. REST OF EUROPE IN CAR AUDIO SYSTEM MARKET, BY SALES CHANNEL, 2022-2032 ($MILLION)
- TABLE 63. ASIA-PACIFIC IN CAR AUDIO SYSTEM MARKET, BY COMPONENT, 2022-2032 ($MILLION)
- TABLE 64. ASIA-PACIFIC IN CAR AUDIO SYSTEM MARKET, BY MANUFACTURER, 2022-2032 ($MILLION)
- TABLE 65. ASIA-PACIFIC IN CAR AUDIO SYSTEM MARKET, BY VEHICLE TYPE, 2022-2032 ($MILLION)
- TABLE 66. ASIA-PACIFIC IN CAR AUDIO SYSTEM MARKET, BY SALES CHANNEL, 2022-2032 ($MILLION)
- TABLE 67. ASIA-PACIFIC IN CAR AUDIO SYSTEM MARKET, BY COUNTRY, 2022-2032 ($MILLION)
- TABLE 68. CHINA IN CAR AUDIO SYSTEM MARKET, BY COMPONENT, 2022-2032 ($MILLION)
- TABLE 69. CHINA IN CAR AUDIO SYSTEM MARKET, BY MANUFACTURER, 2022-2032 ($MILLION)
- TABLE 70. CHINA IN CAR AUDIO SYSTEM MARKET, BY VEHICLE TYPE, 2022-2032 ($MILLION)
- TABLE 71. CHINA IN CAR AUDIO SYSTEM MARKET, BY SALES CHANNEL, 2022-2032 ($MILLION)
- TABLE 72. JAPAN IN CAR AUDIO SYSTEM MARKET, BY COMPONENT, 2022-2032 ($MILLION)
- TABLE 73. JAPAN IN CAR AUDIO SYSTEM MARKET, BY MANUFACTURER, 2022-2032 ($MILLION)
- TABLE 74. JAPAN IN CAR AUDIO SYSTEM MARKET, BY VEHICLE TYPE, 2022-2032 ($MILLION)
- TABLE 75. JAPAN IN CAR AUDIO SYSTEM MARKET, BY SALES CHANNEL, 2022-2032 ($MILLION)
- TABLE 76. INDIA IN CAR AUDIO SYSTEM MARKET, BY COMPONENT, 2022-2032 ($MILLION)
- TABLE 77. INDIA IN CAR AUDIO SYSTEM MARKET, BY MANUFACTURER, 2022-2032 ($MILLION)
- TABLE 78. INDIA IN CAR AUDIO SYSTEM MARKET, BY VEHICLE TYPE, 2022-2032 ($MILLION)
- TABLE 79. INDIA IN CAR AUDIO SYSTEM MARKET, BY SALES CHANNEL, 2022-2032 ($MILLION)
- TABLE 80. SOUTH KOREA IN CAR AUDIO SYSTEM MARKET, BY COMPONENT, 2022-2032 ($MILLION)
- TABLE 81. SOUTH KOREA IN CAR AUDIO SYSTEM MARKET, BY MANUFACTURER, 2022-2032 ($MILLION)
- TABLE 82. SOUTH KOREA IN CAR AUDIO SYSTEM MARKET, BY VEHICLE TYPE, 2022-2032 ($MILLION)
- TABLE 83. SOUTH KOREA IN CAR AUDIO SYSTEM MARKET, BY SALES CHANNEL, 2022-2032 ($MILLION)
- TABLE 84. REST OF ASIA-PACIFIC IN CAR AUDIO SYSTEM MARKET, BY COMPONENT, 2022-2032 ($MILLION)
- TABLE 85. REST OF ASIA-PACIFIC IN CAR AUDIO SYSTEM MARKET, BY MANUFACTURER, 2022-2032 ($MILLION)
- TABLE 86. REST OF ASIA-PACIFIC IN CAR AUDIO SYSTEM MARKET, BY VEHICLE TYPE, 2022-2032 ($MILLION)
- TABLE 87. REST OF ASIA-PACIFIC IN CAR AUDIO SYSTEM MARKET, BY SALES CHANNEL, 2022-2032 ($MILLION)
- TABLE 88. LAMEA IN CAR AUDIO SYSTEM MARKET, BY COMPONENT, 2022-2032 ($MILLION)
- TABLE 89. LAMEA IN CAR AUDIO SYSTEM MARKET, BY MANUFACTURER, 2022-2032 ($MILLION)
- TABLE 90. LAMEA IN CAR AUDIO SYSTEM MARKET, BY VEHICLE TYPE, 2022-2032 ($MILLION)
- TABLE 91. LAMEA IN CAR AUDIO SYSTEM MARKET, BY SALES CHANNEL, 2022-2032 ($MILLION)
- TABLE 92. LAMEA IN CAR AUDIO SYSTEM MARKET, BY COUNTRY, 2022-2032 ($MILLION)
- TABLE 93. LATIN AMERICA IN CAR AUDIO SYSTEM MARKET, BY COMPONENT, 2022-2032 ($MILLION)
- TABLE 94. LATIN AMERICA IN CAR AUDIO SYSTEM MARKET, BY MANUFACTURER, 2022-2032 ($MILLION)
- TABLE 95. LATIN AMERICA IN CAR AUDIO SYSTEM MARKET, BY VEHICLE TYPE, 2022-2032 ($MILLION)
- TABLE 96. LATIN AMERICA IN CAR AUDIO SYSTEM MARKET, BY SALES CHANNEL, 2022-2032 ($MILLION)
- TABLE 97. MIDDLE EAST IN CAR AUDIO SYSTEM MARKET, BY COMPONENT, 2022-2032 ($MILLION)
- TABLE 98. MIDDLE EAST IN CAR AUDIO SYSTEM MARKET, BY MANUFACTURER, 2022-2032 ($MILLION)
- TABLE 99. MIDDLE EAST IN CAR AUDIO SYSTEM MARKET, BY VEHICLE TYPE, 2022-2032 ($MILLION)
- TABLE 100. MIDDLE EAST IN CAR AUDIO SYSTEM MARKET, BY SALES CHANNEL, 2022-2032 ($MILLION)
- TABLE 101. AFRICA IN CAR AUDIO SYSTEM MARKET, BY COMPONENT, 2022-2032 ($MILLION)
- TABLE 102. AFRICA IN CAR AUDIO SYSTEM MARKET, BY MANUFACTURER, 2022-2032 ($MILLION)
- TABLE 103. AFRICA IN CAR AUDIO SYSTEM MARKET, BY VEHICLE TYPE, 2022-2032 ($MILLION)
- TABLE 104. AFRICA IN CAR AUDIO SYSTEM MARKET, BY SALES CHANNEL, 2022-2032 ($MILLION)
- TABLE 105. ALPS ALPINE CO., LTD.: KEY EXECUTIVES
- TABLE 106. ALPS ALPINE CO., LTD.: COMPANY SNAPSHOT
- TABLE 107. ALPS ALPINE CO., LTD.: PRODUCT SEGMENTS
- TABLE 108. ALPS ALPINE CO., LTD.: PRODUCT PORTFOLIO
- TABLE 109. ALPS ALPINE CO., LTD.: KEY STRATERGIES
- TABLE 110. BANG & OLUFSEN: KEY EXECUTIVES
- TABLE 111. BANG & OLUFSEN: COMPANY SNAPSHOT
- TABLE 112. BANG & OLUFSEN: PRODUCT SEGMENTS
- TABLE 113. BANG & OLUFSEN: PRODUCT PORTFOLIO
- TABLE 114. BLAUPUNKT: KEY EXECUTIVES
- TABLE 115. BLAUPUNKT: COMPANY SNAPSHOT
- TABLE 116. BLAUPUNKT: PRODUCT SEGMENTS
- TABLE 117. BLAUPUNKT: PRODUCT PORTFOLIO
- TABLE 118. BLAUPUNKT: KEY STRATERGIES
- TABLE 119. FORVIA FAURECIA: KEY EXECUTIVES
- TABLE 120. FORVIA FAURECIA: COMPANY SNAPSHOT
- TABLE 121. FORVIA FAURECIA: PRODUCT SEGMENTS
- TABLE 122. FORVIA FAURECIA: PRODUCT PORTFOLIO
- TABLE 123. HARMAN INTERNATIONAL: KEY EXECUTIVES
- TABLE 124. HARMAN INTERNATIONAL: COMPANY SNAPSHOT
- TABLE 125. HARMAN INTERNATIONAL: SERVICE SEGMENTS
- TABLE 126. HARMAN INTERNATIONAL: PRODUCT PORTFOLIO
- TABLE 127. HARMAN INTERNATIONAL: KEY STRATERGIES
- TABLE 128. JLAUDIO: KEY EXECUTIVES
- TABLE 129. JLAUDIO: COMPANY SNAPSHOT
- TABLE 130. JLAUDIO: PRODUCT SEGMENTS
- TABLE 131. JLAUDIO: PRODUCT PORTFOLIO
- TABLE 132. JLAUDIO: KEY STRATERGIES
- TABLE 133. JVCKENWOOD CORPORATION: KEY EXECUTIVES
- TABLE 134. JVCKENWOOD CORPORATION: COMPANY SNAPSHOT
- TABLE 135. JVCKENWOOD CORPORATION: PRODUCT SEGMENTS
- TABLE 136. JVCKENWOOD CORPORATION: PRODUCT PORTFOLIO
- TABLE 137. PANASONIC INDUSTRY CO., LTD.: KEY EXECUTIVES
- TABLE 138. PANASONIC INDUSTRY CO., LTD.: COMPANY SNAPSHOT
- TABLE 139. PANASONIC INDUSTRY CO., LTD.: PRODUCT SEGMENTS
- TABLE 140. PANASONIC INDUSTRY CO., LTD.: PRODUCT PORTFOLIO
- TABLE 141. PIONEER CORPORATION: KEY EXECUTIVES
- TABLE 142. PIONEER CORPORATION: COMPANY SNAPSHOT
- TABLE 143. PIONEER CORPORATION: PRODUCT SEGMENTS
- TABLE 144. PIONEER CORPORATION: PRODUCT PORTFOLIO
- TABLE 145. PIONEER CORPORATION: KEY STRATERGIES
- TABLE 146. SONY GROUP CORPORATION: KEY EXECUTIVES
- TABLE 147. SONY GROUP CORPORATION: COMPANY SNAPSHOT
- TABLE 148. SONY GROUP CORPORATION: SERVICE SEGMENTS
- TABLE 149. SONY GROUP CORPORATION: PRODUCT PORTFOLIO
- TABLE 150. SONY GROUP CORPORATION: KEY STRATERGIES
LIST OF FIGURES
- FIGURE 01. IN CAR AUDIO SYSTEM MARKET, 2022-2032
- FIGURE 02. SEGMENTATION OF IN CAR AUDIO SYSTEM MARKET, 2022-2032
- FIGURE 03. TOP INVESTMENT POCKETS IN IN CAR AUDIO SYSTEM MARKET (2023-2032)
- FIGURE 04. LOW BARGAINING POWER OF SUPPLIERS
- FIGURE 05. LOW BARGAINING POWER OF BUYERS
- FIGURE 06. LOW THREAT OF SUBSTITUTES
- FIGURE 07. LOW THREAT OF NEW ENTRANTS
- FIGURE 08. LOW INTENSITY OF RIVALRY
- FIGURE 09. DRIVERS, RESTRAINTS AND OPPORTUNITIES: GLOBALIN CAR AUDIO SYSTEM MARKET
- FIGURE 10. IN CAR AUDIO SYSTEM MARKET, BY COMPONENT, 2022(%)
- FIGURE 11. COMPARATIVE SHARE ANALYSIS OF IN CAR AUDIO SYSTEM MARKET FOR HEAD UNIT, BY COUNTRY 2022 AND 2032(%)
- FIGURE 12. COMPARATIVE SHARE ANALYSIS OF IN CAR AUDIO SYSTEM MARKET FOR SPEAKER, BY COUNTRY 2022 AND 2032(%)
- FIGURE 13. COMPARATIVE SHARE ANALYSIS OF IN CAR AUDIO SYSTEM MARKET FOR AMPLIFIER, BY COUNTRY 2022 AND 2032(%)
- FIGURE 14. COMPARATIVE SHARE ANALYSIS OF IN CAR AUDIO SYSTEM MARKET FOR SUBWOOFER, BY COUNTRY 2022 AND 2032(%)
- FIGURE 15. COMPARATIVE SHARE ANALYSIS OF IN CAR AUDIO SYSTEM MARKET FOR OTHERS, BY COUNTRY 2022 AND 2032(%)
- FIGURE 16. IN CAR AUDIO SYSTEM MARKET, BY MANUFACTURER, 2022(%)
- FIGURE 17. COMPARATIVE SHARE ANALYSIS OF IN CAR AUDIO SYSTEM MARKET FOR BRANDED, BY COUNTRY 2022 AND 2032(%)
- FIGURE 18. COMPARATIVE SHARE ANALYSIS OF IN CAR AUDIO SYSTEM MARKET FOR NON-BRANDED, BY COUNTRY 2022 AND 2032(%)
- FIGURE 19. IN CAR AUDIO SYSTEM MARKET, BY VEHICLE TYPE, 2022(%)
- FIGURE 20. COMPARATIVE SHARE ANALYSIS OF IN CAR AUDIO SYSTEM MARKET FOR ICE, BY COUNTRY 2022 AND 2032(%)
- FIGURE 21. COMPARATIVE SHARE ANALYSIS OF IN CAR AUDIO SYSTEM MARKET FOR EV, BY COUNTRY 2022 AND 2032(%)
- FIGURE 22. IN CAR AUDIO SYSTEM MARKET, BY SALES CHANNEL, 2022(%)
- FIGURE 23. COMPARATIVE SHARE ANALYSIS OF IN CAR AUDIO SYSTEM MARKET FOR OEM, BY COUNTRY 2022 AND 2032(%)
- FIGURE 24. COMPARATIVE SHARE ANALYSIS OF IN CAR AUDIO SYSTEM MARKET FOR AFTERMARKET, BY COUNTRY 2022 AND 2032(%)
- FIGURE 25. IN CAR AUDIO SYSTEM MARKET BY REGION, 2022
- FIGURE 26. U.S. IN CAR AUDIO SYSTEM MARKET, 2022-2032 ($MILLION)
- FIGURE 27. CANADA IN CAR AUDIO SYSTEM MARKET, 2022-2032 ($MILLION)
- FIGURE 28. MEXICO IN CAR AUDIO SYSTEM MARKET, 2022-2032 ($MILLION)
- FIGURE 29. UK IN CAR AUDIO SYSTEM MARKET, 2022-2032 ($MILLION)
- FIGURE 30. GERMANY IN CAR AUDIO SYSTEM MARKET, 2022-2032 ($MILLION)
- FIGURE 31. ITALY IN CAR AUDIO SYSTEM MARKET, 2022-2032 ($MILLION)
- FIGURE 32. FRANCE IN CAR AUDIO SYSTEM MARKET, 2022-2032 ($MILLION)
- FIGURE 33. RUSSIA IN CAR AUDIO SYSTEM MARKET, 2022-2032 ($MILLION)
- FIGURE 34. REST OF EUROPE IN CAR AUDIO SYSTEM MARKET, 2022-2032 ($MILLION)
- FIGURE 35. CHINA IN CAR AUDIO SYSTEM MARKET, 2022-2032 ($MILLION)
- FIGURE 36. JAPAN IN CAR AUDIO SYSTEM MARKET, 2022-2032 ($MILLION)
- FIGURE 37. INDIA IN CAR AUDIO SYSTEM MARKET, 2022-2032 ($MILLION)
- FIGURE 38. SOUTH KOREA IN CAR AUDIO SYSTEM MARKET, 2022-2032 ($MILLION)
- FIGURE 39. REST OF ASIA-PACIFIC IN CAR AUDIO SYSTEM MARKET, 2022-2032 ($MILLION)
- FIGURE 40. LATIN AMERICA IN CAR AUDIO SYSTEM MARKET, 2022-2032 ($MILLION)
- FIGURE 41. MIDDLE EAST IN CAR AUDIO SYSTEM MARKET, 2022-2032 ($MILLION)
- FIGURE 42. AFRICA IN CAR AUDIO SYSTEM MARKET, 2022-2032 ($MILLION)
- FIGURE 43. TOP WINNING STRATEGIES, BY YEAR
- FIGURE 44. TOP WINNING STRATEGIES, BY DEVELOPMENT
- FIGURE 45. TOP WINNING STRATEGIES, BY COMPANY
- FIGURE 46. PRODUCT MAPPING OF TOP 10 PLAYERS
- FIGURE 47. COMPETITIVE DASHBOARD
- FIGURE 48. COMPETITIVE HEATMAP: IN CAR AUDIO SYSTEM MARKET
- FIGURE 49. TOP PLAYER POSITIONING, 2022
- FIGURE 50. ALPS ALPINE CO., LTD.: NET SALES, 2020-2022 ($MILLION)
- FIGURE 51. ALPS ALPINE CO., LTD.: REVENUE SHARE BY SEGMENT, 2021 (%)
- FIGURE 52. BANG & OLUFSEN: NET REVENUE, 2019-2021 ($MILLION)
- FIGURE 53. BANG & OLUFSEN: REVENUE SHARE BY REGION, 2021 (%)
- FIGURE 54. BANG & OLUFSEN: REVENUE SHARE BY SEGMENT, 2021 (%)
- FIGURE 55. FORVIA FAURECIA: NET SALES, 2020-2022 ($MILLION)
- FIGURE 56. FORVIA FAURECIA: RESEARCH & DEVELOPMENT EXPENDITURE, 2020-2022 ($MILLION)
- FIGURE 57. FORVIA FAURECIA: REVENUE SHARE BY REGION, 2022 (%)
- FIGURE 58. FORVIA FAURECIA: REVENUE SHARE BY SEGMENT, 2022 (%)
- FIGURE 59. JVCKENWOOD CORPORATION: RESEARCH & DEVELOPMENT EXPENDITURE, 2019-2021 ($MILLION)
- FIGURE 60. JVCKENWOOD CORPORATION: NET REVENUE, 2019-2021 ($MILLION)
- FIGURE 61. JVCKENWOOD CORPORATION: REVENUE SHARE BY REGION, 2021 (%)
- FIGURE 62. JVCKENWOOD CORPORATION: REVENUE SHARE BY SEGMENT, 2021 (%)
- FIGURE 63. PANASONIC INDUSTRY CO., LTD.: NET REVENUE, 2020-2022 ($MILLION)
- FIGURE 64. PANASONIC INDUSTRY CO., LTD.: RESEARCH & DEVELOPMENT EXPENDITURE, 2020-2022 ($MILLION)
- FIGURE 65. PANASONIC INDUSTRY CO., LTD.: REVENUE SHARE BY REGION, 2022 (%)
- FIGURE 66. PANASONIC INDUSTRY CO., LTD.: REVENUE SHARE BY SEGMENT, 2022 (%)
- FIGURE 67. SONY GROUP CORPORATION: NET SALES, 2019-2021 ($BILLION)
- FIGURE 68. SONY GROUP CORPORATION: REVENUE SHARE BY REGION, 2021 (%)

