
PUBLISHER: Allied Market Research | PRODUCT CODE: 1344291

PUBLISHER: Allied Market Research | PRODUCT CODE: 1344291
Content Disarm And Reconstruction Market By Component, By Deployment Mode, By Organization Size, By Application, By End User : Global Opportunity Analysis and Industry Forecast, 2023-2032
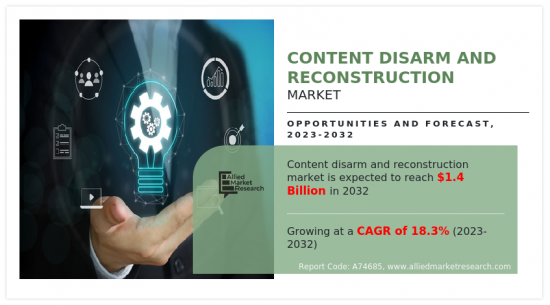
According to a new report published by Allied Market Research, titled, "Content Disarm And Reconstruction Market," The content disarm and reconstruction market was valued at $274.80 million in 2022, and is estimated to reach $1.4 billion by 2032, growing at a CAGR of 18.3% from 2023 to 2032.
Rise in incidents of cyber-attacks and data breaches and increase in government compliance and regulatory standards on cyber security are driving the growth of the market. In addition, surge in adoption of cloud-based security solution and services is fueling the growth of the content disarm and reconstruction market. However, high implementation cost of content disarm and reconstruction solution and Dearth of skilled cyber security professional and strategic planning limits the growth of this market. Conversely, rise in investments in in big data security solutions and surge in digital transformation initiatives across different industries are anticipated to provide numerous opportunities for the expansion of the market during the forecast period.
The global content disarm and reconstruction market is segmented into component, application area, deployment mode, organization size, vertical and region. Depending on the component, the market is divided into solution and services. Based on application area, it is categorized into email, web, File Transfer Protocol (FTP) and removable devices. By deployment mode, it is divided into on-premises and cloud. Based on organization size, it is bifurcated into telecom large enterprises and small & medium enterprises. By vertical BFSI, IT & telecom, energy & utilities, manufacturing, healthcare and others. Region-wise, it is analyzed across North America, Europe, Asia-Pacific, and LAMEA.
The global content disarm and reconstruction market is dominated by key players such as Broadcom Inc., Check Point Software Technologies Ltd., Deep Secure, Fortinet, Inc., Gatefy, Glasswall Solutions Limited, OPSWAT, Inc., Resec Technologies, Votiro and YazamTech. These players have adopted various strategies to increase their market penetration and strengthen their position in the industry.
KEY BENEFITS FOR STAKEHOLDERS
- The study provides an in-depth analysis of the global content disarm and reconstruction market forecast along with the current & future trends to explain the imminent investment pockets.
- Information about key drivers, restraints, & opportunities and their impact analysis on global content disarm and reconstruction market trends is provided in the report.
- Porter's five forces analysis illustrates the potency of the buyers and suppliers operating in the industry.
- The quantitative analysis of the market from 2023 to 2032 is provided to determine the market potential.
Key Market Segments
By Component
- Solution
- Services
By Deployment Mode
- On-Premises
- Cloud
By Organization Size
- Large Enterprises
- Small and Medium Sized Enterprises
By Application
- Web
- File Transfer Protocol
- Removable Devices
By End User
- BFSI
- IT and Telecom
- Energy and Utilities
- Manufacturing
- Healthcare
- Others
By Region
- North America
- U.S.
- Canada
- Europe
- UK
- Germany
- France
- Italy
- Spain
- Rest of Europe
- Asia-Pacific
- China
- Japan
- India
- Australia
- South Korea
- Rest of Asia-Pacific
- LAMEA
- Latin America
- Middle East
- Africa
Key Market Players:
- Gatefy
- YazamTech
- Broadcom Inc.
- Votiro
- Glasswall Solutions Limited
- Fortinet, Inc.
- Resec Technologies
- Deep Secure
- Check Point Software Technologies Ltd.
- OPSWAT, Inc.
TABLE OF CONTENTS
CHAPTER 1: INTRODUCTION
- 1.1. Report description
- 1.2. Key market segments
- 1.3. Key benefits to the stakeholders
- 1.4. Research Methodology
- 1.4.1. Primary research
- 1.4.2. Secondary research
- 1.4.3. Analyst tools and models
CHAPTER 2: EXECUTIVE SUMMARY
- 2.1. CXO Perspective
CHAPTER 3: MARKET OVERVIEW
- 3.1. Market definition and scope
- 3.2. Key findings
- 3.2.1. Top impacting factors
- 3.2.2. Top investment pockets
- 3.3. Porter's five forces analysis
- 3.3.1. Bargaining power of suppliers
- 3.3.2. Bargaining power of buyers
- 3.3.3. Threat of substitutes
- 3.3.4. Threat of new entrants
- 3.3.5. Intensity of rivalry
- 3.4. Market dynamics
- 3.4.1. Drivers
- 3.4.1.1. Increase in government compliance and regulatory standards on cyber security
- 3.4.1.2. Rise in incidents of cyber-attacks and data breaches
- 3.4.1.3. Surge in adoption of cloud-based security solutions and services
- 3.4.1. Drivers
- 3.4.2. Restraints
- 3.4.2.1. High implementation cost of content disarm and reconstruction solution
- 3.4.2.2. Dearth of skilled cybersecurity professionals and strategic planning
- 3.4.3. Opportunities
- 3.4.3.1. Surge in digital transformation initiatives across industries
- 3.4.3.2. Rise in investments in big data security solutions
- 3.5. COVID-19 Impact Analysis on the market
CHAPTER 4: CONTENT DISARM AND RECONSTRUCTION MARKET, BY COMPONENT
- 4.1. Overview
- 4.1.1. Market size and forecast
- 4.2. Solution
- 4.2.1. Key market trends, growth factors and opportunities
- 4.2.2. Market size and forecast, by region
- 4.2.3. Market share analysis by country
- 4.3. Services
- 4.3.1. Key market trends, growth factors and opportunities
- 4.3.2. Market size and forecast, by region
- 4.3.3. Market share analysis by country
CHAPTER 5: CONTENT DISARM AND RECONSTRUCTION MARKET, BY DEPLOYMENT MODE
- 5.1. Overview
- 5.1.1. Market size and forecast
- 5.2. On-Premises
- 5.2.1. Key market trends, growth factors and opportunities
- 5.2.2. Market size and forecast, by region
- 5.2.3. Market share analysis by country
- 5.3. Cloud
- 5.3.1. Key market trends, growth factors and opportunities
- 5.3.2. Market size and forecast, by region
- 5.3.3. Market share analysis by country
CHAPTER 6: CONTENT DISARM AND RECONSTRUCTION MARKET, BY ORGANIZATION SIZE
- 6.1. Overview
- 6.1.1. Market size and forecast
- 6.2. Large Enterprises
- 6.2.1. Key market trends, growth factors and opportunities
- 6.2.2. Market size and forecast, by region
- 6.2.3. Market share analysis by country
- 6.3. Small and Medium Sized Enterprises
- 6.3.1. Key market trends, growth factors and opportunities
- 6.3.2. Market size and forecast, by region
- 6.3.3. Market share analysis by country
CHAPTER 7: CONTENT DISARM AND RECONSTRUCTION MARKET, BY APPLICATION
- 7.1. Overview
- 7.1.1. Market size and forecast
- 7.2. Email
- 7.2.1. Key market trends, growth factors and opportunities
- 7.2.2. Market size and forecast, by region
- 7.2.3. Market share analysis by country
- 7.3. Web
- 7.3.1. Key market trends, growth factors and opportunities
- 7.3.2. Market size and forecast, by region
- 7.3.3. Market share analysis by country
- 7.4. File Transfer Protocol
- 7.4.1. Key market trends, growth factors and opportunities
- 7.4.2. Market size and forecast, by region
- 7.4.3. Market share analysis by country
- 7.5. Removable Devices
- 7.5.1. Key market trends, growth factors and opportunities
- 7.5.2. Market size and forecast, by region
- 7.5.3. Market share analysis by country
CHAPTER 8: CONTENT DISARM AND RECONSTRUCTION MARKET, BY END USER
- 8.1. Overview
- 8.1.1. Market size and forecast
- 8.2. BFSI
- 8.2.1. Key market trends, growth factors and opportunities
- 8.2.2. Market size and forecast, by region
- 8.2.3. Market share analysis by country
- 8.3. IT and Telecom
- 8.3.1. Key market trends, growth factors and opportunities
- 8.3.2. Market size and forecast, by region
- 8.3.3. Market share analysis by country
- 8.4. Energy and Utilities
- 8.4.1. Key market trends, growth factors and opportunities
- 8.4.2. Market size and forecast, by region
- 8.4.3. Market share analysis by country
- 8.5. Manufacturing
- 8.5.1. Key market trends, growth factors and opportunities
- 8.5.2. Market size and forecast, by region
- 8.5.3. Market share analysis by country
- 8.6. Healthcare
- 8.6.1. Key market trends, growth factors and opportunities
- 8.6.2. Market size and forecast, by region
- 8.6.3. Market share analysis by country
- 8.7. Others
- 8.7.1. Key market trends, growth factors and opportunities
- 8.7.2. Market size and forecast, by region
- 8.7.3. Market share analysis by country
CHAPTER 9: CONTENT DISARM AND RECONSTRUCTION MARKET, BY REGION
- 9.1. Overview
- 9.1.1. Market size and forecast By Region
- 9.2. North America
- 9.2.1. Key trends and opportunities
- 9.2.2. Market size and forecast, by Component
- 9.2.3. Market size and forecast, by Deployment Mode
- 9.2.4. Market size and forecast, by Organization Size
- 9.2.5. Market size and forecast, by Application
- 9.2.6. Market size and forecast, by End User
- 9.2.7. Market size and forecast, by country
- 9.2.7.1. U.S.
- 9.2.7.1.1. Key market trends, growth factors and opportunities
- 9.2.7.1.2. Market size and forecast, by Component
- 9.2.7.1.3. Market size and forecast, by Deployment Mode
- 9.2.7.1.4. Market size and forecast, by Organization Size
- 9.2.7.1.5. Market size and forecast, by Application
- 9.2.7.1.6. Market size and forecast, by End User
- 9.2.7.2. Canada
- 9.2.7.2.1. Key market trends, growth factors and opportunities
- 9.2.7.2.2. Market size and forecast, by Component
- 9.2.7.2.3. Market size and forecast, by Deployment Mode
- 9.2.7.2.4. Market size and forecast, by Organization Size
- 9.2.7.2.5. Market size and forecast, by Application
- 9.2.7.2.6. Market size and forecast, by End User
- 9.3. Europe
- 9.3.1. Key trends and opportunities
- 9.3.2. Market size and forecast, by Component
- 9.3.3. Market size and forecast, by Deployment Mode
- 9.3.4. Market size and forecast, by Organization Size
- 9.3.5. Market size and forecast, by Application
- 9.3.6. Market size and forecast, by End User
- 9.3.7. Market size and forecast, by country
- 9.3.7.1. UK
- 9.3.7.1.1. Key market trends, growth factors and opportunities
- 9.3.7.1.2. Market size and forecast, by Component
- 9.3.7.1.3. Market size and forecast, by Deployment Mode
- 9.3.7.1.4. Market size and forecast, by Organization Size
- 9.3.7.1.5. Market size and forecast, by Application
- 9.3.7.1.6. Market size and forecast, by End User
- 9.3.7.2. Germany
- 9.3.7.2.1. Key market trends, growth factors and opportunities
- 9.3.7.2.2. Market size and forecast, by Component
- 9.3.7.2.3. Market size and forecast, by Deployment Mode
- 9.3.7.2.4. Market size and forecast, by Organization Size
- 9.3.7.2.5. Market size and forecast, by Application
- 9.3.7.2.6. Market size and forecast, by End User
- 9.3.7.3. France
- 9.3.7.3.1. Key market trends, growth factors and opportunities
- 9.3.7.3.2. Market size and forecast, by Component
- 9.3.7.3.3. Market size and forecast, by Deployment Mode
- 9.3.7.3.4. Market size and forecast, by Organization Size
- 9.3.7.3.5. Market size and forecast, by Application
- 9.3.7.3.6. Market size and forecast, by End User
- 9.3.7.4. Italy
- 9.3.7.4.1. Key market trends, growth factors and opportunities
- 9.3.7.4.2. Market size and forecast, by Component
- 9.3.7.4.3. Market size and forecast, by Deployment Mode
- 9.3.7.4.4. Market size and forecast, by Organization Size
- 9.3.7.4.5. Market size and forecast, by Application
- 9.3.7.4.6. Market size and forecast, by End User
- 9.3.7.5. Spain
- 9.3.7.5.1. Key market trends, growth factors and opportunities
- 9.3.7.5.2. Market size and forecast, by Component
- 9.3.7.5.3. Market size and forecast, by Deployment Mode
- 9.3.7.5.4. Market size and forecast, by Organization Size
- 9.3.7.5.5. Market size and forecast, by Application
- 9.3.7.5.6. Market size and forecast, by End User
- 9.3.7.6. Rest of Europe
- 9.3.7.6.1. Key market trends, growth factors and opportunities
- 9.3.7.6.2. Market size and forecast, by Component
- 9.3.7.6.3. Market size and forecast, by Deployment Mode
- 9.3.7.6.4. Market size and forecast, by Organization Size
- 9.3.7.6.5. Market size and forecast, by Application
- 9.3.7.6.6. Market size and forecast, by End User
- 9.4. Asia-Pacific
- 9.4.1. Key trends and opportunities
- 9.4.2. Market size and forecast, by Component
- 9.4.3. Market size and forecast, by Deployment Mode
- 9.4.4. Market size and forecast, by Organization Size
- 9.4.5. Market size and forecast, by Application
- 9.4.6. Market size and forecast, by End User
- 9.4.7. Market size and forecast, by country
- 9.4.7.1. China
- 9.4.7.1.1. Key market trends, growth factors and opportunities
- 9.4.7.1.2. Market size and forecast, by Component
- 9.4.7.1.3. Market size and forecast, by Deployment Mode
- 9.4.7.1.4. Market size and forecast, by Organization Size
- 9.4.7.1.5. Market size and forecast, by Application
- 9.4.7.1.6. Market size and forecast, by End User
- 9.4.7.2. Japan
- 9.4.7.2.1. Key market trends, growth factors and opportunities
- 9.4.7.2.2. Market size and forecast, by Component
- 9.4.7.2.3. Market size and forecast, by Deployment Mode
- 9.4.7.2.4. Market size and forecast, by Organization Size
- 9.4.7.2.5. Market size and forecast, by Application
- 9.4.7.2.6. Market size and forecast, by End User
- 9.4.7.3. India
- 9.4.7.3.1. Key market trends, growth factors and opportunities
- 9.4.7.3.2. Market size and forecast, by Component
- 9.4.7.3.3. Market size and forecast, by Deployment Mode
- 9.4.7.3.4. Market size and forecast, by Organization Size
- 9.4.7.3.5. Market size and forecast, by Application
- 9.4.7.3.6. Market size and forecast, by End User
- 9.4.7.4. Australia
- 9.4.7.4.1. Key market trends, growth factors and opportunities
- 9.4.7.4.2. Market size and forecast, by Component
- 9.4.7.4.3. Market size and forecast, by Deployment Mode
- 9.4.7.4.4. Market size and forecast, by Organization Size
- 9.4.7.4.5. Market size and forecast, by Application
- 9.4.7.4.6. Market size and forecast, by End User
- 9.4.7.5. South Korea
- 9.4.7.5.1. Key market trends, growth factors and opportunities
- 9.4.7.5.2. Market size and forecast, by Component
- 9.4.7.5.3. Market size and forecast, by Deployment Mode
- 9.4.7.5.4. Market size and forecast, by Organization Size
- 9.4.7.5.5. Market size and forecast, by Application
- 9.4.7.5.6. Market size and forecast, by End User
- 9.4.7.6. Rest of Asia-Pacific
- 9.4.7.6.1. Key market trends, growth factors and opportunities
- 9.4.7.6.2. Market size and forecast, by Component
- 9.4.7.6.3. Market size and forecast, by Deployment Mode
- 9.4.7.6.4. Market size and forecast, by Organization Size
- 9.4.7.6.5. Market size and forecast, by Application
- 9.4.7.6.6. Market size and forecast, by End User
- 9.5. LAMEA
- 9.5.1. Key trends and opportunities
- 9.5.2. Market size and forecast, by Component
- 9.5.3. Market size and forecast, by Deployment Mode
- 9.5.4. Market size and forecast, by Organization Size
- 9.5.5. Market size and forecast, by Application
- 9.5.6. Market size and forecast, by End User
- 9.5.7. Market size and forecast, by country
- 9.5.7.1. Latin America
- 9.5.7.1.1. Key market trends, growth factors and opportunities
- 9.5.7.1.2. Market size and forecast, by Component
- 9.5.7.1.3. Market size and forecast, by Deployment Mode
- 9.5.7.1.4. Market size and forecast, by Organization Size
- 9.5.7.1.5. Market size and forecast, by Application
- 9.5.7.1.6. Market size and forecast, by End User
- 9.5.7.2. Middle East
- 9.5.7.2.1. Key market trends, growth factors and opportunities
- 9.5.7.2.2. Market size and forecast, by Component
- 9.5.7.2.3. Market size and forecast, by Deployment Mode
- 9.5.7.2.4. Market size and forecast, by Organization Size
- 9.5.7.2.5. Market size and forecast, by Application
- 9.5.7.2.6. Market size and forecast, by End User
- 9.5.7.3. Africa
- 9.5.7.3.1. Key market trends, growth factors and opportunities
- 9.5.7.3.2. Market size and forecast, by Component
- 9.5.7.3.3. Market size and forecast, by Deployment Mode
- 9.5.7.3.4. Market size and forecast, by Organization Size
- 9.5.7.3.5. Market size and forecast, by Application
- 9.5.7.3.6. Market size and forecast, by End User
CHAPTER 10: COMPETITIVE LANDSCAPE
- 10.1. Introduction
- 10.2. Top winning strategies
- 10.3. Product Mapping of Top 10 Player
- 10.4. Competitive Dashboard
- 10.5. Competitive Heatmap
- 10.6. Top player positioning, 2022
CHAPTER 11: COMPANY PROFILES
- 11.1. Broadcom Inc.
- 11.1.1. Company overview
- 11.1.2. Key Executives
- 11.1.3. Company snapshot
- 11.1.4. Operating business segments
- 11.1.5. Product portfolio
- 11.1.6. Business performance
- 11.1.7. Key strategic moves and developments
- 11.2. Check Point Software Technologies Ltd.
- 11.2.1. Company overview
- 11.2.2. Key Executives
- 11.2.3. Company snapshot
- 11.2.4. Operating business segments
- 11.2.5. Product portfolio
- 11.2.6. Business performance
- 11.2.7. Key strategic moves and developments
- 11.3. Deep Secure
- 11.3.1. Company overview
- 11.3.2. Key Executives
- 11.3.3. Company snapshot
- 11.3.4. Operating business segments
- 11.3.5. Product portfolio
- 11.3.6. Key strategic moves and developments
- 11.4. Fortinet, Inc.
- 11.4.1. Company overview
- 11.4.2. Key Executives
- 11.4.3. Company snapshot
- 11.4.4. Operating business segments
- 11.4.5. Product portfolio
- 11.4.6. Business performance
- 11.4.7. Key strategic moves and developments
- 11.5. Gatefy
- 11.5.1. Company overview
- 11.5.2. Key Executives
- 11.5.3. Company snapshot
- 11.5.4. Operating business segments
- 11.5.5. Product portfolio
- 11.5.6. Key strategic moves and developments
- 11.6. Glasswall Solutions Limited
- 11.6.1. Company overview
- 11.6.2. Key Executives
- 11.6.3. Company snapshot
- 11.6.4. Operating business segments
- 11.6.5. Product portfolio
- 11.6.6. Key strategic moves and developments
- 11.7. OPSWAT, Inc.
- 11.7.1. Company overview
- 11.7.2. Key Executives
- 11.7.3. Company snapshot
- 11.7.4. Operating business segments
- 11.7.5. Product portfolio
- 11.7.6. Key strategic moves and developments
- 11.8. Resec Technologies
- 11.8.1. Company overview
- 11.8.2. Key Executives
- 11.8.3. Company snapshot
- 11.8.4. Operating business segments
- 11.8.5. Product portfolio
- 11.8.6. Key strategic moves and developments
- 11.9. Votiro
- 11.9.1. Company overview
- 11.9.2. Key Executives
- 11.9.3. Company snapshot
- 11.9.4. Operating business segments
- 11.9.5. Product portfolio
- 11.9.6. Key strategic moves and developments
- 11.10. YazamTech
- 11.10.1. Company overview
- 11.10.2. Key Executives
- 11.10.3. Company snapshot
- 11.10.4. Operating business segments
- 11.10.5. Product portfolio
LIST OF TABLES
- TABLE 01. GLOBAL CONTENT DISARM AND RECONSTRUCTION MARKET, BY COMPONENT, 2022-2032 ($MILLION)
- TABLE 02. CONTENT DISARM AND RECONSTRUCTION MARKET FOR SOLUTION, BY REGION, 2022-2032 ($MILLION)
- TABLE 03. CONTENT DISARM AND RECONSTRUCTION MARKET FOR SERVICES, BY REGION, 2022-2032 ($MILLION)
- TABLE 04. GLOBAL CONTENT DISARM AND RECONSTRUCTION MARKET, BY DEPLOYMENT MODE, 2022-2032 ($MILLION)
- TABLE 05. CONTENT DISARM AND RECONSTRUCTION MARKET FOR ON-PREMISES, BY REGION, 2022-2032 ($MILLION)
- TABLE 06. CONTENT DISARM AND RECONSTRUCTION MARKET FOR CLOUD, BY REGION, 2022-2032 ($MILLION)
- TABLE 07. GLOBAL CONTENT DISARM AND RECONSTRUCTION MARKET, BY ORGANIZATION SIZE, 2022-2032 ($MILLION)
- TABLE 08. CONTENT DISARM AND RECONSTRUCTION MARKET FOR LARGE ENTERPRISES, BY REGION, 2022-2032 ($MILLION)
- TABLE 09. CONTENT DISARM AND RECONSTRUCTION MARKET FOR SMALL AND MEDIUM SIZED ENTERPRISES, BY REGION, 2022-2032 ($MILLION)
- TABLE 10. GLOBAL CONTENT DISARM AND RECONSTRUCTION MARKET, BY APPLICATION, 2022-2032 ($MILLION)
- TABLE 11. CONTENT DISARM AND RECONSTRUCTION MARKET FOR EMAIL, BY REGION, 2022-2032 ($MILLION)
- TABLE 12. CONTENT DISARM AND RECONSTRUCTION MARKET FOR WEB, BY REGION, 2022-2032 ($MILLION)
- TABLE 13. CONTENT DISARM AND RECONSTRUCTION MARKET FOR FILE TRANSFER PROTOCOL, BY REGION, 2022-2032 ($MILLION)
- TABLE 14. CONTENT DISARM AND RECONSTRUCTION MARKET FOR REMOVABLE DEVICES, BY REGION, 2022-2032 ($MILLION)
- TABLE 15. GLOBAL CONTENT DISARM AND RECONSTRUCTION MARKET, BY END USER, 2022-2032 ($MILLION)
- TABLE 16. CONTENT DISARM AND RECONSTRUCTION MARKET FOR BFSI, BY REGION, 2022-2032 ($MILLION)
- TABLE 17. CONTENT DISARM AND RECONSTRUCTION MARKET FOR IT AND TELECOM, BY REGION, 2022-2032 ($MILLION)
- TABLE 18. CONTENT DISARM AND RECONSTRUCTION MARKET FOR ENERGY AND UTILITIES, BY REGION, 2022-2032 ($MILLION)
- TABLE 19. CONTENT DISARM AND RECONSTRUCTION MARKET FOR MANUFACTURING, BY REGION, 2022-2032 ($MILLION)
- TABLE 20. CONTENT DISARM AND RECONSTRUCTION MARKET FOR HEALTHCARE, BY REGION, 2022-2032 ($MILLION)
- TABLE 21. CONTENT DISARM AND RECONSTRUCTION MARKET FOR OTHERS, BY REGION, 2022-2032 ($MILLION)
- TABLE 22. CONTENT DISARM AND RECONSTRUCTION MARKET, BY REGION, 2022-2032 ($MILLION)
- TABLE 23. NORTH AMERICA CONTENT DISARM AND RECONSTRUCTION MARKET, BY COMPONENT, 2022-2032 ($MILLION)
- TABLE 24. NORTH AMERICA CONTENT DISARM AND RECONSTRUCTION MARKET, BY DEPLOYMENT MODE, 2022-2032 ($MILLION)
- TABLE 25. NORTH AMERICA CONTENT DISARM AND RECONSTRUCTION MARKET, BY ORGANIZATION SIZE, 2022-2032 ($MILLION)
- TABLE 26. NORTH AMERICA CONTENT DISARM AND RECONSTRUCTION MARKET, BY APPLICATION, 2022-2032 ($MILLION)
- TABLE 27. NORTH AMERICA CONTENT DISARM AND RECONSTRUCTION MARKET, BY END USER, 2022-2032 ($MILLION)
- TABLE 28. NORTH AMERICA CONTENT DISARM AND RECONSTRUCTION MARKET, BY COUNTRY, 2022-2032 ($MILLION)
- TABLE 29. U.S. CONTENT DISARM AND RECONSTRUCTION MARKET, BY COMPONENT, 2022-2032 ($MILLION)
- TABLE 30. U.S. CONTENT DISARM AND RECONSTRUCTION MARKET, BY DEPLOYMENT MODE, 2022-2032 ($MILLION)
- TABLE 31. U.S. CONTENT DISARM AND RECONSTRUCTION MARKET, BY ORGANIZATION SIZE, 2022-2032 ($MILLION)
- TABLE 32. U.S. CONTENT DISARM AND RECONSTRUCTION MARKET, BY APPLICATION, 2022-2032 ($MILLION)
- TABLE 33. U.S. CONTENT DISARM AND RECONSTRUCTION MARKET, BY END USER, 2022-2032 ($MILLION)
- TABLE 34. CANADA CONTENT DISARM AND RECONSTRUCTION MARKET, BY COMPONENT, 2022-2032 ($MILLION)
- TABLE 35. CANADA CONTENT DISARM AND RECONSTRUCTION MARKET, BY DEPLOYMENT MODE, 2022-2032 ($MILLION)
- TABLE 36. CANADA CONTENT DISARM AND RECONSTRUCTION MARKET, BY ORGANIZATION SIZE, 2022-2032 ($MILLION)
- TABLE 37. CANADA CONTENT DISARM AND RECONSTRUCTION MARKET, BY APPLICATION, 2022-2032 ($MILLION)
- TABLE 38. CANADA CONTENT DISARM AND RECONSTRUCTION MARKET, BY END USER, 2022-2032 ($MILLION)
- TABLE 39. EUROPE CONTENT DISARM AND RECONSTRUCTION MARKET, BY COMPONENT, 2022-2032 ($MILLION)
- TABLE 40. EUROPE CONTENT DISARM AND RECONSTRUCTION MARKET, BY DEPLOYMENT MODE, 2022-2032 ($MILLION)
- TABLE 41. EUROPE CONTENT DISARM AND RECONSTRUCTION MARKET, BY ORGANIZATION SIZE, 2022-2032 ($MILLION)
- TABLE 42. EUROPE CONTENT DISARM AND RECONSTRUCTION MARKET, BY APPLICATION, 2022-2032 ($MILLION)
- TABLE 43. EUROPE CONTENT DISARM AND RECONSTRUCTION MARKET, BY END USER, 2022-2032 ($MILLION)
- TABLE 44. EUROPE CONTENT DISARM AND RECONSTRUCTION MARKET, BY COUNTRY, 2022-2032 ($MILLION)
- TABLE 45. UK CONTENT DISARM AND RECONSTRUCTION MARKET, BY COMPONENT, 2022-2032 ($MILLION)
- TABLE 46. UK CONTENT DISARM AND RECONSTRUCTION MARKET, BY DEPLOYMENT MODE, 2022-2032 ($MILLION)
- TABLE 47. UK CONTENT DISARM AND RECONSTRUCTION MARKET, BY ORGANIZATION SIZE, 2022-2032 ($MILLION)
- TABLE 48. UK CONTENT DISARM AND RECONSTRUCTION MARKET, BY APPLICATION, 2022-2032 ($MILLION)
- TABLE 49. UK CONTENT DISARM AND RECONSTRUCTION MARKET, BY END USER, 2022-2032 ($MILLION)
- TABLE 50. GERMANY CONTENT DISARM AND RECONSTRUCTION MARKET, BY COMPONENT, 2022-2032 ($MILLION)
- TABLE 51. GERMANY CONTENT DISARM AND RECONSTRUCTION MARKET, BY DEPLOYMENT MODE, 2022-2032 ($MILLION)
- TABLE 52. GERMANY CONTENT DISARM AND RECONSTRUCTION MARKET, BY ORGANIZATION SIZE, 2022-2032 ($MILLION)
- TABLE 53. GERMANY CONTENT DISARM AND RECONSTRUCTION MARKET, BY APPLICATION, 2022-2032 ($MILLION)
- TABLE 54. GERMANY CONTENT DISARM AND RECONSTRUCTION MARKET, BY END USER, 2022-2032 ($MILLION)
- TABLE 55. FRANCE CONTENT DISARM AND RECONSTRUCTION MARKET, BY COMPONENT, 2022-2032 ($MILLION)
- TABLE 56. FRANCE CONTENT DISARM AND RECONSTRUCTION MARKET, BY DEPLOYMENT MODE, 2022-2032 ($MILLION)
- TABLE 57. FRANCE CONTENT DISARM AND RECONSTRUCTION MARKET, BY ORGANIZATION SIZE, 2022-2032 ($MILLION)
- TABLE 58. FRANCE CONTENT DISARM AND RECONSTRUCTION MARKET, BY APPLICATION, 2022-2032 ($MILLION)
- TABLE 59. FRANCE CONTENT DISARM AND RECONSTRUCTION MARKET, BY END USER, 2022-2032 ($MILLION)
- TABLE 60. ITALY CONTENT DISARM AND RECONSTRUCTION MARKET, BY COMPONENT, 2022-2032 ($MILLION)
- TABLE 61. ITALY CONTENT DISARM AND RECONSTRUCTION MARKET, BY DEPLOYMENT MODE, 2022-2032 ($MILLION)
- TABLE 62. ITALY CONTENT DISARM AND RECONSTRUCTION MARKET, BY ORGANIZATION SIZE, 2022-2032 ($MILLION)
- TABLE 63. ITALY CONTENT DISARM AND RECONSTRUCTION MARKET, BY APPLICATION, 2022-2032 ($MILLION)
- TABLE 64. ITALY CONTENT DISARM AND RECONSTRUCTION MARKET, BY END USER, 2022-2032 ($MILLION)
- TABLE 65. SPAIN CONTENT DISARM AND RECONSTRUCTION MARKET, BY COMPONENT, 2022-2032 ($MILLION)
- TABLE 66. SPAIN CONTENT DISARM AND RECONSTRUCTION MARKET, BY DEPLOYMENT MODE, 2022-2032 ($MILLION)
- TABLE 67. SPAIN CONTENT DISARM AND RECONSTRUCTION MARKET, BY ORGANIZATION SIZE, 2022-2032 ($MILLION)
- TABLE 68. SPAIN CONTENT DISARM AND RECONSTRUCTION MARKET, BY APPLICATION, 2022-2032 ($MILLION)
- TABLE 69. SPAIN CONTENT DISARM AND RECONSTRUCTION MARKET, BY END USER, 2022-2032 ($MILLION)
- TABLE 70. REST OF EUROPE CONTENT DISARM AND RECONSTRUCTION MARKET, BY COMPONENT, 2022-2032 ($MILLION)
- TABLE 71. REST OF EUROPE CONTENT DISARM AND RECONSTRUCTION MARKET, BY DEPLOYMENT MODE, 2022-2032 ($MILLION)
- TABLE 72. REST OF EUROPE CONTENT DISARM AND RECONSTRUCTION MARKET, BY ORGANIZATION SIZE, 2022-2032 ($MILLION)
- TABLE 73. REST OF EUROPE CONTENT DISARM AND RECONSTRUCTION MARKET, BY APPLICATION, 2022-2032 ($MILLION)
- TABLE 74. REST OF EUROPE CONTENT DISARM AND RECONSTRUCTION MARKET, BY END USER, 2022-2032 ($MILLION)
- TABLE 75. ASIA-PACIFIC CONTENT DISARM AND RECONSTRUCTION MARKET, BY COMPONENT, 2022-2032 ($MILLION)
- TABLE 76. ASIA-PACIFIC CONTENT DISARM AND RECONSTRUCTION MARKET, BY DEPLOYMENT MODE, 2022-2032 ($MILLION)
- TABLE 77. ASIA-PACIFIC CONTENT DISARM AND RECONSTRUCTION MARKET, BY ORGANIZATION SIZE, 2022-2032 ($MILLION)
- TABLE 78. ASIA-PACIFIC CONTENT DISARM AND RECONSTRUCTION MARKET, BY APPLICATION, 2022-2032 ($MILLION)
- TABLE 79. ASIA-PACIFIC CONTENT DISARM AND RECONSTRUCTION MARKET, BY END USER, 2022-2032 ($MILLION)
- TABLE 80. ASIA-PACIFIC CONTENT DISARM AND RECONSTRUCTION MARKET, BY COUNTRY, 2022-2032 ($MILLION)
- TABLE 81. CHINA CONTENT DISARM AND RECONSTRUCTION MARKET, BY COMPONENT, 2022-2032 ($MILLION)
- TABLE 82. CHINA CONTENT DISARM AND RECONSTRUCTION MARKET, BY DEPLOYMENT MODE, 2022-2032 ($MILLION)
- TABLE 83. CHINA CONTENT DISARM AND RECONSTRUCTION MARKET, BY ORGANIZATION SIZE, 2022-2032 ($MILLION)
- TABLE 84. CHINA CONTENT DISARM AND RECONSTRUCTION MARKET, BY APPLICATION, 2022-2032 ($MILLION)
- TABLE 85. CHINA CONTENT DISARM AND RECONSTRUCTION MARKET, BY END USER, 2022-2032 ($MILLION)
- TABLE 86. JAPAN CONTENT DISARM AND RECONSTRUCTION MARKET, BY COMPONENT, 2022-2032 ($MILLION)
- TABLE 87. JAPAN CONTENT DISARM AND RECONSTRUCTION MARKET, BY DEPLOYMENT MODE, 2022-2032 ($MILLION)
- TABLE 88. JAPAN CONTENT DISARM AND RECONSTRUCTION MARKET, BY ORGANIZATION SIZE, 2022-2032 ($MILLION)
- TABLE 89. JAPAN CONTENT DISARM AND RECONSTRUCTION MARKET, BY APPLICATION, 2022-2032 ($MILLION)
- TABLE 90. JAPAN CONTENT DISARM AND RECONSTRUCTION MARKET, BY END USER, 2022-2032 ($MILLION)
- TABLE 91. INDIA CONTENT DISARM AND RECONSTRUCTION MARKET, BY COMPONENT, 2022-2032 ($MILLION)
- TABLE 92. INDIA CONTENT DISARM AND RECONSTRUCTION MARKET, BY DEPLOYMENT MODE, 2022-2032 ($MILLION)
- TABLE 93. INDIA CONTENT DISARM AND RECONSTRUCTION MARKET, BY ORGANIZATION SIZE, 2022-2032 ($MILLION)
- TABLE 94. INDIA CONTENT DISARM AND RECONSTRUCTION MARKET, BY APPLICATION, 2022-2032 ($MILLION)
- TABLE 95. INDIA CONTENT DISARM AND RECONSTRUCTION MARKET, BY END USER, 2022-2032 ($MILLION)
- TABLE 96. AUSTRALIA CONTENT DISARM AND RECONSTRUCTION MARKET, BY COMPONENT, 2022-2032 ($MILLION)
- TABLE 97. AUSTRALIA CONTENT DISARM AND RECONSTRUCTION MARKET, BY DEPLOYMENT MODE, 2022-2032 ($MILLION)
- TABLE 98. AUSTRALIA CONTENT DISARM AND RECONSTRUCTION MARKET, BY ORGANIZATION SIZE, 2022-2032 ($MILLION)
- TABLE 99. AUSTRALIA CONTENT DISARM AND RECONSTRUCTION MARKET, BY APPLICATION, 2022-2032 ($MILLION)
- TABLE 100. AUSTRALIA CONTENT DISARM AND RECONSTRUCTION MARKET, BY END USER, 2022-2032 ($MILLION)
- TABLE 101. SOUTH KOREA CONTENT DISARM AND RECONSTRUCTION MARKET, BY COMPONENT, 2022-2032 ($MILLION)
- TABLE 102. SOUTH KOREA CONTENT DISARM AND RECONSTRUCTION MARKET, BY DEPLOYMENT MODE, 2022-2032 ($MILLION)
- TABLE 103. SOUTH KOREA CONTENT DISARM AND RECONSTRUCTION MARKET, BY ORGANIZATION SIZE, 2022-2032 ($MILLION)
- TABLE 104. SOUTH KOREA CONTENT DISARM AND RECONSTRUCTION MARKET, BY APPLICATION, 2022-2032 ($MILLION)
- TABLE 105. SOUTH KOREA CONTENT DISARM AND RECONSTRUCTION MARKET, BY END USER, 2022-2032 ($MILLION)
- TABLE 106. REST OF ASIA-PACIFIC CONTENT DISARM AND RECONSTRUCTION MARKET, BY COMPONENT, 2022-2032 ($MILLION)
- TABLE 107. REST OF ASIA-PACIFIC CONTENT DISARM AND RECONSTRUCTION MARKET, BY DEPLOYMENT MODE, 2022-2032 ($MILLION)
- TABLE 108. REST OF ASIA-PACIFIC CONTENT DISARM AND RECONSTRUCTION MARKET, BY ORGANIZATION SIZE, 2022-2032 ($MILLION)
- TABLE 109. REST OF ASIA-PACIFIC CONTENT DISARM AND RECONSTRUCTION MARKET, BY APPLICATION, 2022-2032 ($MILLION)
- TABLE 110. REST OF ASIA-PACIFIC CONTENT DISARM AND RECONSTRUCTION MARKET, BY END USER, 2022-2032 ($MILLION)
- TABLE 111. LAMEA CONTENT DISARM AND RECONSTRUCTION MARKET, BY COMPONENT, 2022-2032 ($MILLION)
- TABLE 112. LAMEA CONTENT DISARM AND RECONSTRUCTION MARKET, BY DEPLOYMENT MODE, 2022-2032 ($MILLION)
- TABLE 113. LAMEA CONTENT DISARM AND RECONSTRUCTION MARKET, BY ORGANIZATION SIZE, 2022-2032 ($MILLION)
- TABLE 114. LAMEA CONTENT DISARM AND RECONSTRUCTION MARKET, BY APPLICATION, 2022-2032 ($MILLION)
- TABLE 115. LAMEA CONTENT DISARM AND RECONSTRUCTION MARKET, BY END USER, 2022-2032 ($MILLION)
- TABLE 116. LAMEA CONTENT DISARM AND RECONSTRUCTION MARKET, BY COUNTRY, 2022-2032 ($MILLION)
- TABLE 117. LATIN AMERICA CONTENT DISARM AND RECONSTRUCTION MARKET, BY COMPONENT, 2022-2032 ($MILLION)
- TABLE 118. LATIN AMERICA CONTENT DISARM AND RECONSTRUCTION MARKET, BY DEPLOYMENT MODE, 2022-2032 ($MILLION)
- TABLE 119. LATIN AMERICA CONTENT DISARM AND RECONSTRUCTION MARKET, BY ORGANIZATION SIZE, 2022-2032 ($MILLION)
- TABLE 120. LATIN AMERICA CONTENT DISARM AND RECONSTRUCTION MARKET, BY APPLICATION, 2022-2032 ($MILLION)
- TABLE 121. LATIN AMERICA CONTENT DISARM AND RECONSTRUCTION MARKET, BY END USER, 2022-2032 ($MILLION)
- TABLE 122. MIDDLE EAST CONTENT DISARM AND RECONSTRUCTION MARKET, BY COMPONENT, 2022-2032 ($MILLION)
- TABLE 123. MIDDLE EAST CONTENT DISARM AND RECONSTRUCTION MARKET, BY DEPLOYMENT MODE, 2022-2032 ($MILLION)
- TABLE 124. MIDDLE EAST CONTENT DISARM AND RECONSTRUCTION MARKET, BY ORGANIZATION SIZE, 2022-2032 ($MILLION)
- TABLE 125. MIDDLE EAST CONTENT DISARM AND RECONSTRUCTION MARKET, BY APPLICATION, 2022-2032 ($MILLION)
- TABLE 126. MIDDLE EAST CONTENT DISARM AND RECONSTRUCTION MARKET, BY END USER, 2022-2032 ($MILLION)
- TABLE 127. AFRICA CONTENT DISARM AND RECONSTRUCTION MARKET, BY COMPONENT, 2022-2032 ($MILLION)
- TABLE 128. AFRICA CONTENT DISARM AND RECONSTRUCTION MARKET, BY DEPLOYMENT MODE, 2022-2032 ($MILLION)
- TABLE 129. AFRICA CONTENT DISARM AND RECONSTRUCTION MARKET, BY ORGANIZATION SIZE, 2022-2032 ($MILLION)
- TABLE 130. AFRICA CONTENT DISARM AND RECONSTRUCTION MARKET, BY APPLICATION, 2022-2032 ($MILLION)
- TABLE 131. AFRICA CONTENT DISARM AND RECONSTRUCTION MARKET, BY END USER, 2022-2032 ($MILLION)
- TABLE 132. BROADCOM INC.: KEY EXECUTIVES
- TABLE 133. BROADCOM INC.: COMPANY SNAPSHOT
- TABLE 134. BROADCOM INC.: SERVICE SEGMENTS
- TABLE 135. BROADCOM INC.: PRODUCT PORTFOLIO
- TABLE 136. BROADCOM INC.: KEY STRATERGIES
- TABLE 137. CHECK POINT SOFTWARE TECHNOLOGIES LTD.: KEY EXECUTIVES
- TABLE 138. CHECK POINT SOFTWARE TECHNOLOGIES LTD.: COMPANY SNAPSHOT
- TABLE 139. CHECK POINT SOFTWARE TECHNOLOGIES LTD.: SERVICE SEGMENTS
- TABLE 140. CHECK POINT SOFTWARE TECHNOLOGIES LTD.: PRODUCT PORTFOLIO
- TABLE 141. CHECK POINT SOFTWARE TECHNOLOGIES LTD.: KEY STRATERGIES
- TABLE 142. DEEP SECURE: KEY EXECUTIVES
- TABLE 143. DEEP SECURE: COMPANY SNAPSHOT
- TABLE 144. DEEP SECURE: PRODUCT SEGMENTS
- TABLE 145. DEEP SECURE: PRODUCT PORTFOLIO
- TABLE 146. DEEP SECURE: KEY STRATERGIES
- TABLE 147. FORTINET, INC.: KEY EXECUTIVES
- TABLE 148. FORTINET, INC.: COMPANY SNAPSHOT
- TABLE 149. FORTINET, INC.: SERVICE SEGMENTS
- TABLE 150. FORTINET, INC.: PRODUCT PORTFOLIO
- TABLE 151. FORTINET, INC.: KEY STRATERGIES
- TABLE 152. GATEFY: KEY EXECUTIVES
- TABLE 153. GATEFY: COMPANY SNAPSHOT
- TABLE 154. GATEFY: PRODUCT SEGMENTS
- TABLE 155. GATEFY: PRODUCT PORTFOLIO
- TABLE 156. GATEFY: KEY STRATERGIES
- TABLE 157. GLASSWALL SOLUTIONS LIMITED: KEY EXECUTIVES
- TABLE 158. GLASSWALL SOLUTIONS LIMITED: COMPANY SNAPSHOT
- TABLE 159. GLASSWALL SOLUTIONS LIMITED: PRODUCT SEGMENTS
- TABLE 160. GLASSWALL SOLUTIONS LIMITED: PRODUCT PORTFOLIO
- TABLE 161. GLASSWALL SOLUTIONS LIMITED: KEY STRATERGIES
- TABLE 162. OPSWAT, INC.: KEY EXECUTIVES
- TABLE 163. OPSWAT, INC.: COMPANY SNAPSHOT
- TABLE 164. OPSWAT, INC.: PRODUCT SEGMENTS
- TABLE 165. OPSWAT, INC.: PRODUCT PORTFOLIO
- TABLE 166. OPSWAT, INC.: KEY STRATERGIES
- TABLE 167. RESEC TECHNOLOGIES: KEY EXECUTIVES
- TABLE 168. RESEC TECHNOLOGIES: COMPANY SNAPSHOT
- TABLE 169. RESEC TECHNOLOGIES: PRODUCT SEGMENTS
- TABLE 170. RESEC TECHNOLOGIES: PRODUCT PORTFOLIO
- TABLE 171. RESEC TECHNOLOGIES: KEY STRATERGIES
- TABLE 172. VOTIRO: KEY EXECUTIVES
- TABLE 173. VOTIRO: COMPANY SNAPSHOT
- TABLE 174. VOTIRO: SERVICE SEGMENTS
- TABLE 175. VOTIRO: PRODUCT PORTFOLIO
- TABLE 176. VOTIRO: KEY STRATERGIES
- TABLE 177. YAZAMTECH: KEY EXECUTIVES
- TABLE 178. YAZAMTECH: COMPANY SNAPSHOT
- TABLE 179. YAZAMTECH: PRODUCT SEGMENTS
- TABLE 180. YAZAMTECH: PRODUCT PORTFOLIO
LIST OF FIGURES
- FIGURE 01. CONTENT DISARM AND RECONSTRUCTION MARKET, 2022-2032
- FIGURE 02. SEGMENTATION OF CONTENT DISARM AND RECONSTRUCTION MARKET, 2022-2032
- FIGURE 03. TOP INVESTMENT POCKETS IN CONTENT DISARM AND RECONSTRUCTION MARKET (2023-2032)
- FIGURE 04. LOW BARGAINING POWER OF SUPPLIERS
- FIGURE 05. LOW BARGAINING POWER OF BUYERS
- FIGURE 06. LOW THREAT OF SUBSTITUTES
- FIGURE 07. LOW THREAT OF NEW ENTRANTS
- FIGURE 08. LOW INTENSITY OF RIVALRY
- FIGURE 09. DRIVERS, RESTRAINTS AND OPPORTUNITIES: GLOBALCONTENT DISARM AND RECONSTRUCTION MARKET
- FIGURE 10. CONTENT DISARM AND RECONSTRUCTION MARKET, BY COMPONENT, 2022(%)
- FIGURE 11. COMPARATIVE SHARE ANALYSIS OF CONTENT DISARM AND RECONSTRUCTION MARKET FOR SOLUTION, BY COUNTRY 2022 AND 2032(%)
- FIGURE 12. COMPARATIVE SHARE ANALYSIS OF CONTENT DISARM AND RECONSTRUCTION MARKET FOR SERVICES, BY COUNTRY 2022 AND 2032(%)
- FIGURE 13. CONTENT DISARM AND RECONSTRUCTION MARKET, BY DEPLOYMENT MODE, 2022(%)
- FIGURE 14. COMPARATIVE SHARE ANALYSIS OF CONTENT DISARM AND RECONSTRUCTION MARKET FOR ON-PREMISES, BY COUNTRY 2022 AND 2032(%)
- FIGURE 15. COMPARATIVE SHARE ANALYSIS OF CONTENT DISARM AND RECONSTRUCTION MARKET FOR CLOUD, BY COUNTRY 2022 AND 2032(%)
- FIGURE 16. CONTENT DISARM AND RECONSTRUCTION MARKET, BY ORGANIZATION SIZE, 2022(%)
- FIGURE 17. COMPARATIVE SHARE ANALYSIS OF CONTENT DISARM AND RECONSTRUCTION MARKET FOR LARGE ENTERPRISES, BY COUNTRY 2022 AND 2032(%)
- FIGURE 18. COMPARATIVE SHARE ANALYSIS OF CONTENT DISARM AND RECONSTRUCTION MARKET FOR SMALL AND MEDIUM SIZED ENTERPRISES, BY COUNTRY 2022 AND 2032(%)
- FIGURE 19. CONTENT DISARM AND RECONSTRUCTION MARKET, BY APPLICATION, 2022(%)
- FIGURE 20. COMPARATIVE SHARE ANALYSIS OF CONTENT DISARM AND RECONSTRUCTION MARKET FOR EMAIL, BY COUNTRY 2022 AND 2032(%)
- FIGURE 21. COMPARATIVE SHARE ANALYSIS OF CONTENT DISARM AND RECONSTRUCTION MARKET FOR WEB, BY COUNTRY 2022 AND 2032(%)
- FIGURE 22. COMPARATIVE SHARE ANALYSIS OF CONTENT DISARM AND RECONSTRUCTION MARKET FOR FILE TRANSFER PROTOCOL, BY COUNTRY 2022 AND 2032(%)
- FIGURE 23. COMPARATIVE SHARE ANALYSIS OF CONTENT DISARM AND RECONSTRUCTION MARKET FOR REMOVABLE DEVICES, BY COUNTRY 2022 AND 2032(%)
- FIGURE 24. CONTENT DISARM AND RECONSTRUCTION MARKET, BY END USER, 2022(%)
- FIGURE 25. COMPARATIVE SHARE ANALYSIS OF CONTENT DISARM AND RECONSTRUCTION MARKET FOR BFSI, BY COUNTRY 2022 AND 2032(%)
- FIGURE 26. COMPARATIVE SHARE ANALYSIS OF CONTENT DISARM AND RECONSTRUCTION MARKET FOR IT AND TELECOM, BY COUNTRY 2022 AND 2032(%)
- FIGURE 27. COMPARATIVE SHARE ANALYSIS OF CONTENT DISARM AND RECONSTRUCTION MARKET FOR ENERGY AND UTILITIES, BY COUNTRY 2022 AND 2032(%)
- FIGURE 28. COMPARATIVE SHARE ANALYSIS OF CONTENT DISARM AND RECONSTRUCTION MARKET FOR MANUFACTURING, BY COUNTRY 2022 AND 2032(%)
- FIGURE 29. COMPARATIVE SHARE ANALYSIS OF CONTENT DISARM AND RECONSTRUCTION MARKET FOR HEALTHCARE, BY COUNTRY 2022 AND 2032(%)
- FIGURE 30. COMPARATIVE SHARE ANALYSIS OF CONTENT DISARM AND RECONSTRUCTION MARKET FOR OTHERS, BY COUNTRY 2022 AND 2032(%)
- FIGURE 31. CONTENT DISARM AND RECONSTRUCTION MARKET BY REGION, 2022
- FIGURE 32. U.S. CONTENT DISARM AND RECONSTRUCTION MARKET, 2022-2032 ($MILLION)
- FIGURE 33. CANADA CONTENT DISARM AND RECONSTRUCTION MARKET, 2022-2032 ($MILLION)
- FIGURE 34. UK CONTENT DISARM AND RECONSTRUCTION MARKET, 2022-2032 ($MILLION)
- FIGURE 35. GERMANY CONTENT DISARM AND RECONSTRUCTION MARKET, 2022-2032 ($MILLION)
- FIGURE 36. FRANCE CONTENT DISARM AND RECONSTRUCTION MARKET, 2022-2032 ($MILLION)
- FIGURE 37. ITALY CONTENT DISARM AND RECONSTRUCTION MARKET, 2022-2032 ($MILLION)
- FIGURE 38. SPAIN CONTENT DISARM AND RECONSTRUCTION MARKET, 2022-2032 ($MILLION)
- FIGURE 39. REST OF EUROPE CONTENT DISARM AND RECONSTRUCTION MARKET, 2022-2032 ($MILLION)
- FIGURE 40. CHINA CONTENT DISARM AND RECONSTRUCTION MARKET, 2022-2032 ($MILLION)
- FIGURE 41. JAPAN CONTENT DISARM AND RECONSTRUCTION MARKET, 2022-2032 ($MILLION)
- FIGURE 42. INDIA CONTENT DISARM AND RECONSTRUCTION MARKET, 2022-2032 ($MILLION)
- FIGURE 43. AUSTRALIA CONTENT DISARM AND RECONSTRUCTION MARKET, 2022-2032 ($MILLION)
- FIGURE 44. SOUTH KOREA CONTENT DISARM AND RECONSTRUCTION MARKET, 2022-2032 ($MILLION)
- FIGURE 45. REST OF ASIA-PACIFIC CONTENT DISARM AND RECONSTRUCTION MARKET, 2022-2032 ($MILLION)
- FIGURE 46. LATIN AMERICA CONTENT DISARM AND RECONSTRUCTION MARKET, 2022-2032 ($MILLION)
- FIGURE 47. MIDDLE EAST CONTENT DISARM AND RECONSTRUCTION MARKET, 2022-2032 ($MILLION)
- FIGURE 48. AFRICA CONTENT DISARM AND RECONSTRUCTION MARKET, 2022-2032 ($MILLION)
- FIGURE 49. TOP WINNING STRATEGIES, BY YEAR
- FIGURE 50. TOP WINNING STRATEGIES, BY DEVELOPMENT
- FIGURE 51. TOP WINNING STRATEGIES, BY COMPANY
- FIGURE 52. PRODUCT MAPPING OF TOP 10 PLAYERS
- FIGURE 53. COMPETITIVE DASHBOARD
- FIGURE 54. COMPETITIVE HEATMAP: CONTENT DISARM AND RECONSTRUCTION MARKET
- FIGURE 55. TOP PLAYER POSITIONING, 2022
- FIGURE 56. BROADCOM INC.: NET REVENUE, 2020-2022 ($MILLION)
- FIGURE 57. BROADCOM INC.: RESEARCH & DEVELOPMENT EXPENDITURE, 2020-2022 ($MILLION)
- FIGURE 58. BROADCOM INC.: REVENUE SHARE BY SEGMENT, 2022 (%)
- FIGURE 59. BROADCOM INC.: REVENUE SHARE BY REGION, 2022 (%)
- FIGURE 60. CHECK POINT SOFTWARE TECHNOLOGIES LTD.: NET REVENUE, 2020-2022 ($MILLION)
- FIGURE 61. CHECK POINT SOFTWARE TECHNOLOGIES LTD.: RESEARCH & DEVELOPMENT EXPENDITURE, 2020-2021 ($MILLION)
- FIGURE 62. CHECK POINT SOFTWARE TECHNOLOGIES LTD.: REVENUE SHARE BY SEGMENT, 2021 (%)
- FIGURE 63. CHECK POINT SOFTWARE TECHNOLOGIES LTD.: REVENUE SHARE BY REGION, 2021 (%)
- FIGURE 64. FORTINET, INC.: NET REVENUE, 2020-2022 ($MILLION)
- FIGURE 65. FORTINET, INC.: RESEARCH & DEVELOPMENT EXPENDITURE, 2020-2021 ($MILLION)
- FIGURE 66. FORTINET, INC.: REVENUE SHARE BY SEGMENT, 2022 (%)
- FIGURE 67. FORTINET, INC.: REVENUE SHARE BY REGION, 2021 (%)

