
PUBLISHER: Allied Market Research | PRODUCT CODE: 1344296

PUBLISHER: Allied Market Research | PRODUCT CODE: 1344296
Burner Management System Market By Platform, By Fuel, By End-use, By Component, By Application : Global Opportunity Analysis and Industry Forecast, 2023-2032
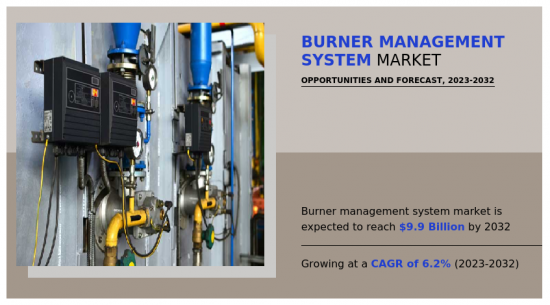
According to a new report published by Allied Market Research, titled, "Burner Management System Market," The burner management system market was valued at $5.6 billion in 2022, and is estimated to reach $9.9 billion by 2032, growing at a CAGR of 6.2% from 2023 to 2032.
Flame detectors, ignition systems, fuel valves, safety shut-off valves, and control logic are just a few of the parts that make up a burner management system. Key parameters like flame presence, burner status, fuel flow, and combustion conditions are continuously monitored by the system. It uses this data to decide how to operate the burner, including starting and halting it, managing fuel flow, and triggering safety shutdowns in the event of unexpected circumstances.
Growing industrial automation aims to enhance operational efficiency and optimize processes. By integrating BMS with other automation systems like Distributed Control Systems (DCS) and Programmable Logic Controllers (PLC), companies can achieve seamless control and monitoring of the entire industrial process, including the combustion equipment. This integration allows for better optimization, improved energy efficiency, and reduced operational costs. Moreover, burner management systems play a critical role in ensuring the safe and reliable operation of combustion equipment. BMS monitors and controls the burner's operation, including ignition, fuel supply, and flame detection. By integrating BMS with other automation systems, companies can enhance safety measures, comply with industry regulations, and prevent accidents, such as fuel leaks or explosions. Furthermore, automation systems enable remote monitoring and control of industrial processes. By integrating BMS with automation systems, operators can remotely monitor the performance of combustion equipment, receive real-time alerts or notifications, and even make necessary adjustments or shutdowns if required. This capability enhances operational flexibility, reduces the need for physical presence on-site, and improves overall productivity.
The lack of standardized protocols and interfaces to hamper the burner management system market. The absence of standardized protocols and interfaces makes it difficult for different BMS components and systems to seamlessly integrate. This can lead to compatibility issues and hinder interoperability between various vendor solutions. Therefore, end users may face limitations when trying to integrate BMS with other control systems, such as distributed control systems (DCS) or supervisory control and data acquisition (SCADA) systems. Moreover, the limited standardization in the BMS market can contribute to vendor lock-in. When there are no standardized protocols or interfaces, customers may become dependent on a specific vendor's proprietary solutions. This can restrict their ability to switch to alternative vendors or technologies in the future, limiting their flexibility and potentially increasing costs.
IoT allows real-time data analytics, predictive maintenance, remote monitoring and control of burner operations, and improved system performance. Manufacturers of burner management systems can profit from this trend by creating IoT-enabled BMS solutions that provide better efficiency and less downtime. The market for burner management systems can profit from the growth of industries like biomass, biogas, and waste-to-energy due to the emphasis on renewable energy sources. These sectors generate energy via combustion systems, and burner management systems are essential to ensure safe and effective operations.
The COVID-19 pandemic has affected various industries globally, including those utilizing burner management systems. Economic uncertainties, supply chain disruptions, and reduced capital expenditures by industries led to a slowdown in the implementation of new projects and investments, which impacted the growth of the burner management system market. Depending on the industry and location, the COVID-19 pandemic may have varying detrimental effects on the burner management system market.
The key players profiled in this report include: ABB, Cimarron Energy. INC. Emerson Electric Co., Honeywell International Ino., Schneider Electric SE., Tundra Process Solutions, Pilz GmbH & Co. KG, ACL Manufacturing Inc., Combustex Corp., and Rockwell Automation. Inc. The market players are continuously striving to achieve a dominant position in this competitive market using strategies such as collaborations and acquisitions.
Key Benefits For Stakeholders
- This report provides a quantitative analysis of the market segments, current trends, estimations, and dynamics of the burner management system market analysis from 2022 to 2032 to identify the prevailing burner management system market opportunities.
- The market research is offered along with information related to key drivers, restraints, and opportunities.
- Porter's five forces analysis highlights the potency of buyers and suppliers to enable stakeholders make profit-oriented business decisions and strengthen their supplier-buyer network.
- In-depth analysis of the burner management system market segmentation assists to determine the prevailing market opportunities.
- Major countries in each region are mapped according to their revenue contribution to the global market.
- Market player positioning facilitates benchmarking and provides a clear understanding of the present position of the market players.
- The report includes the analysis of the regional as well as global burner management system market trends, key players, market segments, application areas, and market growth strategies.
Key Market Segments
By Platform
- Programmable Logic Controller
- Distributed Control System
By Fuel
- Gas
- Oil
- Others
By End-use
- Oil and gas
- Power
- Pharmaceutical
- Chemical
- Others
By Component
- Software
- Hardware
By Application
- Multiple Burner
- Single Burner
By Region
- North America
- U.S.
- Canada
- Mexico
- Europe
- Germany
- UK
- France
- Spain
- Italy
- Rest of Europe
- Asia-Pacific
- China
- Japan
- India
- South Korea
- Australia
- Rest of Asia-Pacific
- LAMEA
- Brazil
- UAE
- Saudi Arabia
- South Africa
- Rest of LAMEA
Key Market Players:
- ABB
- ACL Manufacturing Inc.
- Cimarron Energy, INC.
- Combustex Corp.
- Emerson Electric Co.
- Honeywell International Inc.
- Pilz GmbH & Co. KG
- Rockwell Automation, Inc.
- Schneider Electric SE.
- tundra process solutions
TABLE OF CONTENTS
CHAPTER 1: INTRODUCTION
- 1.1. Report description
- 1.2. Key market segments
- 1.3. Key benefits to the stakeholders
- 1.4. Research Methodology
- 1.4.1. Primary research
- 1.4.2. Secondary research
- 1.4.3. Analyst tools and models
CHAPTER 2: EXECUTIVE SUMMARY
- 2.1. CXO Perspective
CHAPTER 3: MARKET OVERVIEW
- 3.1. Market definition and scope
- 3.2. Key findings
- 3.2.1. Top impacting factors
- 3.2.2. Top investment pockets
- 3.3. Porter's five forces analysis
- 3.4. Market dynamics
- 3.4.1. Drivers
- 3.4.2. Restraints
- 3.4.3. Opportunities
- 3.5. COVID-19 Impact Analysis on the market
- 3.6. Key Regulation Analysis
- 3.7. Market Share Analysis
- 3.8. Patent Landscape
- 3.9. Regulatory Guidelines
- 3.10. Value Chain Analysis
CHAPTER 4: BURNER MANAGEMENT SYSTEM MARKET, BY PLATFORM
- 4.1. Overview
- 4.1.1. Market size and forecast
- 4.2. Programmable Logic Controller
- 4.2.1. Key market trends, growth factors and opportunities
- 4.2.2. Market size and forecast, by region
- 4.2.3. Market share analysis by country
- 4.3. Distributed Control System
- 4.3.1. Key market trends, growth factors and opportunities
- 4.3.2. Market size and forecast, by region
- 4.3.3. Market share analysis by country
CHAPTER 5: BURNER MANAGEMENT SYSTEM MARKET, BY FUEL
- 5.1. Overview
- 5.1.1. Market size and forecast
- 5.2. Gas
- 5.2.1. Key market trends, growth factors and opportunities
- 5.2.2. Market size and forecast, by region
- 5.2.3. Market share analysis by country
- 5.3. Oil
- 5.3.1. Key market trends, growth factors and opportunities
- 5.3.2. Market size and forecast, by region
- 5.3.3. Market share analysis by country
- 5.4. Others
- 5.4.1. Key market trends, growth factors and opportunities
- 5.4.2. Market size and forecast, by region
- 5.4.3. Market share analysis by country
CHAPTER 6: BURNER MANAGEMENT SYSTEM MARKET, BY END-USE
- 6.1. Overview
- 6.1.1. Market size and forecast
- 6.2. Oil and gas
- 6.2.1. Key market trends, growth factors and opportunities
- 6.2.2. Market size and forecast, by region
- 6.2.3. Market share analysis by country
- 6.3. Power
- 6.3.1. Key market trends, growth factors and opportunities
- 6.3.2. Market size and forecast, by region
- 6.3.3. Market share analysis by country
- 6.4. Pharmaceutical
- 6.4.1. Key market trends, growth factors and opportunities
- 6.4.2. Market size and forecast, by region
- 6.4.3. Market share analysis by country
- 6.5. Chemical
- 6.5.1. Key market trends, growth factors and opportunities
- 6.5.2. Market size and forecast, by region
- 6.5.3. Market share analysis by country
- 6.6. Others
- 6.6.1. Key market trends, growth factors and opportunities
- 6.6.2. Market size and forecast, by region
- 6.6.3. Market share analysis by country
CHAPTER 7: BURNER MANAGEMENT SYSTEM MARKET, BY COMPONENT
- 7.1. Overview
- 7.1.1. Market size and forecast
- 7.2. Software
- 7.2.1. Key market trends, growth factors and opportunities
- 7.2.2. Market size and forecast, by region
- 7.2.3. Market share analysis by country
- 7.3. Hardware
- 7.3.1. Key market trends, growth factors and opportunities
- 7.3.2. Market size and forecast, by region
- 7.3.3. Market share analysis by country
CHAPTER 8: BURNER MANAGEMENT SYSTEM MARKET, BY APPLICATION
- 8.1. Overview
- 8.1.1. Market size and forecast
- 8.2. Multiple Burner
- 8.2.1. Key market trends, growth factors and opportunities
- 8.2.2. Market size and forecast, by region
- 8.2.3. Market share analysis by country
- 8.3. Single Burner
- 8.3.1. Key market trends, growth factors and opportunities
- 8.3.2. Market size and forecast, by region
- 8.3.3. Market share analysis by country
CHAPTER 9: BURNER MANAGEMENT SYSTEM MARKET, BY REGION
- 9.1. Overview
- 9.1.1. Market size and forecast By Region
- 9.2. North America
- 9.2.1. Key trends and opportunities
- 9.2.2. Market size and forecast, by Platform
- 9.2.3. Market size and forecast, by Fuel
- 9.2.4. Market size and forecast, by End-use
- 9.2.5. Market size and forecast, by Component
- 9.2.6. Market size and forecast, by Application
- 9.2.7. Market size and forecast, by country
- 9.2.7.1. U.S.
- 9.2.7.1.1. Key market trends, growth factors and opportunities
- 9.2.7.1.2. Market size and forecast, by Platform
- 9.2.7.1.3. Market size and forecast, by Fuel
- 9.2.7.1.4. Market size and forecast, by End-use
- 9.2.7.1.5. Market size and forecast, by Component
- 9.2.7.1.6. Market size and forecast, by Application
- 9.2.7.2. Canada
- 9.2.7.2.1. Key market trends, growth factors and opportunities
- 9.2.7.2.2. Market size and forecast, by Platform
- 9.2.7.2.3. Market size and forecast, by Fuel
- 9.2.7.2.4. Market size and forecast, by End-use
- 9.2.7.2.5. Market size and forecast, by Component
- 9.2.7.2.6. Market size and forecast, by Application
- 9.2.7.3. Mexico
- 9.2.7.3.1. Key market trends, growth factors and opportunities
- 9.2.7.3.2. Market size and forecast, by Platform
- 9.2.7.3.3. Market size and forecast, by Fuel
- 9.2.7.3.4. Market size and forecast, by End-use
- 9.2.7.3.5. Market size and forecast, by Component
- 9.2.7.3.6. Market size and forecast, by Application
- 9.3. Europe
- 9.3.1. Key trends and opportunities
- 9.3.2. Market size and forecast, by Platform
- 9.3.3. Market size and forecast, by Fuel
- 9.3.4. Market size and forecast, by End-use
- 9.3.5. Market size and forecast, by Component
- 9.3.6. Market size and forecast, by Application
- 9.3.7. Market size and forecast, by country
- 9.3.7.1. Germany
- 9.3.7.1.1. Key market trends, growth factors and opportunities
- 9.3.7.1.2. Market size and forecast, by Platform
- 9.3.7.1.3. Market size and forecast, by Fuel
- 9.3.7.1.4. Market size and forecast, by End-use
- 9.3.7.1.5. Market size and forecast, by Component
- 9.3.7.1.6. Market size and forecast, by Application
- 9.3.7.2. UK
- 9.3.7.2.1. Key market trends, growth factors and opportunities
- 9.3.7.2.2. Market size and forecast, by Platform
- 9.3.7.2.3. Market size and forecast, by Fuel
- 9.3.7.2.4. Market size and forecast, by End-use
- 9.3.7.2.5. Market size and forecast, by Component
- 9.3.7.2.6. Market size and forecast, by Application
- 9.3.7.3. France
- 9.3.7.3.1. Key market trends, growth factors and opportunities
- 9.3.7.3.2. Market size and forecast, by Platform
- 9.3.7.3.3. Market size and forecast, by Fuel
- 9.3.7.3.4. Market size and forecast, by End-use
- 9.3.7.3.5. Market size and forecast, by Component
- 9.3.7.3.6. Market size and forecast, by Application
- 9.3.7.4. Spain
- 9.3.7.4.1. Key market trends, growth factors and opportunities
- 9.3.7.4.2. Market size and forecast, by Platform
- 9.3.7.4.3. Market size and forecast, by Fuel
- 9.3.7.4.4. Market size and forecast, by End-use
- 9.3.7.4.5. Market size and forecast, by Component
- 9.3.7.4.6. Market size and forecast, by Application
- 9.3.7.5. Italy
- 9.3.7.5.1. Key market trends, growth factors and opportunities
- 9.3.7.5.2. Market size and forecast, by Platform
- 9.3.7.5.3. Market size and forecast, by Fuel
- 9.3.7.5.4. Market size and forecast, by End-use
- 9.3.7.5.5. Market size and forecast, by Component
- 9.3.7.5.6. Market size and forecast, by Application
- 9.3.7.6. Rest of Europe
- 9.3.7.6.1. Key market trends, growth factors and opportunities
- 9.3.7.6.2. Market size and forecast, by Platform
- 9.3.7.6.3. Market size and forecast, by Fuel
- 9.3.7.6.4. Market size and forecast, by End-use
- 9.3.7.6.5. Market size and forecast, by Component
- 9.3.7.6.6. Market size and forecast, by Application
- 9.4. Asia-Pacific
- 9.4.1. Key trends and opportunities
- 9.4.2. Market size and forecast, by Platform
- 9.4.3. Market size and forecast, by Fuel
- 9.4.4. Market size and forecast, by End-use
- 9.4.5. Market size and forecast, by Component
- 9.4.6. Market size and forecast, by Application
- 9.4.7. Market size and forecast, by country
- 9.4.7.1. China
- 9.4.7.1.1. Key market trends, growth factors and opportunities
- 9.4.7.1.2. Market size and forecast, by Platform
- 9.4.7.1.3. Market size and forecast, by Fuel
- 9.4.7.1.4. Market size and forecast, by End-use
- 9.4.7.1.5. Market size and forecast, by Component
- 9.4.7.1.6. Market size and forecast, by Application
- 9.4.7.2. Japan
- 9.4.7.2.1. Key market trends, growth factors and opportunities
- 9.4.7.2.2. Market size and forecast, by Platform
- 9.4.7.2.3. Market size and forecast, by Fuel
- 9.4.7.2.4. Market size and forecast, by End-use
- 9.4.7.2.5. Market size and forecast, by Component
- 9.4.7.2.6. Market size and forecast, by Application
- 9.4.7.3. India
- 9.4.7.3.1. Key market trends, growth factors and opportunities
- 9.4.7.3.2. Market size and forecast, by Platform
- 9.4.7.3.3. Market size and forecast, by Fuel
- 9.4.7.3.4. Market size and forecast, by End-use
- 9.4.7.3.5. Market size and forecast, by Component
- 9.4.7.3.6. Market size and forecast, by Application
- 9.4.7.4. South Korea
- 9.4.7.4.1. Key market trends, growth factors and opportunities
- 9.4.7.4.2. Market size and forecast, by Platform
- 9.4.7.4.3. Market size and forecast, by Fuel
- 9.4.7.4.4. Market size and forecast, by End-use
- 9.4.7.4.5. Market size and forecast, by Component
- 9.4.7.4.6. Market size and forecast, by Application
- 9.4.7.5. Australia
- 9.4.7.5.1. Key market trends, growth factors and opportunities
- 9.4.7.5.2. Market size and forecast, by Platform
- 9.4.7.5.3. Market size and forecast, by Fuel
- 9.4.7.5.4. Market size and forecast, by End-use
- 9.4.7.5.5. Market size and forecast, by Component
- 9.4.7.5.6. Market size and forecast, by Application
- 9.4.7.6. Rest of Asia-Pacific
- 9.4.7.6.1. Key market trends, growth factors and opportunities
- 9.4.7.6.2. Market size and forecast, by Platform
- 9.4.7.6.3. Market size and forecast, by Fuel
- 9.4.7.6.4. Market size and forecast, by End-use
- 9.4.7.6.5. Market size and forecast, by Component
- 9.4.7.6.6. Market size and forecast, by Application
- 9.5. LAMEA
- 9.5.1. Key trends and opportunities
- 9.5.2. Market size and forecast, by Platform
- 9.5.3. Market size and forecast, by Fuel
- 9.5.4. Market size and forecast, by End-use
- 9.5.5. Market size and forecast, by Component
- 9.5.6. Market size and forecast, by Application
- 9.5.7. Market size and forecast, by country
- 9.5.7.1. Brazil
- 9.5.7.1.1. Key market trends, growth factors and opportunities
- 9.5.7.1.2. Market size and forecast, by Platform
- 9.5.7.1.3. Market size and forecast, by Fuel
- 9.5.7.1.4. Market size and forecast, by End-use
- 9.5.7.1.5. Market size and forecast, by Component
- 9.5.7.1.6. Market size and forecast, by Application
- 9.5.7.2. UAE
- 9.5.7.2.1. Key market trends, growth factors and opportunities
- 9.5.7.2.2. Market size and forecast, by Platform
- 9.5.7.2.3. Market size and forecast, by Fuel
- 9.5.7.2.4. Market size and forecast, by End-use
- 9.5.7.2.5. Market size and forecast, by Component
- 9.5.7.2.6. Market size and forecast, by Application
- 9.5.7.3. Saudi Arabia
- 9.5.7.3.1. Key market trends, growth factors and opportunities
- 9.5.7.3.2. Market size and forecast, by Platform
- 9.5.7.3.3. Market size and forecast, by Fuel
- 9.5.7.3.4. Market size and forecast, by End-use
- 9.5.7.3.5. Market size and forecast, by Component
- 9.5.7.3.6. Market size and forecast, by Application
- 9.5.7.4. South Africa
- 9.5.7.4.1. Key market trends, growth factors and opportunities
- 9.5.7.4.2. Market size and forecast, by Platform
- 9.5.7.4.3. Market size and forecast, by Fuel
- 9.5.7.4.4. Market size and forecast, by End-use
- 9.5.7.4.5. Market size and forecast, by Component
- 9.5.7.4.6. Market size and forecast, by Application
- 9.5.7.5. Rest of LAMEA
- 9.5.7.5.1. Key market trends, growth factors and opportunities
- 9.5.7.5.2. Market size and forecast, by Platform
- 9.5.7.5.3. Market size and forecast, by Fuel
- 9.5.7.5.4. Market size and forecast, by End-use
- 9.5.7.5.5. Market size and forecast, by Component
- 9.5.7.5.6. Market size and forecast, by Application
CHAPTER 10: COMPETITIVE LANDSCAPE
- 10.1. Introduction
- 10.2. Top winning strategies
- 10.3. Product Mapping of Top 10 Player
- 10.4. Competitive Dashboard
- 10.5. Competitive Heatmap
- 10.6. Top player positioning, 2022
CHAPTER 11: COMPANY PROFILES
- 11.1. ABB
- 11.1.1. Company overview
- 11.1.2. Key Executives
- 11.1.3. Company snapshot
- 11.2. Cimarron Energy, INC.
- 11.2.1. Company overview
- 11.2.2. Key Executives
- 11.2.3. Company snapshot
- 11.3. Emerson Electric Co.
- 11.3.1. Company overview
- 11.3.2. Key Executives
- 11.3.3. Company snapshot
- 11.4. Honeywell International Inc.
- 11.4.1. Company overview
- 11.4.2. Key Executives
- 11.4.3. Company snapshot
- 11.5. Schneider Electric SE.
- 11.5.1. Company overview
- 11.5.2. Key Executives
- 11.5.3. Company snapshot
- 11.6. tundra process solutions
- 11.6.1. Company overview
- 11.6.2. Key Executives
- 11.6.3. Company snapshot
- 11.7. Pilz GmbH & Co. KG
- 11.7.1. Company overview
- 11.7.2. Key Executives
- 11.7.3. Company snapshot
- 11.8. ACL Manufacturing Inc.
- 11.8.1. Company overview
- 11.8.2. Key Executives
- 11.8.3. Company snapshot
- 11.9. Combustex Corp.
- 11.9.1. Company overview
- 11.9.2. Key Executives
- 11.9.3. Company snapshot
- 11.10. Rockwell Automation, Inc.
- 11.10.1. Company overview
- 11.10.2. Key Executives
- 11.10.3. Company snapshot
LIST OF TABLES
- TABLE 01. GLOBAL BURNER MANAGEMENT SYSTEM MARKET, BY PLATFORM, 2022-2032 ($MILLION)
- TABLE 02. BURNER MANAGEMENT SYSTEM MARKET FOR PROGRAMMABLE LOGIC CONTROLLER, BY REGION, 2022-2032 ($MILLION)
- TABLE 03. BURNER MANAGEMENT SYSTEM MARKET FOR DISTRIBUTED CONTROL SYSTEM, BY REGION, 2022-2032 ($MILLION)
- TABLE 04. GLOBAL BURNER MANAGEMENT SYSTEM MARKET, BY FUEL, 2022-2032 ($MILLION)
- TABLE 05. BURNER MANAGEMENT SYSTEM MARKET FOR GAS, BY REGION, 2022-2032 ($MILLION)
- TABLE 06. BURNER MANAGEMENT SYSTEM MARKET FOR OIL, BY REGION, 2022-2032 ($MILLION)
- TABLE 07. BURNER MANAGEMENT SYSTEM MARKET FOR OTHERS, BY REGION, 2022-2032 ($MILLION)
- TABLE 08. GLOBAL BURNER MANAGEMENT SYSTEM MARKET, BY END-USE, 2022-2032 ($MILLION)
- TABLE 09. BURNER MANAGEMENT SYSTEM MARKET FOR OIL AND GAS, BY REGION, 2022-2032 ($MILLION)
- TABLE 10. BURNER MANAGEMENT SYSTEM MARKET FOR POWER, BY REGION, 2022-2032 ($MILLION)
- TABLE 11. BURNER MANAGEMENT SYSTEM MARKET FOR PHARMACEUTICAL, BY REGION, 2022-2032 ($MILLION)
- TABLE 12. BURNER MANAGEMENT SYSTEM MARKET FOR CHEMICAL, BY REGION, 2022-2032 ($MILLION)
- TABLE 13. BURNER MANAGEMENT SYSTEM MARKET FOR OTHERS, BY REGION, 2022-2032 ($MILLION)
- TABLE 14. GLOBAL BURNER MANAGEMENT SYSTEM MARKET, BY COMPONENT, 2022-2032 ($MILLION)
- TABLE 15. BURNER MANAGEMENT SYSTEM MARKET FOR SOFTWARE, BY REGION, 2022-2032 ($MILLION)
- TABLE 16. BURNER MANAGEMENT SYSTEM MARKET FOR HARDWARE, BY REGION, 2022-2032 ($MILLION)
- TABLE 17. GLOBAL BURNER MANAGEMENT SYSTEM MARKET, BY APPLICATION, 2022-2032 ($MILLION)
- TABLE 18. BURNER MANAGEMENT SYSTEM MARKET FOR MULTIPLE BURNER, BY REGION, 2022-2032 ($MILLION)
- TABLE 19. BURNER MANAGEMENT SYSTEM MARKET FOR SINGLE BURNER, BY REGION, 2022-2032 ($MILLION)
- TABLE 20. BURNER MANAGEMENT SYSTEM MARKET, BY REGION, 2022-2032 ($MILLION)
- TABLE 21. NORTH AMERICA BURNER MANAGEMENT SYSTEM MARKET, BY PLATFORM, 2022-2032 ($MILLION)
- TABLE 22. NORTH AMERICA BURNER MANAGEMENT SYSTEM MARKET, BY FUEL, 2022-2032 ($MILLION)
- TABLE 23. NORTH AMERICA BURNER MANAGEMENT SYSTEM MARKET, BY END-USE, 2022-2032 ($MILLION)
- TABLE 24. NORTH AMERICA BURNER MANAGEMENT SYSTEM MARKET, BY COMPONENT, 2022-2032 ($MILLION)
- TABLE 25. NORTH AMERICA BURNER MANAGEMENT SYSTEM MARKET, BY APPLICATION, 2022-2032 ($MILLION)
- TABLE 26. NORTH AMERICA BURNER MANAGEMENT SYSTEM MARKET, BY COUNTRY, 2022-2032 ($MILLION)
- TABLE 27. U.S. BURNER MANAGEMENT SYSTEM MARKET, BY PLATFORM, 2022-2032 ($MILLION)
- TABLE 28. U.S. BURNER MANAGEMENT SYSTEM MARKET, BY FUEL, 2022-2032 ($MILLION)
- TABLE 29. U.S. BURNER MANAGEMENT SYSTEM MARKET, BY END-USE, 2022-2032 ($MILLION)
- TABLE 30. U.S. BURNER MANAGEMENT SYSTEM MARKET, BY COMPONENT, 2022-2032 ($MILLION)
- TABLE 31. U.S. BURNER MANAGEMENT SYSTEM MARKET, BY APPLICATION, 2022-2032 ($MILLION)
- TABLE 32. CANADA BURNER MANAGEMENT SYSTEM MARKET, BY PLATFORM, 2022-2032 ($MILLION)
- TABLE 33. CANADA BURNER MANAGEMENT SYSTEM MARKET, BY FUEL, 2022-2032 ($MILLION)
- TABLE 34. CANADA BURNER MANAGEMENT SYSTEM MARKET, BY END-USE, 2022-2032 ($MILLION)
- TABLE 35. CANADA BURNER MANAGEMENT SYSTEM MARKET, BY COMPONENT, 2022-2032 ($MILLION)
- TABLE 36. CANADA BURNER MANAGEMENT SYSTEM MARKET, BY APPLICATION, 2022-2032 ($MILLION)
- TABLE 37. MEXICO BURNER MANAGEMENT SYSTEM MARKET, BY PLATFORM, 2022-2032 ($MILLION)
- TABLE 38. MEXICO BURNER MANAGEMENT SYSTEM MARKET, BY FUEL, 2022-2032 ($MILLION)
- TABLE 39. MEXICO BURNER MANAGEMENT SYSTEM MARKET, BY END-USE, 2022-2032 ($MILLION)
- TABLE 40. MEXICO BURNER MANAGEMENT SYSTEM MARKET, BY COMPONENT, 2022-2032 ($MILLION)
- TABLE 41. MEXICO BURNER MANAGEMENT SYSTEM MARKET, BY APPLICATION, 2022-2032 ($MILLION)
- TABLE 42. EUROPE BURNER MANAGEMENT SYSTEM MARKET, BY PLATFORM, 2022-2032 ($MILLION)
- TABLE 43. EUROPE BURNER MANAGEMENT SYSTEM MARKET, BY FUEL, 2022-2032 ($MILLION)
- TABLE 44. EUROPE BURNER MANAGEMENT SYSTEM MARKET, BY END-USE, 2022-2032 ($MILLION)
- TABLE 45. EUROPE BURNER MANAGEMENT SYSTEM MARKET, BY COMPONENT, 2022-2032 ($MILLION)
- TABLE 46. EUROPE BURNER MANAGEMENT SYSTEM MARKET, BY APPLICATION, 2022-2032 ($MILLION)
- TABLE 47. EUROPE BURNER MANAGEMENT SYSTEM MARKET, BY COUNTRY, 2022-2032 ($MILLION)
- TABLE 48. GERMANY BURNER MANAGEMENT SYSTEM MARKET, BY PLATFORM, 2022-2032 ($MILLION)
- TABLE 49. GERMANY BURNER MANAGEMENT SYSTEM MARKET, BY FUEL, 2022-2032 ($MILLION)
- TABLE 50. GERMANY BURNER MANAGEMENT SYSTEM MARKET, BY END-USE, 2022-2032 ($MILLION)
- TABLE 51. GERMANY BURNER MANAGEMENT SYSTEM MARKET, BY COMPONENT, 2022-2032 ($MILLION)
- TABLE 52. GERMANY BURNER MANAGEMENT SYSTEM MARKET, BY APPLICATION, 2022-2032 ($MILLION)
- TABLE 53. UK BURNER MANAGEMENT SYSTEM MARKET, BY PLATFORM, 2022-2032 ($MILLION)
- TABLE 54. UK BURNER MANAGEMENT SYSTEM MARKET, BY FUEL, 2022-2032 ($MILLION)
- TABLE 55. UK BURNER MANAGEMENT SYSTEM MARKET, BY END-USE, 2022-2032 ($MILLION)
- TABLE 56. UK BURNER MANAGEMENT SYSTEM MARKET, BY COMPONENT, 2022-2032 ($MILLION)
- TABLE 57. UK BURNER MANAGEMENT SYSTEM MARKET, BY APPLICATION, 2022-2032 ($MILLION)
- TABLE 58. FRANCE BURNER MANAGEMENT SYSTEM MARKET, BY PLATFORM, 2022-2032 ($MILLION)
- TABLE 59. FRANCE BURNER MANAGEMENT SYSTEM MARKET, BY FUEL, 2022-2032 ($MILLION)
- TABLE 60. FRANCE BURNER MANAGEMENT SYSTEM MARKET, BY END-USE, 2022-2032 ($MILLION)
- TABLE 61. FRANCE BURNER MANAGEMENT SYSTEM MARKET, BY COMPONENT, 2022-2032 ($MILLION)
- TABLE 62. FRANCE BURNER MANAGEMENT SYSTEM MARKET, BY APPLICATION, 2022-2032 ($MILLION)
- TABLE 63. SPAIN BURNER MANAGEMENT SYSTEM MARKET, BY PLATFORM, 2022-2032 ($MILLION)
- TABLE 64. SPAIN BURNER MANAGEMENT SYSTEM MARKET, BY FUEL, 2022-2032 ($MILLION)
- TABLE 65. SPAIN BURNER MANAGEMENT SYSTEM MARKET, BY END-USE, 2022-2032 ($MILLION)
- TABLE 66. SPAIN BURNER MANAGEMENT SYSTEM MARKET, BY COMPONENT, 2022-2032 ($MILLION)
- TABLE 67. SPAIN BURNER MANAGEMENT SYSTEM MARKET, BY APPLICATION, 2022-2032 ($MILLION)
- TABLE 68. ITALY BURNER MANAGEMENT SYSTEM MARKET, BY PLATFORM, 2022-2032 ($MILLION)
- TABLE 69. ITALY BURNER MANAGEMENT SYSTEM MARKET, BY FUEL, 2022-2032 ($MILLION)
- TABLE 70. ITALY BURNER MANAGEMENT SYSTEM MARKET, BY END-USE, 2022-2032 ($MILLION)
- TABLE 71. ITALY BURNER MANAGEMENT SYSTEM MARKET, BY COMPONENT, 2022-2032 ($MILLION)
- TABLE 72. ITALY BURNER MANAGEMENT SYSTEM MARKET, BY APPLICATION, 2022-2032 ($MILLION)
- TABLE 73. REST OF EUROPE BURNER MANAGEMENT SYSTEM MARKET, BY PLATFORM, 2022-2032 ($MILLION)
- TABLE 74. REST OF EUROPE BURNER MANAGEMENT SYSTEM MARKET, BY FUEL, 2022-2032 ($MILLION)
- TABLE 75. REST OF EUROPE BURNER MANAGEMENT SYSTEM MARKET, BY END-USE, 2022-2032 ($MILLION)
- TABLE 76. REST OF EUROPE BURNER MANAGEMENT SYSTEM MARKET, BY COMPONENT, 2022-2032 ($MILLION)
- TABLE 77. REST OF EUROPE BURNER MANAGEMENT SYSTEM MARKET, BY APPLICATION, 2022-2032 ($MILLION)
- TABLE 78. ASIA-PACIFIC BURNER MANAGEMENT SYSTEM MARKET, BY PLATFORM, 2022-2032 ($MILLION)
- TABLE 79. ASIA-PACIFIC BURNER MANAGEMENT SYSTEM MARKET, BY FUEL, 2022-2032 ($MILLION)
- TABLE 80. ASIA-PACIFIC BURNER MANAGEMENT SYSTEM MARKET, BY END-USE, 2022-2032 ($MILLION)
- TABLE 81. ASIA-PACIFIC BURNER MANAGEMENT SYSTEM MARKET, BY COMPONENT, 2022-2032 ($MILLION)
- TABLE 82. ASIA-PACIFIC BURNER MANAGEMENT SYSTEM MARKET, BY APPLICATION, 2022-2032 ($MILLION)
- TABLE 83. ASIA-PACIFIC BURNER MANAGEMENT SYSTEM MARKET, BY COUNTRY, 2022-2032 ($MILLION)
- TABLE 84. CHINA BURNER MANAGEMENT SYSTEM MARKET, BY PLATFORM, 2022-2032 ($MILLION)
- TABLE 85. CHINA BURNER MANAGEMENT SYSTEM MARKET, BY FUEL, 2022-2032 ($MILLION)
- TABLE 86. CHINA BURNER MANAGEMENT SYSTEM MARKET, BY END-USE, 2022-2032 ($MILLION)
- TABLE 87. CHINA BURNER MANAGEMENT SYSTEM MARKET, BY COMPONENT, 2022-2032 ($MILLION)
- TABLE 88. CHINA BURNER MANAGEMENT SYSTEM MARKET, BY APPLICATION, 2022-2032 ($MILLION)
- TABLE 89. JAPAN BURNER MANAGEMENT SYSTEM MARKET, BY PLATFORM, 2022-2032 ($MILLION)
- TABLE 90. JAPAN BURNER MANAGEMENT SYSTEM MARKET, BY FUEL, 2022-2032 ($MILLION)
- TABLE 91. JAPAN BURNER MANAGEMENT SYSTEM MARKET, BY END-USE, 2022-2032 ($MILLION)
- TABLE 92. JAPAN BURNER MANAGEMENT SYSTEM MARKET, BY COMPONENT, 2022-2032 ($MILLION)
- TABLE 93. JAPAN BURNER MANAGEMENT SYSTEM MARKET, BY APPLICATION, 2022-2032 ($MILLION)
- TABLE 94. INDIA BURNER MANAGEMENT SYSTEM MARKET, BY PLATFORM, 2022-2032 ($MILLION)
- TABLE 95. INDIA BURNER MANAGEMENT SYSTEM MARKET, BY FUEL, 2022-2032 ($MILLION)
- TABLE 96. INDIA BURNER MANAGEMENT SYSTEM MARKET, BY END-USE, 2022-2032 ($MILLION)
- TABLE 97. INDIA BURNER MANAGEMENT SYSTEM MARKET, BY COMPONENT, 2022-2032 ($MILLION)
- TABLE 98. INDIA BURNER MANAGEMENT SYSTEM MARKET, BY APPLICATION, 2022-2032 ($MILLION)
- TABLE 99. SOUTH KOREA BURNER MANAGEMENT SYSTEM MARKET, BY PLATFORM, 2022-2032 ($MILLION)
- TABLE 100. SOUTH KOREA BURNER MANAGEMENT SYSTEM MARKET, BY FUEL, 2022-2032 ($MILLION)
- TABLE 101. SOUTH KOREA BURNER MANAGEMENT SYSTEM MARKET, BY END-USE, 2022-2032 ($MILLION)
- TABLE 102. SOUTH KOREA BURNER MANAGEMENT SYSTEM MARKET, BY COMPONENT, 2022-2032 ($MILLION)
- TABLE 103. SOUTH KOREA BURNER MANAGEMENT SYSTEM MARKET, BY APPLICATION, 2022-2032 ($MILLION)
- TABLE 104. AUSTRALIA BURNER MANAGEMENT SYSTEM MARKET, BY PLATFORM, 2022-2032 ($MILLION)
- TABLE 105. AUSTRALIA BURNER MANAGEMENT SYSTEM MARKET, BY FUEL, 2022-2032 ($MILLION)
- TABLE 106. AUSTRALIA BURNER MANAGEMENT SYSTEM MARKET, BY END-USE, 2022-2032 ($MILLION)
- TABLE 107. AUSTRALIA BURNER MANAGEMENT SYSTEM MARKET, BY COMPONENT, 2022-2032 ($MILLION)
- TABLE 108. AUSTRALIA BURNER MANAGEMENT SYSTEM MARKET, BY APPLICATION, 2022-2032 ($MILLION)
- TABLE 109. REST OF ASIA-PACIFIC BURNER MANAGEMENT SYSTEM MARKET, BY PLATFORM, 2022-2032 ($MILLION)
- TABLE 110. REST OF ASIA-PACIFIC BURNER MANAGEMENT SYSTEM MARKET, BY FUEL, 2022-2032 ($MILLION)
- TABLE 111. REST OF ASIA-PACIFIC BURNER MANAGEMENT SYSTEM MARKET, BY END-USE, 2022-2032 ($MILLION)
- TABLE 112. REST OF ASIA-PACIFIC BURNER MANAGEMENT SYSTEM MARKET, BY COMPONENT, 2022-2032 ($MILLION)
- TABLE 113. REST OF ASIA-PACIFIC BURNER MANAGEMENT SYSTEM MARKET, BY APPLICATION, 2022-2032 ($MILLION)
- TABLE 114. LAMEA BURNER MANAGEMENT SYSTEM MARKET, BY PLATFORM, 2022-2032 ($MILLION)
- TABLE 115. LAMEA BURNER MANAGEMENT SYSTEM MARKET, BY FUEL, 2022-2032 ($MILLION)
- TABLE 116. LAMEA BURNER MANAGEMENT SYSTEM MARKET, BY END-USE, 2022-2032 ($MILLION)
- TABLE 117. LAMEA BURNER MANAGEMENT SYSTEM MARKET, BY COMPONENT, 2022-2032 ($MILLION)
- TABLE 118. LAMEA BURNER MANAGEMENT SYSTEM MARKET, BY APPLICATION, 2022-2032 ($MILLION)
- TABLE 119. LAMEA BURNER MANAGEMENT SYSTEM MARKET, BY COUNTRY, 2022-2032 ($MILLION)
- TABLE 120. BRAZIL BURNER MANAGEMENT SYSTEM MARKET, BY PLATFORM, 2022-2032 ($MILLION)
- TABLE 121. BRAZIL BURNER MANAGEMENT SYSTEM MARKET, BY FUEL, 2022-2032 ($MILLION)
- TABLE 122. BRAZIL BURNER MANAGEMENT SYSTEM MARKET, BY END-USE, 2022-2032 ($MILLION)
- TABLE 123. BRAZIL BURNER MANAGEMENT SYSTEM MARKET, BY COMPONENT, 2022-2032 ($MILLION)
- TABLE 124. BRAZIL BURNER MANAGEMENT SYSTEM MARKET, BY APPLICATION, 2022-2032 ($MILLION)
- TABLE 125. UAE BURNER MANAGEMENT SYSTEM MARKET, BY PLATFORM, 2022-2032 ($MILLION)
- TABLE 126. UAE BURNER MANAGEMENT SYSTEM MARKET, BY FUEL, 2022-2032 ($MILLION)
- TABLE 127. UAE BURNER MANAGEMENT SYSTEM MARKET, BY END-USE, 2022-2032 ($MILLION)
- TABLE 128. UAE BURNER MANAGEMENT SYSTEM MARKET, BY COMPONENT, 2022-2032 ($MILLION)
- TABLE 129. UAE BURNER MANAGEMENT SYSTEM MARKET, BY APPLICATION, 2022-2032 ($MILLION)
- TABLE 130. SAUDI ARABIA BURNER MANAGEMENT SYSTEM MARKET, BY PLATFORM, 2022-2032 ($MILLION)
- TABLE 131. SAUDI ARABIA BURNER MANAGEMENT SYSTEM MARKET, BY FUEL, 2022-2032 ($MILLION)
- TABLE 132. SAUDI ARABIA BURNER MANAGEMENT SYSTEM MARKET, BY END-USE, 2022-2032 ($MILLION)
- TABLE 133. SAUDI ARABIA BURNER MANAGEMENT SYSTEM MARKET, BY COMPONENT, 2022-2032 ($MILLION)
- TABLE 134. SAUDI ARABIA BURNER MANAGEMENT SYSTEM MARKET, BY APPLICATION, 2022-2032 ($MILLION)
- TABLE 135. SOUTH AFRICA BURNER MANAGEMENT SYSTEM MARKET, BY PLATFORM, 2022-2032 ($MILLION)
- TABLE 136. SOUTH AFRICA BURNER MANAGEMENT SYSTEM MARKET, BY FUEL, 2022-2032 ($MILLION)
- TABLE 137. SOUTH AFRICA BURNER MANAGEMENT SYSTEM MARKET, BY END-USE, 2022-2032 ($MILLION)
- TABLE 138. SOUTH AFRICA BURNER MANAGEMENT SYSTEM MARKET, BY COMPONENT, 2022-2032 ($MILLION)
- TABLE 139. SOUTH AFRICA BURNER MANAGEMENT SYSTEM MARKET, BY APPLICATION, 2022-2032 ($MILLION)
- TABLE 140. REST OF LAMEA BURNER MANAGEMENT SYSTEM MARKET, BY PLATFORM, 2022-2032 ($MILLION)
- TABLE 141. REST OF LAMEA BURNER MANAGEMENT SYSTEM MARKET, BY FUEL, 2022-2032 ($MILLION)
- TABLE 142. REST OF LAMEA BURNER MANAGEMENT SYSTEM MARKET, BY END-USE, 2022-2032 ($MILLION)
- TABLE 143. REST OF LAMEA BURNER MANAGEMENT SYSTEM MARKET, BY COMPONENT, 2022-2032 ($MILLION)
- TABLE 144. REST OF LAMEA BURNER MANAGEMENT SYSTEM MARKET, BY APPLICATION, 2022-2032 ($MILLION)
- TABLE 145. ABB: KEY EXECUTIVES
- TABLE 146. ABB: COMPANY SNAPSHOT
- TABLE 147. CIMARRON ENERGY, INC.: KEY EXECUTIVES
- TABLE 148. CIMARRON ENERGY, INC.: COMPANY SNAPSHOT
- TABLE 149. EMERSON ELECTRIC CO.: KEY EXECUTIVES
- TABLE 150. EMERSON ELECTRIC CO.: COMPANY SNAPSHOT
- TABLE 151. HONEYWELL INTERNATIONAL INC.: KEY EXECUTIVES
- TABLE 152. HONEYWELL INTERNATIONAL INC.: COMPANY SNAPSHOT
- TABLE 153. SCHNEIDER ELECTRIC SE.: KEY EXECUTIVES
- TABLE 154. SCHNEIDER ELECTRIC SE.: COMPANY SNAPSHOT
- TABLE 155. TUNDRA PROCESS SOLUTIONS: KEY EXECUTIVES
- TABLE 156. TUNDRA PROCESS SOLUTIONS: COMPANY SNAPSHOT
- TABLE 157. PILZ GMBH & CO. KG: KEY EXECUTIVES
- TABLE 158. PILZ GMBH & CO. KG: COMPANY SNAPSHOT
- TABLE 159. ACL MANUFACTURING INC.: KEY EXECUTIVES
- TABLE 160. ACL MANUFACTURING INC.: COMPANY SNAPSHOT
- TABLE 161. COMBUSTEX CORP.: KEY EXECUTIVES
- TABLE 162. COMBUSTEX CORP.: COMPANY SNAPSHOT
- TABLE 163. ROCKWELL AUTOMATION, INC.: KEY EXECUTIVES
- TABLE 164. ROCKWELL AUTOMATION, INC.: COMPANY SNAPSHOT
LIST OF FIGURES
- FIGURE 01. BURNER MANAGEMENT SYSTEM MARKET, 2022-2032
- FIGURE 02. SEGMENTATION OF BURNER MANAGEMENT SYSTEM MARKET, 2022-2032
- FIGURE 03. TOP INVESTMENT POCKETS IN BURNER MANAGEMENT SYSTEM MARKET (2023-2032)
- FIGURE 04. PORTER FIVE-1
- FIGURE 05. PORTER FIVE-2
- FIGURE 06. PORTER FIVE-3
- FIGURE 07. PORTER FIVE-4
- FIGURE 08. PORTER FIVE-5
- FIGURE 09. DRIVERS, RESTRAINTS AND OPPORTUNITIES: GLOBALBURNER MANAGEMENT SYSTEM MARKET
- FIGURE 10. IMPACT OF KEY REGULATION: BURNER MANAGEMENT SYSTEM MARKET
- FIGURE 11. MARKET SHARE ANALYSIS: BURNER MANAGEMENT SYSTEM MARKET
- FIGURE 12. PATENT ANALYSIS BY COMPANY
- FIGURE 13. PATENT ANALYSIS BY COUNTRY
- FIGURE 14. REGULATORY GUIDELINES: BURNER MANAGEMENT SYSTEM MARKET
- FIGURE 15. VALUE CHAIN ANALYSIS: BURNER MANAGEMENT SYSTEM MARKET
- FIGURE 16. BURNER MANAGEMENT SYSTEM MARKET, BY PLATFORM, 2022(%)
- FIGURE 17. COMPARATIVE SHARE ANALYSIS OF BURNER MANAGEMENT SYSTEM MARKET FOR PROGRAMMABLE LOGIC CONTROLLER, BY COUNTRY 2022 AND 2032(%)
- FIGURE 18. COMPARATIVE SHARE ANALYSIS OF BURNER MANAGEMENT SYSTEM MARKET FOR DISTRIBUTED CONTROL SYSTEM, BY COUNTRY 2022 AND 2032(%)
- FIGURE 19. BURNER MANAGEMENT SYSTEM MARKET, BY FUEL, 2022(%)
- FIGURE 20. COMPARATIVE SHARE ANALYSIS OF BURNER MANAGEMENT SYSTEM MARKET FOR GAS, BY COUNTRY 2022 AND 2032(%)
- FIGURE 21. COMPARATIVE SHARE ANALYSIS OF BURNER MANAGEMENT SYSTEM MARKET FOR OIL, BY COUNTRY 2022 AND 2032(%)
- FIGURE 22. COMPARATIVE SHARE ANALYSIS OF BURNER MANAGEMENT SYSTEM MARKET FOR OTHERS, BY COUNTRY 2022 AND 2032(%)
- FIGURE 23. BURNER MANAGEMENT SYSTEM MARKET, BY END-USE, 2022(%)
- FIGURE 24. COMPARATIVE SHARE ANALYSIS OF BURNER MANAGEMENT SYSTEM MARKET FOR OIL AND GAS, BY COUNTRY 2022 AND 2032(%)
- FIGURE 25. COMPARATIVE SHARE ANALYSIS OF BURNER MANAGEMENT SYSTEM MARKET FOR POWER, BY COUNTRY 2022 AND 2032(%)
- FIGURE 26. COMPARATIVE SHARE ANALYSIS OF BURNER MANAGEMENT SYSTEM MARKET FOR PHARMACEUTICAL, BY COUNTRY 2022 AND 2032(%)
- FIGURE 27. COMPARATIVE SHARE ANALYSIS OF BURNER MANAGEMENT SYSTEM MARKET FOR CHEMICAL, BY COUNTRY 2022 AND 2032(%)
- FIGURE 28. COMPARATIVE SHARE ANALYSIS OF BURNER MANAGEMENT SYSTEM MARKET FOR OTHERS, BY COUNTRY 2022 AND 2032(%)
- FIGURE 29. BURNER MANAGEMENT SYSTEM MARKET, BY COMPONENT, 2022(%)
- FIGURE 30. COMPARATIVE SHARE ANALYSIS OF BURNER MANAGEMENT SYSTEM MARKET FOR SOFTWARE, BY COUNTRY 2022 AND 2032(%)
- FIGURE 31. COMPARATIVE SHARE ANALYSIS OF BURNER MANAGEMENT SYSTEM MARKET FOR HARDWARE, BY COUNTRY 2022 AND 2032(%)
- FIGURE 32. BURNER MANAGEMENT SYSTEM MARKET, BY APPLICATION, 2022(%)
- FIGURE 33. COMPARATIVE SHARE ANALYSIS OF BURNER MANAGEMENT SYSTEM MARKET FOR MULTIPLE BURNER, BY COUNTRY 2022 AND 2032(%)
- FIGURE 34. COMPARATIVE SHARE ANALYSIS OF BURNER MANAGEMENT SYSTEM MARKET FOR SINGLE BURNER, BY COUNTRY 2022 AND 2032(%)
- FIGURE 35. BURNER MANAGEMENT SYSTEM MARKET BY REGION, 2022
- FIGURE 36. U.S. BURNER MANAGEMENT SYSTEM MARKET, 2022-2032 ($MILLION)
- FIGURE 37. CANADA BURNER MANAGEMENT SYSTEM MARKET, 2022-2032 ($MILLION)
- FIGURE 38. MEXICO BURNER MANAGEMENT SYSTEM MARKET, 2022-2032 ($MILLION)
- FIGURE 39. GERMANY BURNER MANAGEMENT SYSTEM MARKET, 2022-2032 ($MILLION)
- FIGURE 40. UK BURNER MANAGEMENT SYSTEM MARKET, 2022-2032 ($MILLION)
- FIGURE 41. FRANCE BURNER MANAGEMENT SYSTEM MARKET, 2022-2032 ($MILLION)
- FIGURE 42. SPAIN BURNER MANAGEMENT SYSTEM MARKET, 2022-2032 ($MILLION)
- FIGURE 43. ITALY BURNER MANAGEMENT SYSTEM MARKET, 2022-2032 ($MILLION)
- FIGURE 44. REST OF EUROPE BURNER MANAGEMENT SYSTEM MARKET, 2022-2032 ($MILLION)
- FIGURE 45. CHINA BURNER MANAGEMENT SYSTEM MARKET, 2022-2032 ($MILLION)
- FIGURE 46. JAPAN BURNER MANAGEMENT SYSTEM MARKET, 2022-2032 ($MILLION)
- FIGURE 47. INDIA BURNER MANAGEMENT SYSTEM MARKET, 2022-2032 ($MILLION)
- FIGURE 48. SOUTH KOREA BURNER MANAGEMENT SYSTEM MARKET, 2022-2032 ($MILLION)
- FIGURE 49. AUSTRALIA BURNER MANAGEMENT SYSTEM MARKET, 2022-2032 ($MILLION)
- FIGURE 50. REST OF ASIA-PACIFIC BURNER MANAGEMENT SYSTEM MARKET, 2022-2032 ($MILLION)
- FIGURE 51. BRAZIL BURNER MANAGEMENT SYSTEM MARKET, 2022-2032 ($MILLION)
- FIGURE 52. UAE BURNER MANAGEMENT SYSTEM MARKET, 2022-2032 ($MILLION)
- FIGURE 53. SAUDI ARABIA BURNER MANAGEMENT SYSTEM MARKET, 2022-2032 ($MILLION)
- FIGURE 54. SOUTH AFRICA BURNER MANAGEMENT SYSTEM MARKET, 2022-2032 ($MILLION)
- FIGURE 55. REST OF LAMEA BURNER MANAGEMENT SYSTEM MARKET, 2022-2032 ($MILLION)
- FIGURE 56. TOP WINNING STRATEGIES, BY YEAR
- FIGURE 57. TOP WINNING STRATEGIES, BY DEVELOPMENT
- FIGURE 58. TOP WINNING STRATEGIES, BY COMPANY
- FIGURE 59. PRODUCT MAPPING OF TOP 10 PLAYERS
- FIGURE 60. COMPETITIVE DASHBOARD
- FIGURE 61. COMPETITIVE HEATMAP: BURNER MANAGEMENT SYSTEM MARKET
- FIGURE 62. TOP PLAYER POSITIONING, 2022

