
PUBLISHER: Allied Market Research | PRODUCT CODE: 1344327

PUBLISHER: Allied Market Research | PRODUCT CODE: 1344327
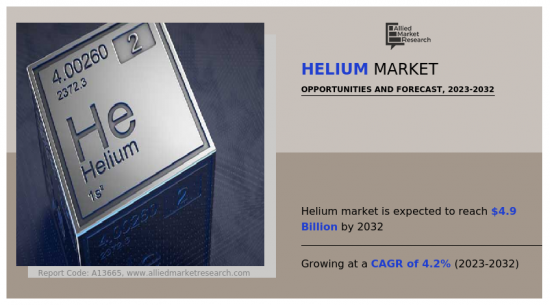
Helium Market By Phase Type, By Application, By End-Use Industry : Global Opportunity Analysis and Industry Forecast, 2023-2032
According to a new report published by Allied Market Research, titled, "Helium Market," The helium market was valued at $3.3 billion in 2022, and is estimated to reach $4.9 billion by 2032, growing at a CAGR of 4.2% from 2023 to 2032.
Helium possesses several unique properties that make it valuable for various applications. It has the lowest boiling point of any element, which allows it to remain in a gaseous state at extremely low temperatures. It is lighter than air, which enables it to rise and float, making it ideal for filling balloons and airships.
Helium has numerous applications in scientific research and experimentation. Its low boiling point and inert nature make it a crucial coolant in cryogenics, enabling scientists to achieve extremely low temperatures required for various studies, such as superconductivity and quantum mechanics. Helium finds application in gas chromatography, a scientific method utilized for the analysis and separation of intricate mixtures in the fields of chemistry and biology.
Helium plays a vital role in medical and healthcare applications. As a breathing gas used to treat respiratory conditions such as asthma and chronic obstructive pulmonary disease (COPD), helium is frequently combined with oxygen. Helium's low density lowers airway resistance and makes it easier for patients to breathe. Helium is also used to cool the superconducting magnets in magnetic resonance imaging (MRI) scanners.
One of the most well-known uses of helium is in filling balloons and airships. Due to its lighter-than-air property, helium enables balloons to float effortlessly in the sky. The use of helium in balloons is not limited to recreational purposes but also extends to meteorological research, aerial photography, and scientific experiments that require elevated observations or data collection. Helium's unique properties contribute to breakthroughs in scientific research, including discoveries in quantum physics and enabling the development of advanced technologies such as superconductivity and MRI scanning.
On the basis of phase type, the liquid segment is the fastest-growing segment of the helium market in 2022. Liquid helium is a widely utilized cryogenic coolant due to its exceptional ability to reach incredibly low temperatures. With a boiling point of -268.93 degrees Celsius (-452 degrees Fahrenheit), it is an ideal choice for maintaining extreme cold conditions in various scientific research applications. Specifically, it plays a crucial role in fields like superconductivity, low-temperature physics, and materials science. Liquid helium is indispensable for cooling superconducting magnets, which are integral components in advanced technologies such as MRI machines and particle accelerators.
On the basis of application, the breathing mixture segment is the fastest-growing segment of the helium market in 2022. Breathing mixtures that include helium are commonly used in certain specialized applications, such as deep-sea diving and aerospace activities. The addition of helium to breathing mixtures serves specific purposes based on the properties of the gas. Helium is often mixed with oxygen to create a breathing mixture called heliox, which is used in deep-sea diving. When diving at great depths, the increased pressure can cause a condition called nitrogen narcosis, also known as "rapture of the deep." To counteract this, helium is used to replace some or all of the nitrogen in the breathing mixture. Helium has a lower density and higher thermal conductivity than nitrogen, making it safer to use at extreme depths.
On the basis of the end-use industry, the others including automotive, metal fabrication, and others segment is the fastest-growing segment of the helium market in 2022. Helium-filled tires can provide advantages such as decreased weight, enhanced fuel efficiency, and improved heat dispersion. Moreover, helium finds application as a shielding gas in specific welding methods like gas tungsten arc welding (GTAW) or tungsten inert gas (TIG) welding. In these techniques, helium is combined with other gases, such as argon, to generate the desired protective environment around the welding arc. By incorporating helium, these processes achieve enhanced arc stability, elevated heat transfer, and prevention of metal oxidation during welding.
By region, the Asia-Pacific is the fastest-growing region of the helium market in 2022. The Asia-Pacific region is a leading hub for research and development in the field of cryogenics and superconductivity. Helium plays a crucial role as a cryogenic coolant in a wide range of applications such as superconducting magnets, MRI machines, particle accelerators, and NMR spectrometers. These technologies have significant implications for scientific research, healthcare, and materials science.
- In January 2021, the Lingang Economic District in China chose Fives Group to supply 13 Cryomec cryogenic centrifugal pumps for their upcoming air separation unit (ASU). The ASU is specifically designed to generate more than 2,000 tons of oxygen per day, highlighting the importance of cryogenics in large-scale industrial processes.
- The major players operating in the global helium market include Air Liquide S.A., Air Products & Chemicals Inc., ExxonMobil Corporation, Gazprom PJSC, Gulf Cryo S.A.L., IACX Energy, Linde plc, Matheson Tri-Gas, Inc., Praxair, Inc., and Taiyo Nippon Sanso Corporation.
Key Benefits For Stakeholders
- This report provides a quantitative analysis of the market segments, current trends, estimations, and dynamics of the helium market analysis from 2022 to 2032 to identify the prevailing helium market opportunities.
- The market research is offered along with information related to key drivers, restraints, and opportunities.
- Porter's five forces analysis highlights the potency of buyers and suppliers to enable stakeholders make profit-oriented business decisions and strengthen their supplier-buyer network.
- In-depth analysis of the helium market segmentation assists to determine the prevailing market opportunities.
- Major countries in each region are mapped according to their revenue contribution to the global market.
- Market player positioning facilitates benchmarking and provides a clear understanding of the present position of the market players.
- The report includes the analysis of the regional as well as global helium market trends, key players, market segments, application areas, and market growth strategies.
Key Market Segments
By Application
- Cryogenics
- Pressurizing and Purging
- Welding
- Controlled Atmosphere
- Leak Detection
- Breathing Mixture
- Others
By End-Use Industry
- Aerospace and Defense
- Medical and Healthcare
- Electricals and Electronics
- Others
By Phase Type
- Liquid
- Gaseous
By Region
- North America
- U.S.
- Canada
- Mexico
- Europe
- Germany
- France
- Italy
- Spain
- UK
- Rest of Europe
- Asia-Pacific
- China
- Japan
- India
- South Korea
- Rest of Asia-Pacific
- LAMEA
- Brazil
- Saudi Arabia
- South Africa
- Rest of LAMEA
Key Market Players:
- Air Liquide S.A.
- Air Products & Chemicals Inc.
- ExxonMobil Corporation
- Gazprom PJSC
- Gulf Cryo S.A.L.
- IACX Energy
- Linde plc
- Matheson Tri-Gas, Inc.
- Praxair, Inc.
- Taiyo Nippon Sanso Corporation
TABLE OF CONTENTS
CHAPTER 1: INTRODUCTION
- 1.1. Report description
- 1.2. Key market segments
- 1.3. Key benefits to the stakeholders
- 1.4. Research Methodology
- 1.4.1. Primary research
- 1.4.2. Secondary research
- 1.4.3. Analyst tools and models
CHAPTER 2: EXECUTIVE SUMMARY
- 2.1. CXO Perspective
CHAPTER 3: MARKET OVERVIEW
- 3.1. Market definition and scope
- 3.2. Key findings
- 3.2.1. Top impacting factors
- 3.2.2. Top investment pockets
- 3.3. Porter's five forces analysis
- 3.3.1. High bargaining power of suppliers
- 3.3.2. High threat of new entrants
- 3.3.3. Moderate threat of substitutes
- 3.3.4. Moderate intensity of rivalry
- 3.3.5. Moderate bargaining power of buyers
- 3.4. Market dynamics
- 3.4.1. Drivers
- 3.4.1.1. Advancements in technology with respect to helium
- 3.4.1.2. Rise in demand for helium in the healthcare sector
- 3.4.1. Drivers
- 3.4.2. Restraints
- 3.4.2.1. Limited helium reserves
- 3.4.3. Opportunities
- 3.4.3.1. Helium recycling and conservation
- 3.5. COVID-19 Impact Analysis on the market
- 3.6. Pricing Analysis
- 3.7. Value Chain Analysis
- 3.8. Key Regulation Analysis
CHAPTER 4: HELIUM MARKET, BY PHASE TYPE
- 4.1. Overview
- 4.1.1. Market size and forecast
- 4.2. Liquid
- 4.2.1. Key market trends, growth factors and opportunities
- 4.2.2. Market size and forecast, by region
- 4.2.3. Market share analysis by country
- 4.3. Gaseous
- 4.3.1. Key market trends, growth factors and opportunities
- 4.3.2. Market size and forecast, by region
- 4.3.3. Market share analysis by country
CHAPTER 5: HELIUM MARKET, BY APPLICATION
- 5.1. Overview
- 5.1.1. Market size and forecast
- 5.2. Cryogenics
- 5.2.1. Key market trends, growth factors and opportunities
- 5.2.2. Market size and forecast, by region
- 5.2.3. Market share analysis by country
- 5.3. Pressurizing and Purging
- 5.3.1. Key market trends, growth factors and opportunities
- 5.3.2. Market size and forecast, by region
- 5.3.3. Market share analysis by country
- 5.4. Welding
- 5.4.1. Key market trends, growth factors and opportunities
- 5.4.2. Market size and forecast, by region
- 5.4.3. Market share analysis by country
- 5.5. Controlled Atmosphere
- 5.5.1. Key market trends, growth factors and opportunities
- 5.5.2. Market size and forecast, by region
- 5.5.3. Market share analysis by country
- 5.6. Leak Detection
- 5.6.1. Key market trends, growth factors and opportunities
- 5.6.2. Market size and forecast, by region
- 5.6.3. Market share analysis by country
- 5.7. Breathing Mixture
- 5.7.1. Key market trends, growth factors and opportunities
- 5.7.2. Market size and forecast, by region
- 5.7.3. Market share analysis by country
- 5.8. Others
- 5.8.1. Key market trends, growth factors and opportunities
- 5.8.2. Market size and forecast, by region
- 5.8.3. Market share analysis by country
CHAPTER 6: HELIUM MARKET, BY END-USE INDUSTRY
- 6.1. Overview
- 6.1.1. Market size and forecast
- 6.2. Aerospace and Defense
- 6.2.1. Key market trends, growth factors and opportunities
- 6.2.2. Market size and forecast, by region
- 6.2.3. Market share analysis by country
- 6.3. Medical and Healthcare
- 6.3.1. Key market trends, growth factors and opportunities
- 6.3.2. Market size and forecast, by region
- 6.3.3. Market share analysis by country
- 6.4. Electricals and Electronics
- 6.4.1. Key market trends, growth factors and opportunities
- 6.4.2. Market size and forecast, by region
- 6.4.3. Market share analysis by country
- 6.5. Others
- 6.5.1. Key market trends, growth factors and opportunities
- 6.5.2. Market size and forecast, by region
- 6.5.3. Market share analysis by country
CHAPTER 7: HELIUM MARKET, BY REGION
- 7.1. Overview
- 7.1.1. Market size and forecast By Region
- 7.2. North America
- 7.2.1. Key trends and opportunities
- 7.2.2. Market size and forecast, by Phase Type
- 7.2.3. Market size and forecast, by Application
- 7.2.4. Market size and forecast, by End-Use Industry
- 7.2.5. Market size and forecast, by country
- 7.2.5.1. U.S.
- 7.2.5.1.1. Key market trends, growth factors and opportunities
- 7.2.5.1.2. Market size and forecast, by Phase Type
- 7.2.5.1.3. Market size and forecast, by Application
- 7.2.5.1.4. Market size and forecast, by End-Use Industry
- 7.2.5.2. Canada
- 7.2.5.2.1. Key market trends, growth factors and opportunities
- 7.2.5.2.2. Market size and forecast, by Phase Type
- 7.2.5.2.3. Market size and forecast, by Application
- 7.2.5.2.4. Market size and forecast, by End-Use Industry
- 7.2.5.3. Mexico
- 7.2.5.3.1. Key market trends, growth factors and opportunities
- 7.2.5.3.2. Market size and forecast, by Phase Type
- 7.2.5.3.3. Market size and forecast, by Application
- 7.2.5.3.4. Market size and forecast, by End-Use Industry
- 7.3. Europe
- 7.3.1. Key trends and opportunities
- 7.3.2. Market size and forecast, by Phase Type
- 7.3.3. Market size and forecast, by Application
- 7.3.4. Market size and forecast, by End-Use Industry
- 7.3.5. Market size and forecast, by country
- 7.3.5.1. Germany
- 7.3.5.1.1. Key market trends, growth factors and opportunities
- 7.3.5.1.2. Market size and forecast, by Phase Type
- 7.3.5.1.3. Market size and forecast, by Application
- 7.3.5.1.4. Market size and forecast, by End-Use Industry
- 7.3.5.2. France
- 7.3.5.2.1. Key market trends, growth factors and opportunities
- 7.3.5.2.2. Market size and forecast, by Phase Type
- 7.3.5.2.3. Market size and forecast, by Application
- 7.3.5.2.4. Market size and forecast, by End-Use Industry
- 7.3.5.3. Italy
- 7.3.5.3.1. Key market trends, growth factors and opportunities
- 7.3.5.3.2. Market size and forecast, by Phase Type
- 7.3.5.3.3. Market size and forecast, by Application
- 7.3.5.3.4. Market size and forecast, by End-Use Industry
- 7.3.5.4. Spain
- 7.3.5.4.1. Key market trends, growth factors and opportunities
- 7.3.5.4.2. Market size and forecast, by Phase Type
- 7.3.5.4.3. Market size and forecast, by Application
- 7.3.5.4.4. Market size and forecast, by End-Use Industry
- 7.3.5.5. UK
- 7.3.5.5.1. Key market trends, growth factors and opportunities
- 7.3.5.5.2. Market size and forecast, by Phase Type
- 7.3.5.5.3. Market size and forecast, by Application
- 7.3.5.5.4. Market size and forecast, by End-Use Industry
- 7.3.5.6. Rest of Europe
- 7.3.5.6.1. Key market trends, growth factors and opportunities
- 7.3.5.6.2. Market size and forecast, by Phase Type
- 7.3.5.6.3. Market size and forecast, by Application
- 7.3.5.6.4. Market size and forecast, by End-Use Industry
- 7.4. Asia-Pacific
- 7.4.1. Key trends and opportunities
- 7.4.2. Market size and forecast, by Phase Type
- 7.4.3. Market size and forecast, by Application
- 7.4.4. Market size and forecast, by End-Use Industry
- 7.4.5. Market size and forecast, by country
- 7.4.5.1. China
- 7.4.5.1.1. Key market trends, growth factors and opportunities
- 7.4.5.1.2. Market size and forecast, by Phase Type
- 7.4.5.1.3. Market size and forecast, by Application
- 7.4.5.1.4. Market size and forecast, by End-Use Industry
- 7.4.5.2. Japan
- 7.4.5.2.1. Key market trends, growth factors and opportunities
- 7.4.5.2.2. Market size and forecast, by Phase Type
- 7.4.5.2.3. Market size and forecast, by Application
- 7.4.5.2.4. Market size and forecast, by End-Use Industry
- 7.4.5.3. India
- 7.4.5.3.1. Key market trends, growth factors and opportunities
- 7.4.5.3.2. Market size and forecast, by Phase Type
- 7.4.5.3.3. Market size and forecast, by Application
- 7.4.5.3.4. Market size and forecast, by End-Use Industry
- 7.4.5.4. South Korea
- 7.4.5.4.1. Key market trends, growth factors and opportunities
- 7.4.5.4.2. Market size and forecast, by Phase Type
- 7.4.5.4.3. Market size and forecast, by Application
- 7.4.5.4.4. Market size and forecast, by End-Use Industry
- 7.4.5.5. Rest of Asia-Pacific
- 7.4.5.5.1. Key market trends, growth factors and opportunities
- 7.4.5.5.2. Market size and forecast, by Phase Type
- 7.4.5.5.3. Market size and forecast, by Application
- 7.4.5.5.4. Market size and forecast, by End-Use Industry
- 7.5. LAMEA
- 7.5.1. Key trends and opportunities
- 7.5.2. Market size and forecast, by Phase Type
- 7.5.3. Market size and forecast, by Application
- 7.5.4. Market size and forecast, by End-Use Industry
- 7.5.5. Market size and forecast, by country
- 7.5.5.1. Brazil
- 7.5.5.1.1. Key market trends, growth factors and opportunities
- 7.5.5.1.2. Market size and forecast, by Phase Type
- 7.5.5.1.3. Market size and forecast, by Application
- 7.5.5.1.4. Market size and forecast, by End-Use Industry
- 7.5.5.2. Saudi Arabia
- 7.5.5.2.1. Key market trends, growth factors and opportunities
- 7.5.5.2.2. Market size and forecast, by Phase Type
- 7.5.5.2.3. Market size and forecast, by Application
- 7.5.5.2.4. Market size and forecast, by End-Use Industry
- 7.5.5.3. South Africa
- 7.5.5.3.1. Key market trends, growth factors and opportunities
- 7.5.5.3.2. Market size and forecast, by Phase Type
- 7.5.5.3.3. Market size and forecast, by Application
- 7.5.5.3.4. Market size and forecast, by End-Use Industry
- 7.5.5.4. Rest of LAMEA
- 7.5.5.4.1. Key market trends, growth factors and opportunities
- 7.5.5.4.2. Market size and forecast, by Phase Type
- 7.5.5.4.3. Market size and forecast, by Application
- 7.5.5.4.4. Market size and forecast, by End-Use Industry
CHAPTER 8: COMPETITIVE LANDSCAPE
- 8.1. Introduction
- 8.2. Top winning strategies
- 8.3. Product Mapping of Top 10 Player
- 8.4. Competitive Dashboard
- 8.5. Competitive Heatmap
- 8.6. Top player positioning, 2022
CHAPTER 9: COMPANY PROFILES
- 9.1. Air Products & Chemicals Inc.
- 9.1.1. Company overview
- 9.1.2. Key Executives
- 9.1.3. Company snapshot
- 9.1.4. Operating business segments
- 9.1.5. Product portfolio
- 9.1.6. Business performance
- 9.2. Linde plc
- 9.2.1. Company overview
- 9.2.2. Key Executives
- 9.2.3. Company snapshot
- 9.2.4. Operating business segments
- 9.2.5. Product portfolio
- 9.2.6. Business performance
- 9.3. Praxair, Inc.
- 9.3.1. Company overview
- 9.3.2. Key Executives
- 9.3.3. Company snapshot
- 9.3.4. Operating business segments
- 9.3.5. Product portfolio
- 9.4. Air Liquide S.A.
- 9.4.1. Company overview
- 9.4.2. Key Executives
- 9.4.3. Company snapshot
- 9.4.4. Operating business segments
- 9.4.5. Product portfolio
- 9.4.6. Business performance
- 9.4.7. Key strategic moves and developments
- 9.5. Gazprom PJSC
- 9.5.1. Company overview
- 9.5.2. Key Executives
- 9.5.3. Company snapshot
- 9.5.4. Operating business segments
- 9.5.5. Product portfolio
- 9.5.6. Business performance
- 9.5.7. Key strategic moves and developments
- 9.6. ExxonMobil Corporation
- 9.6.1. Company overview
- 9.6.2. Key Executives
- 9.6.3. Company snapshot
- 9.6.4. Operating business segments
- 9.6.5. Product portfolio
- 9.6.6. Business performance
- 9.7. Gulf Cryo S.A.L.
- 9.7.1. Company overview
- 9.7.2. Key Executives
- 9.7.3. Company snapshot
- 9.7.4. Operating business segments
- 9.7.5. Product portfolio
- 9.8. IACX Energy
- 9.8.1. Company overview
- 9.8.2. Key Executives
- 9.8.3. Company snapshot
- 9.8.4. Operating business segments
- 9.8.5. Product portfolio
- 9.9. Matheson Tri-Gas, Inc.
- 9.9.1. Company overview
- 9.9.2. Key Executives
- 9.9.3. Company snapshot
- 9.9.4. Operating business segments
- 9.9.5. Product portfolio
- 9.10. Taiyo Nippon Sanso Corporation
- 9.10.1. Company overview
- 9.10.2. Key Executives
- 9.10.3. Company snapshot
- 9.10.4. Operating business segments
- 9.10.5. Product portfolio
LIST OF TABLES
- TABLE 01. GLOBAL HELIUM MARKET, BY PHASE TYPE, 2022-2032 ($MILLION)
- TABLE 02. GLOBAL HELIUM MARKET, BY PHASE TYPE, 2022-2032 (MILLION CUBIC FEET)
- TABLE 03. HELIUM MARKET FOR LIQUID, BY REGION, 2022-2032 ($MILLION)
- TABLE 04. HELIUM MARKET FOR LIQUID, BY REGION, 2022-2032 (MILLION CUBIC FEET)
- TABLE 05. HELIUM MARKET FOR GASEOUS, BY REGION, 2022-2032 ($MILLION)
- TABLE 06. HELIUM MARKET FOR GASEOUS, BY REGION, 2022-2032 (MILLION CUBIC FEET)
- TABLE 07. GLOBAL HELIUM MARKET, BY APPLICATION, 2022-2032 ($MILLION)
- TABLE 08. GLOBAL HELIUM MARKET, BY APPLICATION, 2022-2032 (MILLION CUBIC FEET)
- TABLE 09. HELIUM MARKET FOR CRYOGENICS, BY REGION, 2022-2032 ($MILLION)
- TABLE 10. HELIUM MARKET FOR CRYOGENICS, BY REGION, 2022-2032 (MILLION CUBIC FEET)
- TABLE 11. HELIUM MARKET FOR PRESSURIZING AND PURGING, BY REGION, 2022-2032 ($MILLION)
- TABLE 12. HELIUM MARKET FOR PRESSURIZING AND PURGING, BY REGION, 2022-2032 (MILLION CUBIC FEET)
- TABLE 13. HELIUM MARKET FOR WELDING, BY REGION, 2022-2032 ($MILLION)
- TABLE 14. HELIUM MARKET FOR WELDING, BY REGION, 2022-2032 (MILLION CUBIC FEET)
- TABLE 15. HELIUM MARKET FOR CONTROLLED ATMOSPHERE, BY REGION, 2022-2032 ($MILLION)
- TABLE 16. HELIUM MARKET FOR CONTROLLED ATMOSPHERE, BY REGION, 2022-2032 (MILLION CUBIC FEET)
- TABLE 17. HELIUM MARKET FOR LEAK DETECTION, BY REGION, 2022-2032 ($MILLION)
- TABLE 18. HELIUM MARKET FOR LEAK DETECTION, BY REGION, 2022-2032 (MILLION CUBIC FEET)
- TABLE 19. HELIUM MARKET FOR BREATHING MIXTURE, BY REGION, 2022-2032 ($MILLION)
- TABLE 20. HELIUM MARKET FOR BREATHING MIXTURE, BY REGION, 2022-2032 (MILLION CUBIC FEET)
- TABLE 21. HELIUM MARKET FOR OTHERS, BY REGION, 2022-2032 ($MILLION)
- TABLE 22. HELIUM MARKET FOR OTHERS, BY REGION, 2022-2032 (MILLION CUBIC FEET)
- TABLE 23. GLOBAL HELIUM MARKET, BY END-USE INDUSTRY, 2022-2032 ($MILLION)
- TABLE 24. GLOBAL HELIUM MARKET, BY END-USE INDUSTRY, 2022-2032 (MILLION CUBIC FEET)
- TABLE 25. HELIUM MARKET FOR AEROSPACE AND DEFENSE, BY REGION, 2022-2032 ($MILLION)
- TABLE 26. HELIUM MARKET FOR AEROSPACE AND DEFENSE, BY REGION, 2022-2032 (MILLION CUBIC FEET)
- TABLE 27. HELIUM MARKET FOR MEDICAL AND HEALTHCARE, BY REGION, 2022-2032 ($MILLION)
- TABLE 28. HELIUM MARKET FOR MEDICAL AND HEALTHCARE, BY REGION, 2022-2032 (MILLION CUBIC FEET)
- TABLE 29. HELIUM MARKET FOR ELECTRICALS AND ELECTRONICS, BY REGION, 2022-2032 ($MILLION)
- TABLE 30. HELIUM MARKET FOR ELECTRICALS AND ELECTRONICS, BY REGION, 2022-2032 (MILLION CUBIC FEET)
- TABLE 31. HELIUM MARKET FOR OTHERS, BY REGION, 2022-2032 ($MILLION)
- TABLE 32. HELIUM MARKET FOR OTHERS, BY REGION, 2022-2032 (MILLION CUBIC FEET)
- TABLE 33. HELIUM MARKET, BY REGION, 2022-2032 ($MILLION)
- TABLE 34. HELIUM MARKET, BY REGION, 2022-2032 (MILLION CUBIC FEET)
- TABLE 35. NORTH AMERICA HELIUM MARKET, BY PHASE TYPE, 2022-2032 ($MILLION)
- TABLE 36. NORTH AMERICA HELIUM MARKET, BY PHASE TYPE, 2022-2032 (MILLION CUBIC FEET)
- TABLE 37. NORTH AMERICA HELIUM MARKET, BY APPLICATION, 2022-2032 ($MILLION)
- TABLE 38. NORTH AMERICA HELIUM MARKET, BY APPLICATION, 2022-2032 (MILLION CUBIC FEET)
- TABLE 39. NORTH AMERICA HELIUM MARKET, BY END-USE INDUSTRY, 2022-2032 ($MILLION)
- TABLE 40. NORTH AMERICA HELIUM MARKET, BY END-USE INDUSTRY, 2022-2032 (MILLION CUBIC FEET)
- TABLE 41. NORTH AMERICA HELIUM MARKET, BY COUNTRY, 2022-2032 ($MILLION)
- TABLE 42. NORTH AMERICA HELIUM MARKET, BY COUNTRY, 2022-2032 (MILLION CUBIC FEET)
- TABLE 43. U.S. HELIUM MARKET, BY PHASE TYPE, 2022-2032 ($MILLION)
- TABLE 44. U.S. HELIUM MARKET, BY PHASE TYPE, 2022-2032 (MILLION CUBIC FEET)
- TABLE 45. U.S. HELIUM MARKET, BY APPLICATION, 2022-2032 ($MILLION)
- TABLE 46. U.S. HELIUM MARKET, BY APPLICATION, 2022-2032 (MILLION CUBIC FEET)
- TABLE 47. U.S. HELIUM MARKET, BY END-USE INDUSTRY, 2022-2032 ($MILLION)
- TABLE 48. U.S. HELIUM MARKET, BY END-USE INDUSTRY, 2022-2032 (MILLION CUBIC FEET)
- TABLE 49. CANADA HELIUM MARKET, BY PHASE TYPE, 2022-2032 ($MILLION)
- TABLE 50. CANADA HELIUM MARKET, BY PHASE TYPE, 2022-2032 (MILLION CUBIC FEET)
- TABLE 51. CANADA HELIUM MARKET, BY APPLICATION, 2022-2032 ($MILLION)
- TABLE 52. CANADA HELIUM MARKET, BY APPLICATION, 2022-2032 (MILLION CUBIC FEET)
- TABLE 53. CANADA HELIUM MARKET, BY END-USE INDUSTRY, 2022-2032 ($MILLION)
- TABLE 54. CANADA HELIUM MARKET, BY END-USE INDUSTRY, 2022-2032 (MILLION CUBIC FEET)
- TABLE 55. MEXICO HELIUM MARKET, BY PHASE TYPE, 2022-2032 ($MILLION)
- TABLE 56. MEXICO HELIUM MARKET, BY PHASE TYPE, 2022-2032 (MILLION CUBIC FEET)
- TABLE 57. MEXICO HELIUM MARKET, BY APPLICATION, 2022-2032 ($MILLION)
- TABLE 58. MEXICO HELIUM MARKET, BY APPLICATION, 2022-2032 (MILLION CUBIC FEET)
- TABLE 59. MEXICO HELIUM MARKET, BY END-USE INDUSTRY, 2022-2032 ($MILLION)
- TABLE 60. MEXICO HELIUM MARKET, BY END-USE INDUSTRY, 2022-2032 (MILLION CUBIC FEET)
- TABLE 61. EUROPE HELIUM MARKET, BY PHASE TYPE, 2022-2032 ($MILLION)
- TABLE 62. EUROPE HELIUM MARKET, BY PHASE TYPE, 2022-2032 (MILLION CUBIC FEET)
- TABLE 63. EUROPE HELIUM MARKET, BY APPLICATION, 2022-2032 ($MILLION)
- TABLE 64. EUROPE HELIUM MARKET, BY APPLICATION, 2022-2032 (MILLION CUBIC FEET)
- TABLE 65. EUROPE HELIUM MARKET, BY END-USE INDUSTRY, 2022-2032 ($MILLION)
- TABLE 66. EUROPE HELIUM MARKET, BY END-USE INDUSTRY, 2022-2032 (MILLION CUBIC FEET)
- TABLE 67. EUROPE HELIUM MARKET, BY COUNTRY, 2022-2032 ($MILLION)
- TABLE 68. EUROPE HELIUM MARKET, BY COUNTRY, 2022-2032 (MILLION CUBIC FEET)
- TABLE 69. GERMANY HELIUM MARKET, BY PHASE TYPE, 2022-2032 ($MILLION)
- TABLE 70. GERMANY HELIUM MARKET, BY PHASE TYPE, 2022-2032 (MILLION CUBIC FEET)
- TABLE 71. GERMANY HELIUM MARKET, BY APPLICATION, 2022-2032 ($MILLION)
- TABLE 72. GERMANY HELIUM MARKET, BY APPLICATION, 2022-2032 (MILLION CUBIC FEET)
- TABLE 73. GERMANY HELIUM MARKET, BY END-USE INDUSTRY, 2022-2032 ($MILLION)
- TABLE 74. GERMANY HELIUM MARKET, BY END-USE INDUSTRY, 2022-2032 (MILLION CUBIC FEET)
- TABLE 75. FRANCE HELIUM MARKET, BY PHASE TYPE, 2022-2032 ($MILLION)
- TABLE 76. FRANCE HELIUM MARKET, BY PHASE TYPE, 2022-2032 (MILLION CUBIC FEET)
- TABLE 77. FRANCE HELIUM MARKET, BY APPLICATION, 2022-2032 ($MILLION)
- TABLE 78. FRANCE HELIUM MARKET, BY APPLICATION, 2022-2032 (MILLION CUBIC FEET)
- TABLE 79. FRANCE HELIUM MARKET, BY END-USE INDUSTRY, 2022-2032 ($MILLION)
- TABLE 80. FRANCE HELIUM MARKET, BY END-USE INDUSTRY, 2022-2032 (MILLION CUBIC FEET)
- TABLE 81. ITALY HELIUM MARKET, BY PHASE TYPE, 2022-2032 ($MILLION)
- TABLE 82. ITALY HELIUM MARKET, BY PHASE TYPE, 2022-2032 (MILLION CUBIC FEET)
- TABLE 83. ITALY HELIUM MARKET, BY APPLICATION, 2022-2032 ($MILLION)
- TABLE 84. ITALY HELIUM MARKET, BY APPLICATION, 2022-2032 (MILLION CUBIC FEET)
- TABLE 85. ITALY HELIUM MARKET, BY END-USE INDUSTRY, 2022-2032 ($MILLION)
- TABLE 86. ITALY HELIUM MARKET, BY END-USE INDUSTRY, 2022-2032 (MILLION CUBIC FEET)
- TABLE 87. SPAIN HELIUM MARKET, BY PHASE TYPE, 2022-2032 ($MILLION)
- TABLE 88. SPAIN HELIUM MARKET, BY PHASE TYPE, 2022-2032 (MILLION CUBIC FEET)
- TABLE 89. SPAIN HELIUM MARKET, BY APPLICATION, 2022-2032 ($MILLION)
- TABLE 90. SPAIN HELIUM MARKET, BY APPLICATION, 2022-2032 (MILLION CUBIC FEET)
- TABLE 91. SPAIN HELIUM MARKET, BY END-USE INDUSTRY, 2022-2032 ($MILLION)
- TABLE 92. SPAIN HELIUM MARKET, BY END-USE INDUSTRY, 2022-2032 (MILLION CUBIC FEET)
- TABLE 93. UK HELIUM MARKET, BY PHASE TYPE, 2022-2032 ($MILLION)
- TABLE 94. UK HELIUM MARKET, BY PHASE TYPE, 2022-2032 (MILLION CUBIC FEET)
- TABLE 95. UK HELIUM MARKET, BY APPLICATION, 2022-2032 ($MILLION)
- TABLE 96. UK HELIUM MARKET, BY APPLICATION, 2022-2032 (MILLION CUBIC FEET)
- TABLE 97. UK HELIUM MARKET, BY END-USE INDUSTRY, 2022-2032 ($MILLION)
- TABLE 98. UK HELIUM MARKET, BY END-USE INDUSTRY, 2022-2032 (MILLION CUBIC FEET)
- TABLE 99. REST OF EUROPE HELIUM MARKET, BY PHASE TYPE, 2022-2032 ($MILLION)
- TABLE 100. REST OF EUROPE HELIUM MARKET, BY PHASE TYPE, 2022-2032 (MILLION CUBIC FEET)
- TABLE 101. REST OF EUROPE HELIUM MARKET, BY APPLICATION, 2022-2032 ($MILLION)
- TABLE 102. REST OF EUROPE HELIUM MARKET, BY APPLICATION, 2022-2032 (MILLION CUBIC FEET)
- TABLE 103. REST OF EUROPE HELIUM MARKET, BY END-USE INDUSTRY, 2022-2032 ($MILLION)
- TABLE 104. REST OF EUROPE HELIUM MARKET, BY END-USE INDUSTRY, 2022-2032 (MILLION CUBIC FEET)
- TABLE 105. ASIA-PACIFIC HELIUM MARKET, BY PHASE TYPE, 2022-2032 ($MILLION)
- TABLE 106. ASIA-PACIFIC HELIUM MARKET, BY PHASE TYPE, 2022-2032 (MILLION CUBIC FEET)
- TABLE 107. ASIA-PACIFIC HELIUM MARKET, BY APPLICATION, 2022-2032 ($MILLION)
- TABLE 108. ASIA-PACIFIC HELIUM MARKET, BY APPLICATION, 2022-2032 (MILLION CUBIC FEET)
- TABLE 109. ASIA-PACIFIC HELIUM MARKET, BY END-USE INDUSTRY, 2022-2032 ($MILLION)
- TABLE 110. ASIA-PACIFIC HELIUM MARKET, BY END-USE INDUSTRY, 2022-2032 (MILLION CUBIC FEET)
- TABLE 111. ASIA-PACIFIC HELIUM MARKET, BY COUNTRY, 2022-2032 ($MILLION)
- TABLE 112. ASIA-PACIFIC HELIUM MARKET, BY COUNTRY, 2022-2032 (MILLION CUBIC FEET)
- TABLE 113. CHINA HELIUM MARKET, BY PHASE TYPE, 2022-2032 ($MILLION)
- TABLE 114. CHINA HELIUM MARKET, BY PHASE TYPE, 2022-2032 (MILLION CUBIC FEET)
- TABLE 115. CHINA HELIUM MARKET, BY APPLICATION, 2022-2032 ($MILLION)
- TABLE 116. CHINA HELIUM MARKET, BY APPLICATION, 2022-2032 (MILLION CUBIC FEET)
- TABLE 117. CHINA HELIUM MARKET, BY END-USE INDUSTRY, 2022-2032 ($MILLION)
- TABLE 118. CHINA HELIUM MARKET, BY END-USE INDUSTRY, 2022-2032 (MILLION CUBIC FEET)
- TABLE 119. JAPAN HELIUM MARKET, BY PHASE TYPE, 2022-2032 ($MILLION)
- TABLE 120. JAPAN HELIUM MARKET, BY PHASE TYPE, 2022-2032 (MILLION CUBIC FEET)
- TABLE 121. JAPAN HELIUM MARKET, BY APPLICATION, 2022-2032 ($MILLION)
- TABLE 122. JAPAN HELIUM MARKET, BY APPLICATION, 2022-2032 (MILLION CUBIC FEET)
- TABLE 123. JAPAN HELIUM MARKET, BY END-USE INDUSTRY, 2022-2032 ($MILLION)
- TABLE 124. JAPAN HELIUM MARKET, BY END-USE INDUSTRY, 2022-2032 (MILLION CUBIC FEET)
- TABLE 125. INDIA HELIUM MARKET, BY PHASE TYPE, 2022-2032 ($MILLION)
- TABLE 126. INDIA HELIUM MARKET, BY PHASE TYPE, 2022-2032 (MILLION CUBIC FEET)
- TABLE 127. INDIA HELIUM MARKET, BY APPLICATION, 2022-2032 ($MILLION)
- TABLE 128. INDIA HELIUM MARKET, BY APPLICATION, 2022-2032 (MILLION CUBIC FEET)
- TABLE 129. INDIA HELIUM MARKET, BY END-USE INDUSTRY, 2022-2032 ($MILLION)
- TABLE 130. INDIA HELIUM MARKET, BY END-USE INDUSTRY, 2022-2032 (MILLION CUBIC FEET)
- TABLE 131. SOUTH KOREA HELIUM MARKET, BY PHASE TYPE, 2022-2032 ($MILLION)
- TABLE 132. SOUTH KOREA HELIUM MARKET, BY PHASE TYPE, 2022-2032 (MILLION CUBIC FEET)
- TABLE 133. SOUTH KOREA HELIUM MARKET, BY APPLICATION, 2022-2032 ($MILLION)
- TABLE 134. SOUTH KOREA HELIUM MARKET, BY APPLICATION, 2022-2032 (MILLION CUBIC FEET)
- TABLE 135. SOUTH KOREA HELIUM MARKET, BY END-USE INDUSTRY, 2022-2032 ($MILLION)
- TABLE 136. SOUTH KOREA HELIUM MARKET, BY END-USE INDUSTRY, 2022-2032 (MILLION CUBIC FEET)
- TABLE 137. REST OF ASIA-PACIFIC HELIUM MARKET, BY PHASE TYPE, 2022-2032 ($MILLION)
- TABLE 138. REST OF ASIA-PACIFIC HELIUM MARKET, BY PHASE TYPE, 2022-2032 (MILLION CUBIC FEET)
- TABLE 139. REST OF ASIA-PACIFIC HELIUM MARKET, BY APPLICATION, 2022-2032 ($MILLION)
- TABLE 140. REST OF ASIA-PACIFIC HELIUM MARKET, BY APPLICATION, 2022-2032 (MILLION CUBIC FEET)
- TABLE 141. REST OF ASIA-PACIFIC HELIUM MARKET, BY END-USE INDUSTRY, 2022-2032 ($MILLION)
- TABLE 142. REST OF ASIA-PACIFIC HELIUM MARKET, BY END-USE INDUSTRY, 2022-2032 (MILLION CUBIC FEET)
- TABLE 143. LAMEA HELIUM MARKET, BY PHASE TYPE, 2022-2032 ($MILLION)
- TABLE 144. LAMEA HELIUM MARKET, BY PHASE TYPE, 2022-2032 (MILLION CUBIC FEET)
- TABLE 145. LAMEA HELIUM MARKET, BY APPLICATION, 2022-2032 ($MILLION)
- TABLE 146. LAMEA HELIUM MARKET, BY APPLICATION, 2022-2032 (MILLION CUBIC FEET)
- TABLE 147. LAMEA HELIUM MARKET, BY END-USE INDUSTRY, 2022-2032 ($MILLION)
- TABLE 148. LAMEA HELIUM MARKET, BY END-USE INDUSTRY, 2022-2032 (MILLION CUBIC FEET)
- TABLE 149. LAMEA HELIUM MARKET, BY COUNTRY, 2022-2032 ($MILLION)
- TABLE 150. LAMEA HELIUM MARKET, BY COUNTRY, 2022-2032 (MILLION CUBIC FEET)
- TABLE 151. BRAZIL HELIUM MARKET, BY PHASE TYPE, 2022-2032 ($MILLION)
- TABLE 152. BRAZIL HELIUM MARKET, BY PHASE TYPE, 2022-2032 (MILLION CUBIC FEET)
- TABLE 153. BRAZIL HELIUM MARKET, BY APPLICATION, 2022-2032 ($MILLION)
- TABLE 154. BRAZIL HELIUM MARKET, BY APPLICATION, 2022-2032 (MILLION CUBIC FEET)
- TABLE 155. BRAZIL HELIUM MARKET, BY END-USE INDUSTRY, 2022-2032 ($MILLION)
- TABLE 156. BRAZIL HELIUM MARKET, BY END-USE INDUSTRY, 2022-2032 (MILLION CUBIC FEET)
- TABLE 157. SAUDI ARABIA HELIUM MARKET, BY PHASE TYPE, 2022-2032 ($MILLION)
- TABLE 158. SAUDI ARABIA HELIUM MARKET, BY PHASE TYPE, 2022-2032 (MILLION CUBIC FEET)
- TABLE 159. SAUDI ARABIA HELIUM MARKET, BY APPLICATION, 2022-2032 ($MILLION)
- TABLE 160. SAUDI ARABIA HELIUM MARKET, BY APPLICATION, 2022-2032 (MILLION CUBIC FEET)
- TABLE 161. SAUDI ARABIA HELIUM MARKET, BY END-USE INDUSTRY, 2022-2032 ($MILLION)
- TABLE 162. SAUDI ARABIA HELIUM MARKET, BY END-USE INDUSTRY, 2022-2032 (MILLION CUBIC FEET)
- TABLE 163. SOUTH AFRICA HELIUM MARKET, BY PHASE TYPE, 2022-2032 ($MILLION)
- TABLE 164. SOUTH AFRICA HELIUM MARKET, BY PHASE TYPE, 2022-2032 (MILLION CUBIC FEET)
- TABLE 165. SOUTH AFRICA HELIUM MARKET, BY APPLICATION, 2022-2032 ($MILLION)
- TABLE 166. SOUTH AFRICA HELIUM MARKET, BY APPLICATION, 2022-2032 (MILLION CUBIC FEET)
- TABLE 167. SOUTH AFRICA HELIUM MARKET, BY END-USE INDUSTRY, 2022-2032 ($MILLION)
- TABLE 168. SOUTH AFRICA HELIUM MARKET, BY END-USE INDUSTRY, 2022-2032 (MILLION CUBIC FEET)
- TABLE 169. REST OF LAMEA HELIUM MARKET, BY PHASE TYPE, 2022-2032 ($MILLION)
- TABLE 170. REST OF LAMEA HELIUM MARKET, BY PHASE TYPE, 2022-2032 (MILLION CUBIC FEET)
- TABLE 171. REST OF LAMEA HELIUM MARKET, BY APPLICATION, 2022-2032 ($MILLION)
- TABLE 172. REST OF LAMEA HELIUM MARKET, BY APPLICATION, 2022-2032 (MILLION CUBIC FEET)
- TABLE 173. REST OF LAMEA HELIUM MARKET, BY END-USE INDUSTRY, 2022-2032 ($MILLION)
- TABLE 174. REST OF LAMEA HELIUM MARKET, BY END-USE INDUSTRY, 2022-2032 (MILLION CUBIC FEET)
- TABLE 175. AIR PRODUCTS & CHEMICALS INC.: KEY EXECUTIVES
- TABLE 176. AIR PRODUCTS & CHEMICALS INC.: COMPANY SNAPSHOT
- TABLE 177. AIR PRODUCTS & CHEMICALS INC.: PRODUCT SEGMENTS
- TABLE 178. AIR PRODUCTS & CHEMICALS INC.: PRODUCT PORTFOLIO
- TABLE 179. LINDE PLC: KEY EXECUTIVES
- TABLE 180. LINDE PLC: COMPANY SNAPSHOT
- TABLE 181. LINDE PLC: PRODUCT SEGMENTS
- TABLE 182. LINDE PLC: PRODUCT PORTFOLIO
- TABLE 183. PRAXAIR, INC.: KEY EXECUTIVES
- TABLE 184. PRAXAIR, INC.: COMPANY SNAPSHOT
- TABLE 185. PRAXAIR, INC.: PRODUCT SEGMENTS
- TABLE 186. PRAXAIR, INC.: PRODUCT PORTFOLIO
- TABLE 187. AIR LIQUIDE S.A.: KEY EXECUTIVES
- TABLE 188. AIR LIQUIDE S.A.: COMPANY SNAPSHOT
- TABLE 189. AIR LIQUIDE S.A.: PRODUCT SEGMENTS
- TABLE 190. AIR LIQUIDE S.A.: PRODUCT PORTFOLIO
- TABLE 191. AIR LIQUIDE S.A.: KEY STRATERGIES
- TABLE 192. GAZPROM PJSC: KEY EXECUTIVES
- TABLE 193. GAZPROM PJSC: COMPANY SNAPSHOT
- TABLE 194. GAZPROM PJSC: SERVICE SEGMENTS
- TABLE 195. GAZPROM PJSC: PRODUCT PORTFOLIO
- TABLE 196. GAZPROM PJSC: KEY STRATERGIES
- TABLE 197. EXXONMOBIL CORPORATION: KEY EXECUTIVES
- TABLE 198. EXXONMOBIL CORPORATION: COMPANY SNAPSHOT
- TABLE 199. EXXONMOBIL CORPORATION: PRODUCT SEGMENTS
- TABLE 200. EXXONMOBIL CORPORATION: PRODUCT PORTFOLIO
- TABLE 201. GULF CRYO S.A.L.: KEY EXECUTIVES
- TABLE 202. GULF CRYO S.A.L.: COMPANY SNAPSHOT
- TABLE 203. GULF CRYO S.A.L.: PRODUCT SEGMENTS
- TABLE 204. GULF CRYO S.A.L.: PRODUCT PORTFOLIO
- TABLE 205. IACX ENERGY: KEY EXECUTIVES
- TABLE 206. IACX ENERGY: COMPANY SNAPSHOT
- TABLE 207. IACX ENERGY: SERVICE SEGMENTS
- TABLE 208. IACX ENERGY: PRODUCT PORTFOLIO
- TABLE 209. MATHESON TRI-GAS, INC.: KEY EXECUTIVES
- TABLE 210. MATHESON TRI-GAS, INC.: COMPANY SNAPSHOT
- TABLE 211. MATHESON TRI-GAS, INC.: PRODUCT SEGMENTS
- TABLE 212. MATHESON TRI-GAS, INC.: PRODUCT PORTFOLIO
- TABLE 213. TAIYO NIPPON SANSO CORPORATION: KEY EXECUTIVES
- TABLE 214. TAIYO NIPPON SANSO CORPORATION: COMPANY SNAPSHOT
- TABLE 215. TAIYO NIPPON SANSO CORPORATION: PRODUCT SEGMENTS
- TABLE 216. TAIYO NIPPON SANSO CORPORATION: PRODUCT PORTFOLIO
LIST OF FIGURES
- FIGURE 01. HELIUM MARKET, 2022-2032
- FIGURE 02. SEGMENTATION OF HELIUM MARKET, 2022-2032
- FIGURE 03. TOP INVESTMENT POCKETS IN HELIUM MARKET (2023-2032)
- FIGURE 04. HIGH BARGAINING POWER OF SUPPLIERS
- FIGURE 05. HIGH THREAT OF NEW ENTRANTS
- FIGURE 06. MODERATE THREAT OF SUBSTITUTES
- FIGURE 07. MODERATE INTENSITY OF RIVALRY
- FIGURE 08. MODERATE BARGAINING POWER OF BUYERS
- FIGURE 09. DRIVERS, RESTRAINTS AND OPPORTUNITIES: GLOBALHELIUM MARKET
- FIGURE 10. PRICING ANALYSIS: HELIUM MARKET 2022 AND 2032
- FIGURE 11. IMPACT OF KEY REGULATION: HELIUM MARKET
- FIGURE 11. HELIUM MARKET, BY PHASE TYPE, 2022(%)
- FIGURE 12. COMPARATIVE SHARE ANALYSIS OF HELIUM MARKET FOR LIQUID, BY COUNTRY 2022 AND 2032(%)
- FIGURE 13. COMPARATIVE SHARE ANALYSIS OF HELIUM MARKET FOR GASEOUS, BY COUNTRY 2022 AND 2032(%)
- FIGURE 14. HELIUM MARKET, BY APPLICATION, 2022(%)
- FIGURE 15. COMPARATIVE SHARE ANALYSIS OF HELIUM MARKET FOR CRYOGENICS, BY COUNTRY 2022 AND 2032(%)
- FIGURE 16. COMPARATIVE SHARE ANALYSIS OF HELIUM MARKET FOR PRESSURIZING AND PURGING, BY COUNTRY 2022 AND 2032(%)
- FIGURE 17. COMPARATIVE SHARE ANALYSIS OF HELIUM MARKET FOR WELDING, BY COUNTRY 2022 AND 2032(%)
- FIGURE 18. COMPARATIVE SHARE ANALYSIS OF HELIUM MARKET FOR CONTROLLED ATMOSPHERE, BY COUNTRY 2022 AND 2032(%)
- FIGURE 19. COMPARATIVE SHARE ANALYSIS OF HELIUM MARKET FOR LEAK DETECTION, BY COUNTRY 2022 AND 2032(%)
- FIGURE 20. COMPARATIVE SHARE ANALYSIS OF HELIUM MARKET FOR BREATHING MIXTURE, BY COUNTRY 2022 AND 2032(%)
- FIGURE 21. COMPARATIVE SHARE ANALYSIS OF HELIUM MARKET FOR OTHERS, BY COUNTRY 2022 AND 2032(%)
- FIGURE 22. HELIUM MARKET, BY END-USE INDUSTRY, 2022(%)
- FIGURE 23. COMPARATIVE SHARE ANALYSIS OF HELIUM MARKET FOR AEROSPACE AND DEFENSE, BY COUNTRY 2022 AND 2032(%)
- FIGURE 24. COMPARATIVE SHARE ANALYSIS OF HELIUM MARKET FOR MEDICAL AND HEALTHCARE, BY COUNTRY 2022 AND 2032(%)
- FIGURE 25. COMPARATIVE SHARE ANALYSIS OF HELIUM MARKET FOR ELECTRICALS AND ELECTRONICS, BY COUNTRY 2022 AND 2032(%)
- FIGURE 26. COMPARATIVE SHARE ANALYSIS OF HELIUM MARKET FOR OTHERS, BY COUNTRY 2022 AND 2032(%)
- FIGURE 27. HELIUM MARKET BY REGION, 2022
- FIGURE 28. U.S. HELIUM MARKET, 2022-2032 ($MILLION)
- FIGURE 29. CANADA HELIUM MARKET, 2022-2032 ($MILLION)
- FIGURE 30. MEXICO HELIUM MARKET, 2022-2032 ($MILLION)
- FIGURE 31. GERMANY HELIUM MARKET, 2022-2032 ($MILLION)
- FIGURE 32. FRANCE HELIUM MARKET, 2022-2032 ($MILLION)
- FIGURE 33. ITALY HELIUM MARKET, 2022-2032 ($MILLION)
- FIGURE 34. SPAIN HELIUM MARKET, 2022-2032 ($MILLION)
- FIGURE 35. UK HELIUM MARKET, 2022-2032 ($MILLION)
- FIGURE 36. REST OF EUROPE HELIUM MARKET, 2022-2032 ($MILLION)
- FIGURE 37. CHINA HELIUM MARKET, 2022-2032 ($MILLION)
- FIGURE 38. JAPAN HELIUM MARKET, 2022-2032 ($MILLION)
- FIGURE 39. INDIA HELIUM MARKET, 2022-2032 ($MILLION)
- FIGURE 40. SOUTH KOREA HELIUM MARKET, 2022-2032 ($MILLION)
- FIGURE 41. REST OF ASIA-PACIFIC HELIUM MARKET, 2022-2032 ($MILLION)
- FIGURE 42. BRAZIL HELIUM MARKET, 2022-2032 ($MILLION)
- FIGURE 43. SAUDI ARABIA HELIUM MARKET, 2022-2032 ($MILLION)
- FIGURE 44. SOUTH AFRICA HELIUM MARKET, 2022-2032 ($MILLION)
- FIGURE 45. REST OF LAMEA HELIUM MARKET, 2022-2032 ($MILLION)
- FIGURE 46. TOP WINNING STRATEGIES, BY YEAR
- FIGURE 47. TOP WINNING STRATEGIES, BY DEVELOPMENT
- FIGURE 48. TOP WINNING STRATEGIES, BY COMPANY
- FIGURE 49. PRODUCT MAPPING OF TOP 10 PLAYERS
- FIGURE 50. COMPETITIVE DASHBOARD
- FIGURE 51. COMPETITIVE HEATMAP: HELIUM MARKET
- FIGURE 52. TOP PLAYER POSITIONING, 2022
- FIGURE 53. AIR PRODUCTS & CHEMICALS INC.: NET SALES, 2020-2022 ($MILLION)
- FIGURE 54. AIR PRODUCTS & CHEMICALS INC.: REVENUE SHARE BY REGION, 2022 (%)
- FIGURE 55. AIR PRODUCTS & CHEMICALS INC.: REVENUE SHARE BY SEGMENT, 2022 (%)
- FIGURE 56. LINDE PLC: NET SALES, 2020-2022 ($MILLION)
- FIGURE 57. LINDE PLC: RESEARCH & DEVELOPMENT EXPENDITURE, 2020-2022 ($MILLION)
- FIGURE 58. LINDE PLC: REVENUE SHARE BY SEGMENT, 2022 (%)
- FIGURE 59. LINDE PLC: REVENUE SHARE BY REGION, 2022 (%)
- FIGURE 60. AIR LIQUIDE: NET REVENUE, 2020-2022 ($MILLION)
- FIGURE 61. AIR LIQUIDE: REVENUE SHARE BY SEGMENT, 2022 (%)
- FIGURE 62. AIR LIQUIDE: REVENUE SHARE BY REGION, 2022 (%)
- FIGURE 63. GAZPROM PJSC: SALES REVENUE, 2020-2021 ($MILLION)
- FIGURE 64. EXXONMOBIL CORPORATION: NET REVENUE, 2019-2021 ($MILLION)
- FIGURE 65. EXXONMOBIL CORPORATION: REVENUE SHARE BY SEGMENT, 2021 (%)
- FIGURE 66. EXXONMOBIL CORPORATION: REVENUE SHARE BY REGION, 2021 (%)

