
PUBLISHER: Allied Market Research | PRODUCT CODE: 1344349

PUBLISHER: Allied Market Research | PRODUCT CODE: 1344349
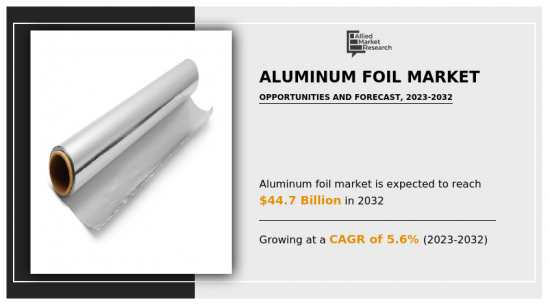
Aluminum Foil Market By Product Type, By Application, By End-use Industry : Global Opportunity Analysis and Industry Forecast, 2023-2032
According to a new report published by Allied Market Research, titled, "Aluminum Foil Market," The aluminum foil market was valued at $26.3 billion in 2022, and is estimated to reach $44.7 billion by 2032, growing at a CAGR of 5.6% from 2023 to 2032.
Aluminum foil wrappers are thin sheets of aluminum foil that are used for packaging and wrapping various items. These wrappers are versatile and offer several benefits for packaging and preserving products. Aluminum foil wrappers are widely used for packaging food items. They help protect food from moisture, light, oxygen, and other contaminants, keeping it fresh and extending its shelf life. Aluminum foil wrappers are commonly used for wrapping chocolate bars, candies, chewing gum, and other confectionery products. They provide a barrier that helps maintain the flavor, aroma, and texture of the food. Aluminum foil wrappers are extensively used in the pharmaceutical industry for packaging medicines, tablets, and capsules. These wrappers provide a protective barrier against moisture, light, and oxygen, helping to maintain the potency and stability of pharmaceutical products. They also offer tamper-evident features to ensure the integrity and safety of the medications. Aluminum foil wrappers are commonly used in the tobacco industry for packaging cigarettes and other tobacco products. The foil wrapper helps to protect the tobacco from drying out, preserve the freshness, and maintain the flavor of the tobacco.
The rise in demand for convenient and ready-to-eat food products drives the growth of the aluminum foil wrappers market. Aluminum foil wrappers provide an effective packaging solution for a wide range of convenience foods, such as snacks, ready meals, and confectionery items. The convenience and portability offered by aluminum foil wrappers align with the busy lifestyles of consumers, contributing to their growing popularity. The growth of e-commerce platforms and online food delivery services has created a significant demand for aluminum foil wrappers. These platforms rely on efficient and durable packaging materials to ensure the safe and hygienic delivery of food products. Aluminum foil wrappers offer excellent barrier properties, protection against moisture and contaminants, and heat resistance, making them an ideal choice for food packaging in the e-commerce sector. Furthermore, food safety and freshness are paramount for consumers, and aluminum foil wrappers play a crucial role in preserving the quality and integrity of packaged food products. Aluminum foil offers a protective barrier that helps to extend the shelf life of food items by preventing exposure to air, moisture, and light. With a growing focus on food safety and quality, the demand for aluminum foil wrappers has increased.
The combination of factors such as the demand for convenience foods, the growth of e-commerce, emphasis on food safety, branding opportunities, sustainability awareness, and diverse applications has led to the expanding market for aluminum foil wrappers. As these trends continue, the market is expected to further grow in the coming years.
Wide range of applications of aluminum foil
Aluminum foil has a wide range of applications across various industries on an everyday basis. Aluminum foil is extensively used in the food packaging industry. It is commonly used for wrapping, covering, and sealing food items such as sandwiches, baked goods, snacks, chocolates, dairy products, and ready-to-eat meals. Aluminum foil helps to protect food from moisture, light, oxygen, and contaminants, keeping it fresh and extending its shelf life. Aluminum foil is often used in cooking and baking due to its excellent heat conductivity and flexibility. It is used for wrapping and covering food during grilling, roasting, or s teaming, helping to retain moisture and heat. It is commonly used for lining baking pans and trays to prevent sticking and ease cleanup. Aluminum foil is used for insulation purposes in various applications. It is used as a radiant barrier in buildings to reflect heat and reduce energy consumption. It is also used for insulation in HVAC systems, refrigeration units, and electrical wiring to prevent heat loss or gain and improve energy efficiency.
Furthermore, aluminum foil finds applications in various industrial sectors. It is used in the automotive industry for heat shielding, exhaust system components, and electrical connectors. In the construction industry, it is used for vapor barriers, roof insulation, and ductwork. Aluminum foil is also used in the electronics industry for thermal management and electromagnetic shielding. Moreover, aluminum foil is widely used in the pharmaceutical industry for packaging medicines and medical devices. It provides a barrier against moisture, light, oxygen, and contaminants, ensuring the integrity and stability of pharmaceutical products. It is used for blister packs, strip packs, sachets, and other forms of pharmaceutical packaging. In addition, aluminum foil has various uses in household and consumer products. It is used for wrapping leftovers, covering dishes, and storing food in the refrigerator or freezer. Aluminum foil is also used for wrapping sandwiches, making disposable food containers, and creating decorative crafts.
Aluminum foil is used in transportation and aerospace industries for various applications. It is used for insulation in vehicles, aircraft, and spacecraft to regulate temperature and reduce energy consumption. It is also used in aerospace applications for its lightweight properties and ability to withstand extreme conditions. Its versatility, lightweight nature, and excellent barrier properties make it a popular choice in many industries and everyday use scenarios.
Key Benefits For Stakeholders
- This report provides a quantitative analysis of the market segments, current trends, estimations, and dynamics of the aluminum foil market analysis from 2022 to 2032 to identify the prevailing aluminum foil market opportunities.
- The market research is offered along with information related to key drivers, restraints, and opportunities.
- Porter's five forces analysis highlights the potency of buyers and suppliers to enable stakeholders make profit-oriented business decisions and strengthen their supplier-buyer network.
- In-depth analysis of the aluminum foil market segmentation assists to determine the prevailing market opportunities.
- Major countries in each region are mapped according to their revenue contribution to the global market.
- Market player positioning facilitates benchmarking and provides a clear understanding of the present position of the market players.
- The report includes the analysis of the regional as well as global aluminum foil market trends, key players, market segments, application areas, and market growth strategies.
Key Market Segments
By Product Type
- Foil Wrappers
- Pouches
- Blister Packs
- Others
By Application
- Packaging
- Industrial
By End-use Industry
- Pharmaceuticals
- Food and Beverages
- Consumer Goods
- Others
By Region
- North America
- U.S.
- Canada
- Mexico
- Europe
- Germany
- France
- UK
- Spain
- Italy
- Rest of Europe
- Asia-Pacific
- China
- India
- Japan
- South Korea
- Rest of Asia-Pacific
- LAMEA
- Brazil
- Saudi Arabia
- South Africa
- Rest of LAMEA
Key Market Players:
- Amcor PLC
- Assan Aluminum Industry and Trade Inc.
- Eurofoil
- Henan Huawei Aluminium Co., Ltd
- Hindalco Industries Ltd.
- lskb Aluminium Foils
- Reynolds Consumer Products
- RusAL
- TOYO ALUMINIUM K.K.
- UACJ Corporation
TABLE OF CONTENTS
CHAPTER 1: INTRODUCTION
- 1.1. Report description
- 1.2. Key market segments
- 1.3. Key benefits to the stakeholders
- 1.4. Research Methodology
- 1.4.1. Primary research
- 1.4.2. Secondary research
- 1.4.3. Analyst tools and models
CHAPTER 2: EXECUTIVE SUMMARY
- 2.1. CXO Perspective
CHAPTER 3: MARKET OVERVIEW
- 3.1. Market definition and scope
- 3.2. Key findings
- 3.2.1. Top impacting factors
- 3.2.2. Top investment pockets
- 3.3. Porter's five forces analysis
- 3.3.1. Low bargaining power of suppliers
- 3.3.2. Low threat of new entrants
- 3.3.3. Low threat of substitutes
- 3.3.4. Low intensity of rivalry
- 3.3.5. Low bargaining power of buyers
- 3.4. Market dynamics
- 3.4.1. Drivers
- 3.4.1.1. Rise in the demand for recyclable products
- 3.4.1.2. Wide range of applications of aluminum foil
- 3.4.1. Drivers
- 3.4.2. Restraints
- 3.4.2.1. Lack of awareness of proper recycling processes of aluminum foil products
- 3.4.3. Opportunities
- 3.4.3.1. Increase in use of sustainable construction resources
- 3.5. COVID-19 Impact Analysis on the market
- 3.6. Pricing Analysis
- 3.7. Value Chain Analysis
- 3.8. Regulatory Guidelines
- 3.9. Patent Landscape
CHAPTER 4: ALUMINUM FOIL MARKET, BY PRODUCT TYPE
- 4.1. Overview
- 4.1.1. Market size and forecast
- 4.2. Foil Wrappers
- 4.2.1. Key market trends, growth factors and opportunities
- 4.2.2. Market size and forecast, by region
- 4.2.3. Market share analysis by country
- 4.3. Pouches
- 4.3.1. Key market trends, growth factors and opportunities
- 4.3.2. Market size and forecast, by region
- 4.3.3. Market share analysis by country
- 4.4. Blister Packs
- 4.4.1. Key market trends, growth factors and opportunities
- 4.4.2. Market size and forecast, by region
- 4.4.3. Market share analysis by country
- 4.5. Others
- 4.5.1. Key market trends, growth factors and opportunities
- 4.5.2. Market size and forecast, by region
- 4.5.3. Market share analysis by country
CHAPTER 5: ALUMINUM FOIL MARKET, BY APPLICATION
- 5.1. Overview
- 5.1.1. Market size and forecast
- 5.2. Packaging
- 5.2.1. Key market trends, growth factors and opportunities
- 5.2.2. Market size and forecast, by region
- 5.2.3. Market share analysis by country
- 5.3. Industrial
- 5.3.1. Key market trends, growth factors and opportunities
- 5.3.2. Market size and forecast, by region
- 5.3.3. Market share analysis by country
CHAPTER 6: ALUMINUM FOIL MARKET, BY END-USE INDUSTRY
- 6.1. Overview
- 6.1.1. Market size and forecast
- 6.2. Pharmaceuticals
- 6.2.1. Key market trends, growth factors and opportunities
- 6.2.2. Market size and forecast, by region
- 6.2.3. Market share analysis by country
- 6.3. Food and Beverages
- 6.3.1. Key market trends, growth factors and opportunities
- 6.3.2. Market size and forecast, by region
- 6.3.3. Market share analysis by country
- 6.4. Consumer Goods
- 6.4.1. Key market trends, growth factors and opportunities
- 6.4.2. Market size and forecast, by region
- 6.4.3. Market share analysis by country
- 6.5. Others
- 6.5.1. Key market trends, growth factors and opportunities
- 6.5.2. Market size and forecast, by region
- 6.5.3. Market share analysis by country
CHAPTER 7: ALUMINUM FOIL MARKET, BY REGION
- 7.1. Overview
- 7.1.1. Market size and forecast By Region
- 7.2. North America
- 7.2.1. Key trends and opportunities
- 7.2.2. Market size and forecast, by Product Type
- 7.2.3. Market size and forecast, by Application
- 7.2.4. Market size and forecast, by End-use Industry
- 7.2.5. Market size and forecast, by country
- 7.2.5.1. U.S.
- 7.2.5.1.1. Key market trends, growth factors and opportunities
- 7.2.5.1.2. Market size and forecast, by Product Type
- 7.2.5.1.3. Market size and forecast, by Application
- 7.2.5.1.4. Market size and forecast, by End-use Industry
- 7.2.5.2. Canada
- 7.2.5.2.1. Key market trends, growth factors and opportunities
- 7.2.5.2.2. Market size and forecast, by Product Type
- 7.2.5.2.3. Market size and forecast, by Application
- 7.2.5.2.4. Market size and forecast, by End-use Industry
- 7.2.5.3. Mexico
- 7.2.5.3.1. Key market trends, growth factors and opportunities
- 7.2.5.3.2. Market size and forecast, by Product Type
- 7.2.5.3.3. Market size and forecast, by Application
- 7.2.5.3.4. Market size and forecast, by End-use Industry
- 7.3. Europe
- 7.3.1. Key trends and opportunities
- 7.3.2. Market size and forecast, by Product Type
- 7.3.3. Market size and forecast, by Application
- 7.3.4. Market size and forecast, by End-use Industry
- 7.3.5. Market size and forecast, by country
- 7.3.5.1. Germany
- 7.3.5.1.1. Key market trends, growth factors and opportunities
- 7.3.5.1.2. Market size and forecast, by Product Type
- 7.3.5.1.3. Market size and forecast, by Application
- 7.3.5.1.4. Market size and forecast, by End-use Industry
- 7.3.5.2. France
- 7.3.5.2.1. Key market trends, growth factors and opportunities
- 7.3.5.2.2. Market size and forecast, by Product Type
- 7.3.5.2.3. Market size and forecast, by Application
- 7.3.5.2.4. Market size and forecast, by End-use Industry
- 7.3.5.3. UK
- 7.3.5.3.1. Key market trends, growth factors and opportunities
- 7.3.5.3.2. Market size and forecast, by Product Type
- 7.3.5.3.3. Market size and forecast, by Application
- 7.3.5.3.4. Market size and forecast, by End-use Industry
- 7.3.5.4. Spain
- 7.3.5.4.1. Key market trends, growth factors and opportunities
- 7.3.5.4.2. Market size and forecast, by Product Type
- 7.3.5.4.3. Market size and forecast, by Application
- 7.3.5.4.4. Market size and forecast, by End-use Industry
- 7.3.5.5. Italy
- 7.3.5.5.1. Key market trends, growth factors and opportunities
- 7.3.5.5.2. Market size and forecast, by Product Type
- 7.3.5.5.3. Market size and forecast, by Application
- 7.3.5.5.4. Market size and forecast, by End-use Industry
- 7.3.5.6. Rest of Europe
- 7.3.5.6.1. Key market trends, growth factors and opportunities
- 7.3.5.6.2. Market size and forecast, by Product Type
- 7.3.5.6.3. Market size and forecast, by Application
- 7.3.5.6.4. Market size and forecast, by End-use Industry
- 7.4. Asia-Pacific
- 7.4.1. Key trends and opportunities
- 7.4.2. Market size and forecast, by Product Type
- 7.4.3. Market size and forecast, by Application
- 7.4.4. Market size and forecast, by End-use Industry
- 7.4.5. Market size and forecast, by country
- 7.4.5.1. China
- 7.4.5.1.1. Key market trends, growth factors and opportunities
- 7.4.5.1.2. Market size and forecast, by Product Type
- 7.4.5.1.3. Market size and forecast, by Application
- 7.4.5.1.4. Market size and forecast, by End-use Industry
- 7.4.5.2. India
- 7.4.5.2.1. Key market trends, growth factors and opportunities
- 7.4.5.2.2. Market size and forecast, by Product Type
- 7.4.5.2.3. Market size and forecast, by Application
- 7.4.5.2.4. Market size and forecast, by End-use Industry
- 7.4.5.3. Japan
- 7.4.5.3.1. Key market trends, growth factors and opportunities
- 7.4.5.3.2. Market size and forecast, by Product Type
- 7.4.5.3.3. Market size and forecast, by Application
- 7.4.5.3.4. Market size and forecast, by End-use Industry
- 7.4.5.4. South Korea
- 7.4.5.4.1. Key market trends, growth factors and opportunities
- 7.4.5.4.2. Market size and forecast, by Product Type
- 7.4.5.4.3. Market size and forecast, by Application
- 7.4.5.4.4. Market size and forecast, by End-use Industry
- 7.4.5.5. Rest of Asia-Pacific
- 7.4.5.5.1. Key market trends, growth factors and opportunities
- 7.4.5.5.2. Market size and forecast, by Product Type
- 7.4.5.5.3. Market size and forecast, by Application
- 7.4.5.5.4. Market size and forecast, by End-use Industry
- 7.5. LAMEA
- 7.5.1. Key trends and opportunities
- 7.5.2. Market size and forecast, by Product Type
- 7.5.3. Market size and forecast, by Application
- 7.5.4. Market size and forecast, by End-use Industry
- 7.5.5. Market size and forecast, by country
- 7.5.5.1. Brazil
- 7.5.5.1.1. Key market trends, growth factors and opportunities
- 7.5.5.1.2. Market size and forecast, by Product Type
- 7.5.5.1.3. Market size and forecast, by Application
- 7.5.5.1.4. Market size and forecast, by End-use Industry
- 7.5.5.2. Saudi Arabia
- 7.5.5.2.1. Key market trends, growth factors and opportunities
- 7.5.5.2.2. Market size and forecast, by Product Type
- 7.5.5.2.3. Market size and forecast, by Application
- 7.5.5.2.4. Market size and forecast, by End-use Industry
- 7.5.5.3. South Africa
- 7.5.5.3.1. Key market trends, growth factors and opportunities
- 7.5.5.3.2. Market size and forecast, by Product Type
- 7.5.5.3.3. Market size and forecast, by Application
- 7.5.5.3.4. Market size and forecast, by End-use Industry
- 7.5.5.4. Rest of LAMEA
- 7.5.5.4.1. Key market trends, growth factors and opportunities
- 7.5.5.4.2. Market size and forecast, by Product Type
- 7.5.5.4.3. Market size and forecast, by Application
- 7.5.5.4.4. Market size and forecast, by End-use Industry
CHAPTER 8: COMPETITIVE LANDSCAPE
- 8.1. Introduction
- 8.2. Top winning strategies
- 8.3. Product Mapping of Top 10 Player
- 8.4. Competitive Dashboard
- 8.5. Competitive Heatmap
- 8.6. Top player positioning, 2022
CHAPTER 9: COMPANY PROFILES
- 9.1. Amcor PLC
- 9.1.1. Company overview
- 9.1.2. Key Executives
- 9.1.3. Company snapshot
- 9.1.4. Operating business segments
- 9.1.5. Product portfolio
- 9.1.6. Business performance
- 9.2. Reynolds Consumer Products
- 9.2.1. Company overview
- 9.2.2. Key Executives
- 9.2.3. Company snapshot
- 9.2.4. Operating business segments
- 9.2.5. Product portfolio
- 9.2.6. Business performance
- 9.3. Hindalco Industries Ltd.
- 9.3.1. Company overview
- 9.3.2. Key Executives
- 9.3.3. Company snapshot
- 9.3.4. Operating business segments
- 9.3.5. Product portfolio
- 9.3.6. Business performance
- 9.3.7. Key strategic moves and developments
- 9.4. UACJ Corporation
- 9.4.1. Company overview
- 9.4.2. Key Executives
- 9.4.3. Company snapshot
- 9.4.4. Operating business segments
- 9.4.5. Product portfolio
- 9.4.6. Business performance
- 9.5. RusAL
- 9.5.1. Company overview
- 9.5.2. Key Executives
- 9.5.3. Company snapshot
- 9.5.4. Operating business segments
- 9.5.5. Product portfolio
- 9.5.6. Business performance
- 9.6. TOYO ALUMINIUM K.K.
- 9.6.1. Company overview
- 9.6.2. Key Executives
- 9.6.3. Company snapshot
- 9.6.4. Operating business segments
- 9.6.5. Product portfolio
- 9.6.6. Business performance
- 9.7. lskb Aluminium Foils
- 9.7.1. Company overview
- 9.7.2. Key Executives
- 9.7.3. Company snapshot
- 9.7.4. Operating business segments
- 9.7.5. Product portfolio
- 9.8. Assan Aluminum Industry and Trade Inc.
- 9.8.1. Company overview
- 9.8.2. Key Executives
- 9.8.3. Company snapshot
- 9.8.4. Operating business segments
- 9.8.5. Product portfolio
- 9.9. Eurofoil
- 9.9.1. Company overview
- 9.9.2. Key Executives
- 9.9.3. Company snapshot
- 9.9.4. Operating business segments
- 9.9.5. Product portfolio
- 9.10. Henan Huawei Aluminium Co., Ltd
- 9.10.1. Company overview
- 9.10.2. Key Executives
- 9.10.3. Company snapshot
- 9.10.4. Operating business segments
- 9.10.5. Product portfolio
LIST OF TABLES
- TABLE 01. GLOBAL ALUMINUM FOIL MARKET, BY PRODUCT TYPE, 2022-2032 ($MILLION)
- TABLE 02. GLOBAL ALUMINUM FOIL MARKET, BY PRODUCT TYPE, 2022-2032 (KILOTON)
- TABLE 03. ALUMINUM FOIL MARKET FOR FOIL WRAPPERS, BY REGION, 2022-2032 ($MILLION)
- TABLE 04. ALUMINUM FOIL MARKET FOR FOIL WRAPPERS, BY REGION, 2022-2032 (KILOTON)
- TABLE 05. ALUMINUM FOIL MARKET FOR POUCHES, BY REGION, 2022-2032 ($MILLION)
- TABLE 06. ALUMINUM FOIL MARKET FOR POUCHES, BY REGION, 2022-2032 (KILOTON)
- TABLE 07. ALUMINUM FOIL MARKET FOR BLISTER PACKS, BY REGION, 2022-2032 ($MILLION)
- TABLE 08. ALUMINUM FOIL MARKET FOR BLISTER PACKS, BY REGION, 2022-2032 (KILOTON)
- TABLE 09. ALUMINUM FOIL MARKET FOR OTHERS, BY REGION, 2022-2032 ($MILLION)
- TABLE 10. ALUMINUM FOIL MARKET FOR OTHERS, BY REGION, 2022-2032 (KILOTON)
- TABLE 11. GLOBAL ALUMINUM FOIL MARKET, BY APPLICATION, 2022-2032 ($MILLION)
- TABLE 12. GLOBAL ALUMINUM FOIL MARKET, BY APPLICATION, 2022-2032 (KILOTON)
- TABLE 13. ALUMINUM FOIL MARKET FOR PACKAGING, BY REGION, 2022-2032 ($MILLION)
- TABLE 14. ALUMINUM FOIL MARKET FOR PACKAGING, BY REGION, 2022-2032 (KILOTON)
- TABLE 15. ALUMINUM FOIL MARKET FOR INDUSTRIAL, BY REGION, 2022-2032 ($MILLION)
- TABLE 16. ALUMINUM FOIL MARKET FOR INDUSTRIAL, BY REGION, 2022-2032 (KILOTON)
- TABLE 17. GLOBAL ALUMINUM FOIL MARKET, BY END-USE INDUSTRY, 2022-2032 ($MILLION)
- TABLE 18. GLOBAL ALUMINUM FOIL MARKET, BY END-USE INDUSTRY, 2022-2032 (KILOTON)
- TABLE 19. ALUMINUM FOIL MARKET FOR PHARMACEUTICALS, BY REGION, 2022-2032 ($MILLION)
- TABLE 20. ALUMINUM FOIL MARKET FOR PHARMACEUTICALS, BY REGION, 2022-2032 (KILOTON)
- TABLE 21. ALUMINUM FOIL MARKET FOR FOOD AND BEVERAGES, BY REGION, 2022-2032 ($MILLION)
- TABLE 22. ALUMINUM FOIL MARKET FOR FOOD AND BEVERAGES, BY REGION, 2022-2032 (KILOTON)
- TABLE 23. ALUMINUM FOIL MARKET FOR CONSUMER GOODS, BY REGION, 2022-2032 ($MILLION)
- TABLE 24. ALUMINUM FOIL MARKET FOR CONSUMER GOODS, BY REGION, 2022-2032 (KILOTON)
- TABLE 25. ALUMINUM FOIL MARKET FOR OTHERS, BY REGION, 2022-2032 ($MILLION)
- TABLE 26. ALUMINUM FOIL MARKET FOR OTHERS, BY REGION, 2022-2032 (KILOTON)
- TABLE 27. ALUMINUM FOIL MARKET, BY REGION, 2022-2032 ($MILLION)
- TABLE 28. ALUMINUM FOIL MARKET, BY REGION, 2022-2032 (KILOTON)
- TABLE 29. NORTH AMERICA ALUMINUM FOIL MARKET, BY PRODUCT TYPE, 2022-2032 ($MILLION)
- TABLE 30. NORTH AMERICA ALUMINUM FOIL MARKET, BY PRODUCT TYPE, 2022-2032 (KILOTON)
- TABLE 31. NORTH AMERICA ALUMINUM FOIL MARKET, BY APPLICATION, 2022-2032 ($MILLION)
- TABLE 32. NORTH AMERICA ALUMINUM FOIL MARKET, BY APPLICATION, 2022-2032 (KILOTON)
- TABLE 33. NORTH AMERICA ALUMINUM FOIL MARKET, BY END-USE INDUSTRY, 2022-2032 ($MILLION)
- TABLE 34. NORTH AMERICA ALUMINUM FOIL MARKET, BY END-USE INDUSTRY, 2022-2032 (KILOTON)
- TABLE 35. NORTH AMERICA ALUMINUM FOIL MARKET, BY COUNTRY, 2022-2032 ($MILLION)
- TABLE 36. NORTH AMERICA ALUMINUM FOIL MARKET, BY COUNTRY, 2022-2032 (KILOTON)
- TABLE 37. U.S. ALUMINUM FOIL MARKET, BY PRODUCT TYPE, 2022-2032 ($MILLION)
- TABLE 38. U.S. ALUMINUM FOIL MARKET, BY PRODUCT TYPE, 2022-2032 (KILOTON)
- TABLE 39. U.S. ALUMINUM FOIL MARKET, BY APPLICATION, 2022-2032 ($MILLION)
- TABLE 40. U.S. ALUMINUM FOIL MARKET, BY APPLICATION, 2022-2032 (KILOTON)
- TABLE 41. U.S. ALUMINUM FOIL MARKET, BY END-USE INDUSTRY, 2022-2032 ($MILLION)
- TABLE 42. U.S. ALUMINUM FOIL MARKET, BY END-USE INDUSTRY, 2022-2032 (KILOTON)
- TABLE 43. CANADA ALUMINUM FOIL MARKET, BY PRODUCT TYPE, 2022-2032 ($MILLION)
- TABLE 44. CANADA ALUMINUM FOIL MARKET, BY PRODUCT TYPE, 2022-2032 (KILOTON)
- TABLE 45. CANADA ALUMINUM FOIL MARKET, BY APPLICATION, 2022-2032 ($MILLION)
- TABLE 46. CANADA ALUMINUM FOIL MARKET, BY APPLICATION, 2022-2032 (KILOTON)
- TABLE 47. CANADA ALUMINUM FOIL MARKET, BY END-USE INDUSTRY, 2022-2032 ($MILLION)
- TABLE 48. CANADA ALUMINUM FOIL MARKET, BY END-USE INDUSTRY, 2022-2032 (KILOTON)
- TABLE 49. MEXICO ALUMINUM FOIL MARKET, BY PRODUCT TYPE, 2022-2032 ($MILLION)
- TABLE 50. MEXICO ALUMINUM FOIL MARKET, BY PRODUCT TYPE, 2022-2032 (KILOTON)
- TABLE 51. MEXICO ALUMINUM FOIL MARKET, BY APPLICATION, 2022-2032 ($MILLION)
- TABLE 52. MEXICO ALUMINUM FOIL MARKET, BY APPLICATION, 2022-2032 (KILOTON)
- TABLE 53. MEXICO ALUMINUM FOIL MARKET, BY END-USE INDUSTRY, 2022-2032 ($MILLION)
- TABLE 54. MEXICO ALUMINUM FOIL MARKET, BY END-USE INDUSTRY, 2022-2032 (KILOTON)
- TABLE 55. EUROPE ALUMINUM FOIL MARKET, BY PRODUCT TYPE, 2022-2032 ($MILLION)
- TABLE 56. EUROPE ALUMINUM FOIL MARKET, BY PRODUCT TYPE, 2022-2032 (KILOTON)
- TABLE 57. EUROPE ALUMINUM FOIL MARKET, BY APPLICATION, 2022-2032 ($MILLION)
- TABLE 58. EUROPE ALUMINUM FOIL MARKET, BY APPLICATION, 2022-2032 (KILOTON)
- TABLE 59. EUROPE ALUMINUM FOIL MARKET, BY END-USE INDUSTRY, 2022-2032 ($MILLION)
- TABLE 60. EUROPE ALUMINUM FOIL MARKET, BY END-USE INDUSTRY, 2022-2032 (KILOTON)
- TABLE 61. EUROPE ALUMINUM FOIL MARKET, BY COUNTRY, 2022-2032 ($MILLION)
- TABLE 62. EUROPE ALUMINUM FOIL MARKET, BY COUNTRY, 2022-2032 (KILOTON)
- TABLE 63. GERMANY ALUMINUM FOIL MARKET, BY PRODUCT TYPE, 2022-2032 ($MILLION)
- TABLE 64. GERMANY ALUMINUM FOIL MARKET, BY PRODUCT TYPE, 2022-2032 (KILOTON)
- TABLE 65. GERMANY ALUMINUM FOIL MARKET, BY APPLICATION, 2022-2032 ($MILLION)
- TABLE 66. GERMANY ALUMINUM FOIL MARKET, BY APPLICATION, 2022-2032 (KILOTON)
- TABLE 67. GERMANY ALUMINUM FOIL MARKET, BY END-USE INDUSTRY, 2022-2032 ($MILLION)
- TABLE 68. GERMANY ALUMINUM FOIL MARKET, BY END-USE INDUSTRY, 2022-2032 (KILOTON)
- TABLE 69. FRANCE ALUMINUM FOIL MARKET, BY PRODUCT TYPE, 2022-2032 ($MILLION)
- TABLE 70. FRANCE ALUMINUM FOIL MARKET, BY PRODUCT TYPE, 2022-2032 (KILOTON)
- TABLE 71. FRANCE ALUMINUM FOIL MARKET, BY APPLICATION, 2022-2032 ($MILLION)
- TABLE 72. FRANCE ALUMINUM FOIL MARKET, BY APPLICATION, 2022-2032 (KILOTON)
- TABLE 73. FRANCE ALUMINUM FOIL MARKET, BY END-USE INDUSTRY, 2022-2032 ($MILLION)
- TABLE 74. FRANCE ALUMINUM FOIL MARKET, BY END-USE INDUSTRY, 2022-2032 (KILOTON)
- TABLE 75. UK ALUMINUM FOIL MARKET, BY PRODUCT TYPE, 2022-2032 ($MILLION)
- TABLE 76. UK ALUMINUM FOIL MARKET, BY PRODUCT TYPE, 2022-2032 (KILOTON)
- TABLE 77. UK ALUMINUM FOIL MARKET, BY APPLICATION, 2022-2032 ($MILLION)
- TABLE 78. UK ALUMINUM FOIL MARKET, BY APPLICATION, 2022-2032 (KILOTON)
- TABLE 79. UK ALUMINUM FOIL MARKET, BY END-USE INDUSTRY, 2022-2032 ($MILLION)
- TABLE 80. UK ALUMINUM FOIL MARKET, BY END-USE INDUSTRY, 2022-2032 (KILOTON)
- TABLE 81. SPAIN ALUMINUM FOIL MARKET, BY PRODUCT TYPE, 2022-2032 ($MILLION)
- TABLE 82. SPAIN ALUMINUM FOIL MARKET, BY PRODUCT TYPE, 2022-2032 (KILOTON)
- TABLE 83. SPAIN ALUMINUM FOIL MARKET, BY APPLICATION, 2022-2032 ($MILLION)
- TABLE 84. SPAIN ALUMINUM FOIL MARKET, BY APPLICATION, 2022-2032 (KILOTON)
- TABLE 85. SPAIN ALUMINUM FOIL MARKET, BY END-USE INDUSTRY, 2022-2032 ($MILLION)
- TABLE 86. SPAIN ALUMINUM FOIL MARKET, BY END-USE INDUSTRY, 2022-2032 (KILOTON)
- TABLE 87. ITALY ALUMINUM FOIL MARKET, BY PRODUCT TYPE, 2022-2032 ($MILLION)
- TABLE 88. ITALY ALUMINUM FOIL MARKET, BY PRODUCT TYPE, 2022-2032 (KILOTON)
- TABLE 89. ITALY ALUMINUM FOIL MARKET, BY APPLICATION, 2022-2032 ($MILLION)
- TABLE 90. ITALY ALUMINUM FOIL MARKET, BY APPLICATION, 2022-2032 (KILOTON)
- TABLE 91. ITALY ALUMINUM FOIL MARKET, BY END-USE INDUSTRY, 2022-2032 ($MILLION)
- TABLE 92. ITALY ALUMINUM FOIL MARKET, BY END-USE INDUSTRY, 2022-2032 (KILOTON)
- TABLE 93. REST OF EUROPE ALUMINUM FOIL MARKET, BY PRODUCT TYPE, 2022-2032 ($MILLION)
- TABLE 94. REST OF EUROPE ALUMINUM FOIL MARKET, BY PRODUCT TYPE, 2022-2032 (KILOTON)
- TABLE 95. REST OF EUROPE ALUMINUM FOIL MARKET, BY APPLICATION, 2022-2032 ($MILLION)
- TABLE 96. REST OF EUROPE ALUMINUM FOIL MARKET, BY APPLICATION, 2022-2032 (KILOTON)
- TABLE 97. REST OF EUROPE ALUMINUM FOIL MARKET, BY END-USE INDUSTRY, 2022-2032 ($MILLION)
- TABLE 98. REST OF EUROPE ALUMINUM FOIL MARKET, BY END-USE INDUSTRY, 2022-2032 (KILOTON)
- TABLE 99. ASIA-PACIFIC ALUMINUM FOIL MARKET, BY PRODUCT TYPE, 2022-2032 ($MILLION)
- TABLE 100. ASIA-PACIFIC ALUMINUM FOIL MARKET, BY PRODUCT TYPE, 2022-2032 (KILOTON)
- TABLE 101. ASIA-PACIFIC ALUMINUM FOIL MARKET, BY APPLICATION, 2022-2032 ($MILLION)
- TABLE 102. ASIA-PACIFIC ALUMINUM FOIL MARKET, BY APPLICATION, 2022-2032 (KILOTON)
- TABLE 103. ASIA-PACIFIC ALUMINUM FOIL MARKET, BY END-USE INDUSTRY, 2022-2032 ($MILLION)
- TABLE 104. ASIA-PACIFIC ALUMINUM FOIL MARKET, BY END-USE INDUSTRY, 2022-2032 (KILOTON)
- TABLE 105. ASIA-PACIFIC ALUMINUM FOIL MARKET, BY COUNTRY, 2022-2032 ($MILLION)
- TABLE 106. ASIA-PACIFIC ALUMINUM FOIL MARKET, BY COUNTRY, 2022-2032 (KILOTON)
- TABLE 107. CHINA ALUMINUM FOIL MARKET, BY PRODUCT TYPE, 2022-2032 ($MILLION)
- TABLE 108. CHINA ALUMINUM FOIL MARKET, BY PRODUCT TYPE, 2022-2032 (KILOTON)
- TABLE 109. CHINA ALUMINUM FOIL MARKET, BY APPLICATION, 2022-2032 ($MILLION)
- TABLE 110. CHINA ALUMINUM FOIL MARKET, BY APPLICATION, 2022-2032 (KILOTON)
- TABLE 111. CHINA ALUMINUM FOIL MARKET, BY END-USE INDUSTRY, 2022-2032 ($MILLION)
- TABLE 112. CHINA ALUMINUM FOIL MARKET, BY END-USE INDUSTRY, 2022-2032 (KILOTON)
- TABLE 113. INDIA ALUMINUM FOIL MARKET, BY PRODUCT TYPE, 2022-2032 ($MILLION)
- TABLE 114. INDIA ALUMINUM FOIL MARKET, BY PRODUCT TYPE, 2022-2032 (KILOTON)
- TABLE 115. INDIA ALUMINUM FOIL MARKET, BY APPLICATION, 2022-2032 ($MILLION)
- TABLE 116. INDIA ALUMINUM FOIL MARKET, BY APPLICATION, 2022-2032 (KILOTON)
- TABLE 117. INDIA ALUMINUM FOIL MARKET, BY END-USE INDUSTRY, 2022-2032 ($MILLION)
- TABLE 118. INDIA ALUMINUM FOIL MARKET, BY END-USE INDUSTRY, 2022-2032 (KILOTON)
- TABLE 119. JAPAN ALUMINUM FOIL MARKET, BY PRODUCT TYPE, 2022-2032 ($MILLION)
- TABLE 120. JAPAN ALUMINUM FOIL MARKET, BY PRODUCT TYPE, 2022-2032 (KILOTON)
- TABLE 121. JAPAN ALUMINUM FOIL MARKET, BY APPLICATION, 2022-2032 ($MILLION)
- TABLE 122. JAPAN ALUMINUM FOIL MARKET, BY APPLICATION, 2022-2032 (KILOTON)
- TABLE 123. JAPAN ALUMINUM FOIL MARKET, BY END-USE INDUSTRY, 2022-2032 ($MILLION)
- TABLE 124. JAPAN ALUMINUM FOIL MARKET, BY END-USE INDUSTRY, 2022-2032 (KILOTON)
- TABLE 125. SOUTH KOREA ALUMINUM FOIL MARKET, BY PRODUCT TYPE, 2022-2032 ($MILLION)
- TABLE 126. SOUTH KOREA ALUMINUM FOIL MARKET, BY PRODUCT TYPE, 2022-2032 (KILOTON)
- TABLE 127. SOUTH KOREA ALUMINUM FOIL MARKET, BY APPLICATION, 2022-2032 ($MILLION)
- TABLE 128. SOUTH KOREA ALUMINUM FOIL MARKET, BY APPLICATION, 2022-2032 (KILOTON)
- TABLE 129. SOUTH KOREA ALUMINUM FOIL MARKET, BY END-USE INDUSTRY, 2022-2032 ($MILLION)
- TABLE 130. SOUTH KOREA ALUMINUM FOIL MARKET, BY END-USE INDUSTRY, 2022-2032 (KILOTON)
- TABLE 131. REST OF ASIA-PACIFIC ALUMINUM FOIL MARKET, BY PRODUCT TYPE, 2022-2032 ($MILLION)
- TABLE 132. REST OF ASIA-PACIFIC ALUMINUM FOIL MARKET, BY PRODUCT TYPE, 2022-2032 (KILOTON)
- TABLE 133. REST OF ASIA-PACIFIC ALUMINUM FOIL MARKET, BY APPLICATION, 2022-2032 ($MILLION)
- TABLE 134. REST OF ASIA-PACIFIC ALUMINUM FOIL MARKET, BY APPLICATION, 2022-2032 (KILOTON)
- TABLE 135. REST OF ASIA-PACIFIC ALUMINUM FOIL MARKET, BY END-USE INDUSTRY, 2022-2032 ($MILLION)
- TABLE 136. REST OF ASIA-PACIFIC ALUMINUM FOIL MARKET, BY END-USE INDUSTRY, 2022-2032 (KILOTON)
- TABLE 137. LAMEA ALUMINUM FOIL MARKET, BY PRODUCT TYPE, 2022-2032 ($MILLION)
- TABLE 138. LAMEA ALUMINUM FOIL MARKET, BY PRODUCT TYPE, 2022-2032 (KILOTON)
- TABLE 139. LAMEA ALUMINUM FOIL MARKET, BY APPLICATION, 2022-2032 ($MILLION)
- TABLE 140. LAMEA ALUMINUM FOIL MARKET, BY APPLICATION, 2022-2032 (KILOTON)
- TABLE 141. LAMEA ALUMINUM FOIL MARKET, BY END-USE INDUSTRY, 2022-2032 ($MILLION)
- TABLE 142. LAMEA ALUMINUM FOIL MARKET, BY END-USE INDUSTRY, 2022-2032 (KILOTON)
- TABLE 143. LAMEA ALUMINUM FOIL MARKET, BY COUNTRY, 2022-2032 ($MILLION)
- TABLE 144. LAMEA ALUMINUM FOIL MARKET, BY COUNTRY, 2022-2032 (KILOTON)
- TABLE 145. BRAZIL ALUMINUM FOIL MARKET, BY PRODUCT TYPE, 2022-2032 ($MILLION)
- TABLE 146. BRAZIL ALUMINUM FOIL MARKET, BY PRODUCT TYPE, 2022-2032 (KILOTON)
- TABLE 147. BRAZIL ALUMINUM FOIL MARKET, BY APPLICATION, 2022-2032 ($MILLION)
- TABLE 148. BRAZIL ALUMINUM FOIL MARKET, BY APPLICATION, 2022-2032 (KILOTON)
- TABLE 149. BRAZIL ALUMINUM FOIL MARKET, BY END-USE INDUSTRY, 2022-2032 ($MILLION)
- TABLE 150. BRAZIL ALUMINUM FOIL MARKET, BY END-USE INDUSTRY, 2022-2032 (KILOTON)
- TABLE 151. SAUDI ARABIA ALUMINUM FOIL MARKET, BY PRODUCT TYPE, 2022-2032 ($MILLION)
- TABLE 152. SAUDI ARABIA ALUMINUM FOIL MARKET, BY PRODUCT TYPE, 2022-2032 (KILOTON)
- TABLE 153. SAUDI ARABIA ALUMINUM FOIL MARKET, BY APPLICATION, 2022-2032 ($MILLION)
- TABLE 154. SAUDI ARABIA ALUMINUM FOIL MARKET, BY APPLICATION, 2022-2032 (KILOTON)
- TABLE 155. SAUDI ARABIA ALUMINUM FOIL MARKET, BY END-USE INDUSTRY, 2022-2032 ($MILLION)
- TABLE 156. SAUDI ARABIA ALUMINUM FOIL MARKET, BY END-USE INDUSTRY, 2022-2032 (KILOTON)
- TABLE 157. SOUTH AFRICA ALUMINUM FOIL MARKET, BY PRODUCT TYPE, 2022-2032 ($MILLION)
- TABLE 158. SOUTH AFRICA ALUMINUM FOIL MARKET, BY PRODUCT TYPE, 2022-2032 (KILOTON)
- TABLE 159. SOUTH AFRICA ALUMINUM FOIL MARKET, BY APPLICATION, 2022-2032 ($MILLION)
- TABLE 160. SOUTH AFRICA ALUMINUM FOIL MARKET, BY APPLICATION, 2022-2032 (KILOTON)
- TABLE 161. SOUTH AFRICA ALUMINUM FOIL MARKET, BY END-USE INDUSTRY, 2022-2032 ($MILLION)
- TABLE 162. SOUTH AFRICA ALUMINUM FOIL MARKET, BY END-USE INDUSTRY, 2022-2032 (KILOTON)
- TABLE 163. REST OF LAMEA ALUMINUM FOIL MARKET, BY PRODUCT TYPE, 2022-2032 ($MILLION)
- TABLE 164. REST OF LAMEA ALUMINUM FOIL MARKET, BY PRODUCT TYPE, 2022-2032 (KILOTON)
- TABLE 165. REST OF LAMEA ALUMINUM FOIL MARKET, BY APPLICATION, 2022-2032 ($MILLION)
- TABLE 166. REST OF LAMEA ALUMINUM FOIL MARKET, BY APPLICATION, 2022-2032 (KILOTON)
- TABLE 167. REST OF LAMEA ALUMINUM FOIL MARKET, BY END-USE INDUSTRY, 2022-2032 ($MILLION)
- TABLE 168. REST OF LAMEA ALUMINUM FOIL MARKET, BY END-USE INDUSTRY, 2022-2032 (KILOTON)
- TABLE 169. AMCOR PLC: KEY EXECUTIVES
- TABLE 170. AMCOR PLC: COMPANY SNAPSHOT
- TABLE 171. AMCOR PLC: PRODUCT SEGMENTS
- TABLE 172. AMCOR PLC: PRODUCT PORTFOLIO
- TABLE 173. REYNOLDS CONSUMER PRODUCTS: KEY EXECUTIVES
- TABLE 174. REYNOLDS CONSUMER PRODUCTS: COMPANY SNAPSHOT
- TABLE 175. REYNOLDS CONSUMER PRODUCTS: PRODUCT SEGMENTS
- TABLE 176. REYNOLDS CONSUMER PRODUCTS: PRODUCT PORTFOLIO
- TABLE 177. HINDALCO INDUSTRIES LTD.: KEY EXECUTIVES
- TABLE 178. HINDALCO INDUSTRIES LTD.: COMPANY SNAPSHOT
- TABLE 179. HINDALCO INDUSTRIES LTD.: PRODUCT SEGMENTS
- TABLE 180. HINDALCO INDUSTRIES LTD.: PRODUCT PORTFOLIO
- TABLE 181. HINDALCO INDUSTRIES LTD.: KEY STRATERGIES
- TABLE 182. UACJ CORPORATION: KEY EXECUTIVES
- TABLE 183. UACJ CORPORATION: COMPANY SNAPSHOT
- TABLE 184. UACJ CORPORATION: PRODUCT SEGMENTS
- TABLE 185. UACJ CORPORATION: PRODUCT PORTFOLIO
- TABLE 186. RUSAL: KEY EXECUTIVES
- TABLE 187. RUSAL: COMPANY SNAPSHOT
- TABLE 188. RUSAL: PRODUCT SEGMENTS
- TABLE 189. RUSAL: PRODUCT PORTFOLIO
- TABLE 190. TOYO ALUMINIUM K.K.: KEY EXECUTIVES
- TABLE 191. TOYO ALUMINIUM K.K.: COMPANY SNAPSHOT
- TABLE 192. TOYO ALUMINIUM K.K.: PRODUCT SEGMENTS
- TABLE 193. TOYO ALUMINIUM K.K.: PRODUCT PORTFOLIO
- TABLE 194. LSKB ALUMINIUM FOILS: KEY EXECUTIVES
- TABLE 195. LSKB ALUMINIUM FOILS: COMPANY SNAPSHOT
- TABLE 196. LSKB ALUMINIUM FOILS: PRODUCT SEGMENTS
- TABLE 197. LSKB ALUMINIUM FOILS: PRODUCT PORTFOLIO
- TABLE 198. ASSAN ALUMINUM INDUSTRY AND TRADE INC.: KEY EXECUTIVES
- TABLE 199. ASSAN ALUMINUM INDUSTRY AND TRADE INC.: COMPANY SNAPSHOT
- TABLE 200. ASSAN ALUMINUM INDUSTRY AND TRADE INC.: PRODUCT SEGMENTS
- TABLE 201. ASSAN ALUMINUM INDUSTRY AND TRADE INC.: PRODUCT PORTFOLIO
- TABLE 202. EUROFOIL: KEY EXECUTIVES
- TABLE 203. EUROFOIL: COMPANY SNAPSHOT
- TABLE 204. EUROFOIL: PRODUCT SEGMENTS
- TABLE 205. EUROFOIL: PRODUCT PORTFOLIO
- TABLE 206. HENAN HUAWEI ALUMINIUM CO., LTD: KEY EXECUTIVES
- TABLE 207. HENAN HUAWEI ALUMINIUM CO., LTD: COMPANY SNAPSHOT
- TABLE 208. HENAN HUAWEI ALUMINIUM CO., LTD: PRODUCT SEGMENTS
- TABLE 209. HENAN HUAWEI ALUMINIUM CO., LTD: PRODUCT PORTFOLIO
LIST OF FIGURES
- FIGURE 01. ALUMINUM FOIL MARKET, 2022-2032
- FIGURE 02. SEGMENTATION OF ALUMINUM FOIL MARKET, 2022-2032
- FIGURE 03. TOP INVESTMENT POCKETS IN ALUMINUM FOIL MARKET (2023-2032)
- FIGURE 04. LOW BARGAINING POWER OF SUPPLIERS
- FIGURE 05. LOW THREAT OF NEW ENTRANTS
- FIGURE 06. LOW THREAT OF SUBSTITUTES
- FIGURE 07. LOW INTENSITY OF RIVALRY
- FIGURE 08. LOW BARGAINING POWER OF BUYERS
- FIGURE 09. DRIVERS, RESTRAINTS AND OPPORTUNITIES: GLOBALALUMINUM FOIL MARKET
- FIGURE 10. PRICING ANALYSIS: ALUMINUM FOIL MARKET 2022 AND 2032
- FIGURE 11. REGULATORY GUIDELINES: ALUMINUM FOIL MARKET
- FIGURE 12. PATENT ANALYSIS BY COMPANY
- FIGURE 13. PATENT ANALYSIS BY COUNTRY
- FIGURE 13. ALUMINUM FOIL MARKET, BY PRODUCT TYPE, 2022(%)
- FIGURE 14. COMPARATIVE SHARE ANALYSIS OF ALUMINUM FOIL MARKET FOR FOIL WRAPPERS, BY COUNTRY 2022 AND 2032(%)
- FIGURE 15. COMPARATIVE SHARE ANALYSIS OF ALUMINUM FOIL MARKET FOR POUCHES, BY COUNTRY 2022 AND 2032(%)
- FIGURE 16. COMPARATIVE SHARE ANALYSIS OF ALUMINUM FOIL MARKET FOR BLISTER PACKS, BY COUNTRY 2022 AND 2032(%)
- FIGURE 17. COMPARATIVE SHARE ANALYSIS OF ALUMINUM FOIL MARKET FOR OTHERS, BY COUNTRY 2022 AND 2032(%)
- FIGURE 18. ALUMINUM FOIL MARKET, BY APPLICATION, 2022(%)
- FIGURE 19. COMPARATIVE SHARE ANALYSIS OF ALUMINUM FOIL MARKET FOR PACKAGING, BY COUNTRY 2022 AND 2032(%)
- FIGURE 20. COMPARATIVE SHARE ANALYSIS OF ALUMINUM FOIL MARKET FOR INDUSTRIAL, BY COUNTRY 2022 AND 2032(%)
- FIGURE 21. ALUMINUM FOIL MARKET, BY END-USE INDUSTRY, 2022(%)
- FIGURE 22. COMPARATIVE SHARE ANALYSIS OF ALUMINUM FOIL MARKET FOR PHARMACEUTICALS, BY COUNTRY 2022 AND 2032(%)
- FIGURE 23. COMPARATIVE SHARE ANALYSIS OF ALUMINUM FOIL MARKET FOR FOOD AND BEVERAGES, BY COUNTRY 2022 AND 2032(%)
- FIGURE 24. COMPARATIVE SHARE ANALYSIS OF ALUMINUM FOIL MARKET FOR CONSUMER GOODS, BY COUNTRY 2022 AND 2032(%)
- FIGURE 25. COMPARATIVE SHARE ANALYSIS OF ALUMINUM FOIL MARKET FOR OTHERS, BY COUNTRY 2022 AND 2032(%)
- FIGURE 26. ALUMINUM FOIL MARKET BY REGION, 2022
- FIGURE 27. U.S. ALUMINUM FOIL MARKET, 2022-2032 ($MILLION)
- FIGURE 28. CANADA ALUMINUM FOIL MARKET, 2022-2032 ($MILLION)
- FIGURE 29. MEXICO ALUMINUM FOIL MARKET, 2022-2032 ($MILLION)
- FIGURE 30. GERMANY ALUMINUM FOIL MARKET, 2022-2032 ($MILLION)
- FIGURE 31. FRANCE ALUMINUM FOIL MARKET, 2022-2032 ($MILLION)
- FIGURE 32. UK ALUMINUM FOIL MARKET, 2022-2032 ($MILLION)
- FIGURE 33. SPAIN ALUMINUM FOIL MARKET, 2022-2032 ($MILLION)
- FIGURE 34. ITALY ALUMINUM FOIL MARKET, 2022-2032 ($MILLION)
- FIGURE 35. REST OF EUROPE ALUMINUM FOIL MARKET, 2022-2032 ($MILLION)
- FIGURE 36. CHINA ALUMINUM FOIL MARKET, 2022-2032 ($MILLION)
- FIGURE 37. INDIA ALUMINUM FOIL MARKET, 2022-2032 ($MILLION)
- FIGURE 38. JAPAN ALUMINUM FOIL MARKET, 2022-2032 ($MILLION)
- FIGURE 39. SOUTH KOREA ALUMINUM FOIL MARKET, 2022-2032 ($MILLION)
- FIGURE 40. REST OF ASIA-PACIFIC ALUMINUM FOIL MARKET, 2022-2032 ($MILLION)
- FIGURE 41. BRAZIL ALUMINUM FOIL MARKET, 2022-2032 ($MILLION)
- FIGURE 42. SAUDI ARABIA ALUMINUM FOIL MARKET, 2022-2032 ($MILLION)
- FIGURE 43. SOUTH AFRICA ALUMINUM FOIL MARKET, 2022-2032 ($MILLION)
- FIGURE 44. REST OF LAMEA ALUMINUM FOIL MARKET, 2022-2032 ($MILLION)
- FIGURE 45. TOP WINNING STRATEGIES, BY YEAR
- FIGURE 46. TOP WINNING STRATEGIES, BY DEVELOPMENT
- FIGURE 47. TOP WINNING STRATEGIES, BY COMPANY
- FIGURE 48. PRODUCT MAPPING OF TOP 10 PLAYERS
- FIGURE 49. COMPETITIVE DASHBOARD
- FIGURE 50. COMPETITIVE HEATMAP: ALUMINUM FOIL MARKET
- FIGURE 51. TOP PLAYER POSITIONING, 2022
- FIGURE 52. AMCOR PLC: NET SALES, 2020-2022 ($MILLION)
- FIGURE 53. AMCOR PLC: REVENUE SHARE BY SEGMENT, 2022 (%)
- FIGURE 54. AMCOR PLC: REVENUE SHARE BY REGION, 2022 (%)
- FIGURE 55. REYNOLDS CONSUMER PRODUCTS: NET REVENUE, 2020-2022 ($MILLION)
- FIGURE 56. REYNOLDS CONSUMER PRODUCTS: RESEARCH & DEVELOPMENT EXPENDITURE, 2020-2022 ($MILLION)
- FIGURE 57. REYNOLDS CONSUMER PRODUCTS: REVENUE SHARE BY SEGMENT, 2022 (%)
- FIGURE 58. REYNOLDS CONSUMER PRODUCTS: REVENUE SHARE BY REGION, 2022 (%)
- FIGURE 59. HINDALCO INDUSTRIES LTD.: NET REVENUE, 2020-2022 ($MILLION)
- FIGURE 60. HINDALCO INDUSTRIES LTD.: REVENUE SHARE BY SEGMENT, 2022 (%)
- FIGURE 61. UACJ CORPORATION: NET SALES, 2020-2022 ($MILLION)
- FIGURE 62. UACJ CORPORATION: REVENUE SHARE BY SEGMENT, 2022 (%)
- FIGURE 63. RUSAL: NET REVENUE, 2020-2022 ($MILLION)
- FIGURE 64. RUSAL: REVENUE SHARE BY REGION, 2022 (%)
- FIGURE 65. RUSAL: REVENUE SHARE BY SEGMENT, 2022 (%)
- FIGURE 66. TOYO ALUMINIUM K.K.: NET SALES, 2019-2021 ($MILLION)

