
PUBLISHER: Allied Market Research | PRODUCT CODE: 1344367

PUBLISHER: Allied Market Research | PRODUCT CODE: 1344367
Thin Client Market By Form Factor (Standalone, With Monitor, Mobile), By Application (Enterprise, Government, Education, Industrial, Healthcare): Global Opportunity Analysis and Industry Forecast, 2023-2032
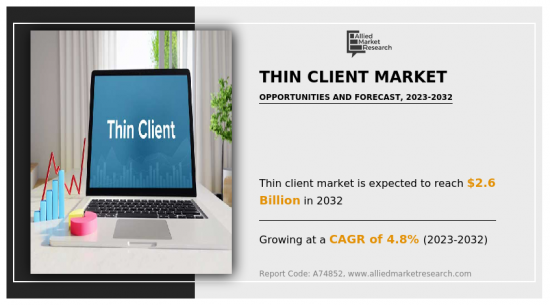
According to a new report published by Allied Market Research, titled, "Thin Client Market," The thin client market was valued at $1.6 billion in 2022, and is estimated to reach $2.6 billion by 2032, growing at a CAGR of 4.8% from 2023 to 2032.
Scalability and flexibility play vital roles in driving the adoption of thin clients within organizations. The ability of thin clients to scale easily allows businesses to add or remove devices based on their specific requirements. This scalability empowers organizations to swiftly adjust their IT infrastructure to accommodate changes in workforce size or work arrangements. For instance, when there is a sudden need to expand the remote workforce, thin clients can be quickly deployed, providing employees with secure access to virtual desktops and applications from any location. Similarly, thin clients can be easily reassigned or retired without the need for significant infrastructure modifications, if the workforce needs to be downsized. This inherent flexibility in device management enables organizations to adapt efficiently to evolving business needs, boosts workforce productivity, and optimizes resource allocation. Ultimately, organizations can maintain agility, respond promptly to changing demands, and create a seamless and productive work environment for their employees, by harnessing the scalability and flexibility of thin clients.
However, one key restraint of thin clients is their performance limitations, particularly when it comes to resource-intensive applications and graphics-intensive workloads. While thin clients can efficiently handle most tasks, they may struggle to provide the same level of performance as traditional desktops or workstations in scenarios that require substantial computing power. Tasks such as graphics rendering or video streaming can experience latency or reduced performance on thin clients due to their reliance on server-side processing and limited local hardware capabilities. This can be a challenge for organizations that heavily rely on applications or workflows that demand high-performance computing or advanced graphics capabilities. It is important for businesses considering thin clients to carefully assess their performance requirements and evaluate whether thin clients can adequately meet those needs.
Thin clients present a significant opportunity through centralized data storage and backup capabilities. By storing data on servers instead of individual devices, thin clients streamline data management and backup processes. The centralized approach ensures that data is automatically backed up, minimizing the risk of data loss. In the event of hardware failure or the loss of a thin client device, critical data remains secure and accessible from other devices connected to the server. This centralized data storage and backup feature not only enhances data protection but also simplifies data management, improves disaster recovery preparedness, and ensures seamless data access for users. Organizations can benefit from efficient data management, reduced data loss risks, and enhanced data availability by leveraging thin clients' centralized data storage and backup capabilities.
The thin client market is segmented on the basis of form factor, application, and region. On the basis of form factor, the market is divided into standalone, with monitor, and mobile. On the basis of application, the market is segregated into enterprise, government, education, industrial, and healthcare. On the basis of region, the market is analyzed across North America (U.S., Canada, and Mexico), Europe (UK, Germany, France, and Rest of Europe), Asia-Pacific (China, Japan, India, South Korea, and Rest of Asia-Pacific), and LAMEA (Latin America, Middle East, and Africa).
Leading companies in the thin client industry include Dell Inc., HP Development Company, L.P., Fujian Centerm Information Co., Ltd., Fujitsu, LG Electronics, Advantech Co., Ltd., Siemens, IGEL, OnLogic, and Thinvent.
Key Benefits For Stakeholders
- This report provides a quantitative analysis of the market segments, current trends, estimations, and dynamics of the thin client market analysis from 2022 to 2032 to identify the prevailing thin client market opportunities.
- The market research is offered along with information related to key drivers, restraints, and opportunities.
- Porter's five forces analysis highlights the potency of buyers and suppliers to enable stakeholders make profit-oriented business decisions and strengthen their supplier-buyer network.
- In-depth analysis of the thin client market segmentation assists to determine the prevailing market opportunities.
- Major countries in each region are mapped according to their revenue contribution to the global market.
- Market player positioning facilitates benchmarking and provides a clear understanding of the present position of the market players.
- The report includes the analysis of the regional as well as global thin client market trends, key players, market segments, application areas, and market growth strategies.
Key Market Segments
By Application
- Enterprise
- Government
- Education
- Industrial
- Healthcare
By Form Factor
- Standalone
- With Monitor
- Mobile
By Region
- North America
- U.S.
- Canada
- Mexico
- Europe
- UK
- Germany
- France
- Rest of Europe
- Asia-Pacific
- China
- Japan
- India
- South Korea
- Rest of Asia-Pacific
- LAMEA
- Latin America
- Middle East
- Africa
Key Market Players:
- Thinvent Technologies
- HP Development Company, L.P.
- LG Electronics
- IGEL
- Advantech Co., Ltd.
- OnLogic LLC
- Dell Inc.
- Siemens
- Fujian Centerm Information Co., Ltd.
- Fujitsu
TABLE OF CONTENTS
CHAPTER 1: INTRODUCTION
- 1.1. Report description
- 1.2. Key market segments
- 1.3. Key benefits to the stakeholders
- 1.4. Research Methodology
- 1.4.1. Primary research
- 1.4.2. Secondary research
- 1.4.3. Analyst tools and models
CHAPTER 2: EXECUTIVE SUMMARY
- 2.1. CXO Perspective
CHAPTER 3: MARKET OVERVIEW
- 3.1. Market definition and scope
- 3.2. Key findings
- 3.2.1. Top impacting factors
- 3.2.2. Top investment pockets
- 3.3. Porter's five forces analysis
- 3.3.1. Bargaining power of suppliers
- 3.3.2. Bargaining power of buyers
- 3.3.3. Threat of substitutes
- 3.3.4. Threat of new entrants
- 3.3.5. Intensity of rivalry
- 3.4. Market dynamics
- 3.4.1. Drivers
- 3.4.1.1. Rise in adoption of cloud-based services
- 3.4.1.2. Centralized data storage and backup
- 3.4.1. Drivers
- 3.4.2. Restraints
- 3.4.2.1. Limitations in customization
- 3.4.3. Opportunities
- 3.4.3.1. Rise in investments in data centers by leading corporations
- 3.5. COVID-19 Impact Analysis on the market
- 3.6. Value Chain Analysis
CHAPTER 4: THIN CLIENT MARKET, BY FORM FACTOR
- 4.1. Overview
- 4.1.1. Market size and forecast
- 4.2. Standalone
- 4.2.1. Key market trends, growth factors and opportunities
- 4.2.2. Market size and forecast, by region
- 4.2.3. Market share analysis by country
- 4.3. With Monitor
- 4.3.1. Key market trends, growth factors and opportunities
- 4.3.2. Market size and forecast, by region
- 4.3.3. Market share analysis by country
- 4.4. Mobile
- 4.4.1. Key market trends, growth factors and opportunities
- 4.4.2. Market size and forecast, by region
- 4.4.3. Market share analysis by country
CHAPTER 5: THIN CLIENT MARKET, BY APPLICATION
- 5.1. Overview
- 5.1.1. Market size and forecast
- 5.2. Enterprise
- 5.2.1. Key market trends, growth factors and opportunities
- 5.2.2. Market size and forecast, by region
- 5.2.3. Market share analysis by country
- 5.3. Government
- 5.3.1. Key market trends, growth factors and opportunities
- 5.3.2. Market size and forecast, by region
- 5.3.3. Market share analysis by country
- 5.4. Education
- 5.4.1. Key market trends, growth factors and opportunities
- 5.4.2. Market size and forecast, by region
- 5.4.3. Market share analysis by country
- 5.5. Industrial
- 5.5.1. Key market trends, growth factors and opportunities
- 5.5.2. Market size and forecast, by region
- 5.5.3. Market share analysis by country
- 5.6. Healthcare
- 5.6.1. Key market trends, growth factors and opportunities
- 5.6.2. Market size and forecast, by region
- 5.6.3. Market share analysis by country
CHAPTER 6: THIN CLIENT MARKET, BY REGION
- 6.1. Overview
- 6.1.1. Market size and forecast By Region
- 6.2. North America
- 6.2.1. Key trends and opportunities
- 6.2.2. Market size and forecast, by Form Factor
- 6.2.3. Market size and forecast, by Application
- 6.2.4. Market size and forecast, by country
- 6.2.4.1. U.S.
- 6.2.4.1.1. Key market trends, growth factors and opportunities
- 6.2.4.1.2. Market size and forecast, by Form Factor
- 6.2.4.1.3. Market size and forecast, by Application
- 6.2.4.2. Canada
- 6.2.4.2.1. Key market trends, growth factors and opportunities
- 6.2.4.2.2. Market size and forecast, by Form Factor
- 6.2.4.2.3. Market size and forecast, by Application
- 6.2.4.3. Mexico
- 6.2.4.3.1. Key market trends, growth factors and opportunities
- 6.2.4.3.2. Market size and forecast, by Form Factor
- 6.2.4.3.3. Market size and forecast, by Application
- 6.3. Europe
- 6.3.1. Key trends and opportunities
- 6.3.2. Market size and forecast, by Form Factor
- 6.3.3. Market size and forecast, by Application
- 6.3.4. Market size and forecast, by country
- 6.3.4.1. UK
- 6.3.4.1.1. Key market trends, growth factors and opportunities
- 6.3.4.1.2. Market size and forecast, by Form Factor
- 6.3.4.1.3. Market size and forecast, by Application
- 6.3.4.2. Germany
- 6.3.4.2.1. Key market trends, growth factors and opportunities
- 6.3.4.2.2. Market size and forecast, by Form Factor
- 6.3.4.2.3. Market size and forecast, by Application
- 6.3.4.3. France
- 6.3.4.3.1. Key market trends, growth factors and opportunities
- 6.3.4.3.2. Market size and forecast, by Form Factor
- 6.3.4.3.3. Market size and forecast, by Application
- 6.3.4.4. Rest of Europe
- 6.3.4.4.1. Key market trends, growth factors and opportunities
- 6.3.4.4.2. Market size and forecast, by Form Factor
- 6.3.4.4.3. Market size and forecast, by Application
- 6.4. Asia-Pacific
- 6.4.1. Key trends and opportunities
- 6.4.2. Market size and forecast, by Form Factor
- 6.4.3. Market size and forecast, by Application
- 6.4.4. Market size and forecast, by country
- 6.4.4.1. China
- 6.4.4.1.1. Key market trends, growth factors and opportunities
- 6.4.4.1.2. Market size and forecast, by Form Factor
- 6.4.4.1.3. Market size and forecast, by Application
- 6.4.4.2. Japan
- 6.4.4.2.1. Key market trends, growth factors and opportunities
- 6.4.4.2.2. Market size and forecast, by Form Factor
- 6.4.4.2.3. Market size and forecast, by Application
- 6.4.4.3. India
- 6.4.4.3.1. Key market trends, growth factors and opportunities
- 6.4.4.3.2. Market size and forecast, by Form Factor
- 6.4.4.3.3. Market size and forecast, by Application
- 6.4.4.4. South Korea
- 6.4.4.4.1. Key market trends, growth factors and opportunities
- 6.4.4.4.2. Market size and forecast, by Form Factor
- 6.4.4.4.3. Market size and forecast, by Application
- 6.4.4.5. Rest of Asia-Pacific
- 6.4.4.5.1. Key market trends, growth factors and opportunities
- 6.4.4.5.2. Market size and forecast, by Form Factor
- 6.4.4.5.3. Market size and forecast, by Application
- 6.5. LAMEA
- 6.5.1. Key trends and opportunities
- 6.5.2. Market size and forecast, by Form Factor
- 6.5.3. Market size and forecast, by Application
- 6.5.4. Market size and forecast, by country
- 6.5.4.1. Latin America
- 6.5.4.1.1. Key market trends, growth factors and opportunities
- 6.5.4.1.2. Market size and forecast, by Form Factor
- 6.5.4.1.3. Market size and forecast, by Application
- 6.5.4.2. Middle East
- 6.5.4.2.1. Key market trends, growth factors and opportunities
- 6.5.4.2.2. Market size and forecast, by Form Factor
- 6.5.4.2.3. Market size and forecast, by Application
- 6.5.4.3. Africa
- 6.5.4.3.1. Key market trends, growth factors and opportunities
- 6.5.4.3.2. Market size and forecast, by Form Factor
- 6.5.4.3.3. Market size and forecast, by Application
CHAPTER 7: COMPETITIVE LANDSCAPE
- 7.1. Introduction
- 7.2. Top winning strategies
- 7.3. Product Mapping of Top 10 Player
- 7.4. Competitive Dashboard
- 7.5. Competitive Heatmap
- 7.6. Top player positioning, 2022
CHAPTER 8: COMPANY PROFILES
- 8.1. Dell Inc.
- 8.1.1. Company overview
- 8.1.2. Key Executives
- 8.1.3. Company snapshot
- 8.1.4. Operating business segments
- 8.1.5. Product portfolio
- 8.1.6. Business performance
- 8.1.7. Key strategic moves and developments
- 8.2. HP Development Company, L.P.
- 8.2.1. Company overview
- 8.2.2. Key Executives
- 8.2.3. Company snapshot
- 8.2.4. Operating business segments
- 8.2.5. Product portfolio
- 8.2.6. Business performance
- 8.3. Fujian Centerm Information Co., Ltd.
- 8.3.1. Company overview
- 8.3.2. Key Executives
- 8.3.3. Company snapshot
- 8.3.4. Operating business segments
- 8.3.5. Product portfolio
- 8.4. Fujitsu
- 8.4.1. Company overview
- 8.4.2. Key Executives
- 8.4.3. Company snapshot
- 8.4.4. Operating business segments
- 8.4.5. Product portfolio
- 8.4.6. Business performance
- 8.4.7. Key strategic moves and developments
- 8.5. LG Electronics
- 8.5.1. Company overview
- 8.5.2. Key Executives
- 8.5.3. Company snapshot
- 8.5.4. Operating business segments
- 8.5.5. Product portfolio
- 8.5.6. Business performance
- 8.5.7. Key strategic moves and developments
- 8.6. Advantech Co., Ltd.
- 8.6.1. Company overview
- 8.6.2. Key Executives
- 8.6.3. Company snapshot
- 8.6.4. Operating business segments
- 8.6.5. Product portfolio
- 8.6.6. Business performance
- 8.7. Siemens
- 8.7.1. Company overview
- 8.7.2. Key Executives
- 8.7.3. Company snapshot
- 8.7.4. Operating business segments
- 8.7.5. Product portfolio
- 8.7.6. Business performance
- 8.8. IGEL
- 8.8.1. Company overview
- 8.8.2. Key Executives
- 8.8.3. Company snapshot
- 8.8.4. Operating business segments
- 8.8.5. Product portfolio
- 8.8.6. Key strategic moves and developments
- 8.9. OnLogic LLC
- 8.9.1. Company overview
- 8.9.2. Key Executives
- 8.9.3. Company snapshot
- 8.9.4. Operating business segments
- 8.9.5. Product portfolio
- 8.9.6. Key strategic moves and developments
- 8.10. Thinvent Technologies
- 8.10.1. Company overview
- 8.10.2. Key Executives
- 8.10.3. Company snapshot
- 8.10.4. Operating business segments
- 8.10.5. Product portfolio
LIST OF TABLES
- TABLE 01. GLOBAL THIN CLIENT MARKET, BY FORM FACTOR, 2022-2032 ($MILLION)
- TABLE 02. THIN CLIENT MARKET FOR STANDALONE, BY REGION, 2022-2032 ($MILLION)
- TABLE 03. THIN CLIENT MARKET FOR WITH MONITOR, BY REGION, 2022-2032 ($MILLION)
- TABLE 04. THIN CLIENT MARKET FOR MOBILE, BY REGION, 2022-2032 ($MILLION)
- TABLE 05. GLOBAL THIN CLIENT MARKET, BY APPLICATION, 2022-2032 ($MILLION)
- TABLE 06. THIN CLIENT MARKET FOR ENTERPRISE, BY REGION, 2022-2032 ($MILLION)
- TABLE 07. THIN CLIENT MARKET FOR GOVERNMENT, BY REGION, 2022-2032 ($MILLION)
- TABLE 08. THIN CLIENT MARKET FOR EDUCATION, BY REGION, 2022-2032 ($MILLION)
- TABLE 09. THIN CLIENT MARKET FOR INDUSTRIAL, BY REGION, 2022-2032 ($MILLION)
- TABLE 10. THIN CLIENT MARKET FOR HEALTHCARE, BY REGION, 2022-2032 ($MILLION)
- TABLE 11. THIN CLIENT MARKET, BY REGION, 2022-2032 ($MILLION)
- TABLE 12. NORTH AMERICA THIN CLIENT MARKET, BY FORM FACTOR, 2022-2032 ($MILLION)
- TABLE 13. NORTH AMERICA THIN CLIENT MARKET, BY APPLICATION, 2022-2032 ($MILLION)
- TABLE 14. NORTH AMERICA THIN CLIENT MARKET, BY COUNTRY, 2022-2032 ($MILLION)
- TABLE 15. U.S. THIN CLIENT MARKET, BY FORM FACTOR, 2022-2032 ($MILLION)
- TABLE 16. U.S. THIN CLIENT MARKET, BY APPLICATION, 2022-2032 ($MILLION)
- TABLE 17. CANADA THIN CLIENT MARKET, BY FORM FACTOR, 2022-2032 ($MILLION)
- TABLE 18. CANADA THIN CLIENT MARKET, BY APPLICATION, 2022-2032 ($MILLION)
- TABLE 19. MEXICO THIN CLIENT MARKET, BY FORM FACTOR, 2022-2032 ($MILLION)
- TABLE 20. MEXICO THIN CLIENT MARKET, BY APPLICATION, 2022-2032 ($MILLION)
- TABLE 21. EUROPE THIN CLIENT MARKET, BY FORM FACTOR, 2022-2032 ($MILLION)
- TABLE 22. EUROPE THIN CLIENT MARKET, BY APPLICATION, 2022-2032 ($MILLION)
- TABLE 23. EUROPE THIN CLIENT MARKET, BY COUNTRY, 2022-2032 ($MILLION)
- TABLE 24. UK THIN CLIENT MARKET, BY FORM FACTOR, 2022-2032 ($MILLION)
- TABLE 25. UK THIN CLIENT MARKET, BY APPLICATION, 2022-2032 ($MILLION)
- TABLE 26. GERMANY THIN CLIENT MARKET, BY FORM FACTOR, 2022-2032 ($MILLION)
- TABLE 27. GERMANY THIN CLIENT MARKET, BY APPLICATION, 2022-2032 ($MILLION)
- TABLE 28. FRANCE THIN CLIENT MARKET, BY FORM FACTOR, 2022-2032 ($MILLION)
- TABLE 29. FRANCE THIN CLIENT MARKET, BY APPLICATION, 2022-2032 ($MILLION)
- TABLE 30. REST OF EUROPE THIN CLIENT MARKET, BY FORM FACTOR, 2022-2032 ($MILLION)
- TABLE 31. REST OF EUROPE THIN CLIENT MARKET, BY APPLICATION, 2022-2032 ($MILLION)
- TABLE 32. ASIA-PACIFIC THIN CLIENT MARKET, BY FORM FACTOR, 2022-2032 ($MILLION)
- TABLE 33. ASIA-PACIFIC THIN CLIENT MARKET, BY APPLICATION, 2022-2032 ($MILLION)
- TABLE 34. ASIA-PACIFIC THIN CLIENT MARKET, BY COUNTRY, 2022-2032 ($MILLION)
- TABLE 35. CHINA THIN CLIENT MARKET, BY FORM FACTOR, 2022-2032 ($MILLION)
- TABLE 36. CHINA THIN CLIENT MARKET, BY APPLICATION, 2022-2032 ($MILLION)
- TABLE 37. JAPAN THIN CLIENT MARKET, BY FORM FACTOR, 2022-2032 ($MILLION)
- TABLE 38. JAPAN THIN CLIENT MARKET, BY APPLICATION, 2022-2032 ($MILLION)
- TABLE 39. INDIA THIN CLIENT MARKET, BY FORM FACTOR, 2022-2032 ($MILLION)
- TABLE 40. INDIA THIN CLIENT MARKET, BY APPLICATION, 2022-2032 ($MILLION)
- TABLE 41. SOUTH KOREA THIN CLIENT MARKET, BY FORM FACTOR, 2022-2032 ($MILLION)
- TABLE 42. SOUTH KOREA THIN CLIENT MARKET, BY APPLICATION, 2022-2032 ($MILLION)
- TABLE 43. REST OF ASIA-PACIFIC THIN CLIENT MARKET, BY FORM FACTOR, 2022-2032 ($MILLION)
- TABLE 44. REST OF ASIA-PACIFIC THIN CLIENT MARKET, BY APPLICATION, 2022-2032 ($MILLION)
- TABLE 45. LAMEA THIN CLIENT MARKET, BY FORM FACTOR, 2022-2032 ($MILLION)
- TABLE 46. LAMEA THIN CLIENT MARKET, BY APPLICATION, 2022-2032 ($MILLION)
- TABLE 47. LAMEA THIN CLIENT MARKET, BY COUNTRY, 2022-2032 ($MILLION)
- TABLE 48. LATIN AMERICA THIN CLIENT MARKET, BY FORM FACTOR, 2022-2032 ($MILLION)
- TABLE 49. LATIN AMERICA THIN CLIENT MARKET, BY APPLICATION, 2022-2032 ($MILLION)
- TABLE 50. MIDDLE EAST THIN CLIENT MARKET, BY FORM FACTOR, 2022-2032 ($MILLION)
- TABLE 51. MIDDLE EAST THIN CLIENT MARKET, BY APPLICATION, 2022-2032 ($MILLION)
- TABLE 52. AFRICA THIN CLIENT MARKET, BY FORM FACTOR, 2022-2032 ($MILLION)
- TABLE 53. AFRICA THIN CLIENT MARKET, BY APPLICATION, 2022-2032 ($MILLION)
- TABLE 54. DELL INC.: KEY EXECUTIVES
- TABLE 55. DELL INC.: COMPANY SNAPSHOT
- TABLE 56. DELL INC.: SERVICE SEGMENTS
- TABLE 57. DELL INC.: PRODUCT PORTFOLIO
- TABLE 58. DELL INC.: KEY STRATERGIES
- TABLE 59. HP DEVELOPMENT COMPANY, L.P.: KEY EXECUTIVES
- TABLE 60. HP DEVELOPMENT COMPANY, L.P.: COMPANY SNAPSHOT
- TABLE 61. HP DEVELOPMENT COMPANY, L.P.: SERVICE SEGMENTS
- TABLE 62. HP DEVELOPMENT COMPANY, L.P.: PRODUCT PORTFOLIO
- TABLE 63. FUJIAN CENTERM INFORMATION CO., LTD.: KEY EXECUTIVES
- TABLE 64. FUJIAN CENTERM INFORMATION CO., LTD.: COMPANY SNAPSHOT
- TABLE 65. FUJIAN CENTERM INFORMATION CO., LTD.: SERVICE SEGMENTS
- TABLE 66. FUJIAN CENTERM INFORMATION CO., LTD.: PRODUCT PORTFOLIO
- TABLE 67. FUJITSU: KEY EXECUTIVES
- TABLE 68. FUJITSU: COMPANY SNAPSHOT
- TABLE 69. FUJITSU: SERVICE SEGMENTS
- TABLE 70. FUJITSU: PRODUCT PORTFOLIO
- TABLE 71. FUJITSU: KEY STRATERGIES
- TABLE 72. LG ELECTRONICS: KEY EXECUTIVES
- TABLE 73. LG ELECTRONICS: COMPANY SNAPSHOT
- TABLE 74. LG ELECTRONICS: SERVICE SEGMENTS
- TABLE 75. LG ELECTRONICS: PRODUCT PORTFOLIO
- TABLE 76. LG ELECTRONICS: KEY STRATERGIES
- TABLE 77. ADVANTECH CO., LTD.: KEY EXECUTIVES
- TABLE 78. ADVANTECH CO., LTD.: COMPANY SNAPSHOT
- TABLE 79. ADVANTECH CO., LTD.: SERVICE SEGMENTS
- TABLE 80. ADVANTECH CO., LTD.: PRODUCT PORTFOLIO
- TABLE 81. SIEMENS: KEY EXECUTIVES
- TABLE 82. SIEMENS: COMPANY SNAPSHOT
- TABLE 83. SIEMENS: PRODUCT SEGMENTS
- TABLE 84. SIEMENS: PRODUCT PORTFOLIO
- TABLE 85. IGEL: KEY EXECUTIVES
- TABLE 86. IGEL: COMPANY SNAPSHOT
- TABLE 87. IGEL: SERVICE SEGMENTS
- TABLE 88. IGEL: PRODUCT PORTFOLIO
- TABLE 89. IGEL: KEY STRATERGIES
- TABLE 90. ONLOGIC LLC: KEY EXECUTIVES
- TABLE 91. ONLOGIC LLC: COMPANY SNAPSHOT
- TABLE 92. ONLOGIC LLC: SERVICE SEGMENTS
- TABLE 93. ONLOGIC LLC: PRODUCT PORTFOLIO
- TABLE 94. ONLOGIC LLC: KEY STRATERGIES
- TABLE 95. THINVENT TECHNOLOGIES: KEY EXECUTIVES
- TABLE 96. THINVENT TECHNOLOGIES: COMPANY SNAPSHOT
- TABLE 97. THINVENT TECHNOLOGIES: SERVICE SEGMENTS
- TABLE 98. THINVENT TECHNOLOGIES: PRODUCT PORTFOLIO
LIST OF FIGURES
- FIGURE 01. THIN CLIENT MARKET, 2022-2032
- FIGURE 02. SEGMENTATION OF THIN CLIENT MARKET, 2022-2032
- FIGURE 03. TOP INVESTMENT POCKETS IN THIN CLIENT MARKET (2023-2032)
- FIGURE 04. HIGH BARGAINING POWER OF SUPPLIERS
- FIGURE 05. LOW TO MODERATE BARGAINING POWER OF BUYERS
- FIGURE 06. MODERATE THREAT OF SUBSTITUTES
- FIGURE 07. MODERATE THREAT OF NEW ENTRANTS
- FIGURE 08. LOW INTENSITY OF RIVALRY
- FIGURE 09. DRIVERS, RESTRAINTS AND OPPORTUNITIES: GLOBALTHIN CLIENT MARKET
- FIGURE 10. VALUE CHAIN ANALYSIS: THIN CLIENT MARKET
- FIGURE 11. THIN CLIENT MARKET, BY FORM FACTOR, 2022(%)
- FIGURE 12. COMPARATIVE SHARE ANALYSIS OF THIN CLIENT MARKET FOR STANDALONE, BY COUNTRY 2022 AND 2032(%)
- FIGURE 13. COMPARATIVE SHARE ANALYSIS OF THIN CLIENT MARKET FOR WITH MONITOR, BY COUNTRY 2022 AND 2032(%)
- FIGURE 14. COMPARATIVE SHARE ANALYSIS OF THIN CLIENT MARKET FOR MOBILE, BY COUNTRY 2022 AND 2032(%)
- FIGURE 15. THIN CLIENT MARKET, BY APPLICATION, 2022(%)
- FIGURE 16. COMPARATIVE SHARE ANALYSIS OF THIN CLIENT MARKET FOR ENTERPRISE, BY COUNTRY 2022 AND 2032(%)
- FIGURE 17. COMPARATIVE SHARE ANALYSIS OF THIN CLIENT MARKET FOR GOVERNMENT, BY COUNTRY 2022 AND 2032(%)
- FIGURE 18. COMPARATIVE SHARE ANALYSIS OF THIN CLIENT MARKET FOR EDUCATION, BY COUNTRY 2022 AND 2032(%)
- FIGURE 19. COMPARATIVE SHARE ANALYSIS OF THIN CLIENT MARKET FOR INDUSTRIAL, BY COUNTRY 2022 AND 2032(%)
- FIGURE 20. COMPARATIVE SHARE ANALYSIS OF THIN CLIENT MARKET FOR HEALTHCARE, BY COUNTRY 2022 AND 2032(%)
- FIGURE 21. THIN CLIENT MARKET BY REGION, 2022
- FIGURE 22. U.S. THIN CLIENT MARKET, 2022-2032 ($MILLION)
- FIGURE 23. CANADA THIN CLIENT MARKET, 2022-2032 ($MILLION)
- FIGURE 24. MEXICO THIN CLIENT MARKET, 2022-2032 ($MILLION)
- FIGURE 25. UK THIN CLIENT MARKET, 2022-2032 ($MILLION)
- FIGURE 26. GERMANY THIN CLIENT MARKET, 2022-2032 ($MILLION)
- FIGURE 27. FRANCE THIN CLIENT MARKET, 2022-2032 ($MILLION)
- FIGURE 28. REST OF EUROPE THIN CLIENT MARKET, 2022-2032 ($MILLION)
- FIGURE 29. CHINA THIN CLIENT MARKET, 2022-2032 ($MILLION)
- FIGURE 30. JAPAN THIN CLIENT MARKET, 2022-2032 ($MILLION)
- FIGURE 31. INDIA THIN CLIENT MARKET, 2022-2032 ($MILLION)
- FIGURE 32. SOUTH KOREA THIN CLIENT MARKET, 2022-2032 ($MILLION)
- FIGURE 33. REST OF ASIA-PACIFIC THIN CLIENT MARKET, 2022-2032 ($MILLION)
- FIGURE 34. LATIN AMERICA THIN CLIENT MARKET, 2022-2032 ($MILLION)
- FIGURE 35. MIDDLE EAST THIN CLIENT MARKET, 2022-2032 ($MILLION)
- FIGURE 36. AFRICA THIN CLIENT MARKET, 2022-2032 ($MILLION)
- FIGURE 37. TOP WINNING STRATEGIES, BY YEAR
- FIGURE 38. TOP WINNING STRATEGIES, BY DEVELOPMENT
- FIGURE 39. TOP WINNING STRATEGIES, BY COMPANY
- FIGURE 40. PRODUCT MAPPING OF TOP 10 PLAYERS
- FIGURE 41. COMPETITIVE DASHBOARD
- FIGURE 42. COMPETITIVE HEATMAP: THIN CLIENT MARKET
- FIGURE 43. TOP PLAYER POSITIONING, 2022
- FIGURE 44. DELL INC.: NET REVENUE, 2019-2021 ($MILLION)
- FIGURE 45. DELL INC.: REVENUE SHARE BY SEGMENT, 2021 (%)
- FIGURE 46. DELL INC.: REVENUE SHARE BY REGION, 2021 (%)
- FIGURE 47. HP DEVELOPMENT COMPANY, L.P.: NET REVENUE, 2020-2022 ($MILLION)
- FIGURE 48. HP DEVELOPMENT COMPANY, L.P.: RESEARCH & DEVELOPMENT EXPENDITURE, 2020-2022 ($MILLION)
- FIGURE 49. HP DEVELOPMENT COMPANY, L.P.: REVENUE SHARE BY SEGMENT, 2022 (%)
- FIGURE 50. HP DEVELOPMENT COMPANY, L.P.: REVENUE SHARE BY REGION, 2022 (%)
- FIGURE 51. FUJITSU: NET REVENUE, 2020-2022 ($MILLION)
- FIGURE 52. FUJITSU: REVENUE SHARE BY SEGMENT, 2021 (%)
- FIGURE 53. FUJITSU: REVENUE SHARE BY REGION, 2021 (%)
- FIGURE 54. LG ELECTRONICS: NET SALES, 2020-2022 ($MILLION)
- FIGURE 55. LG ELECTRONICS: RESEARCH & DEVELOPMENT EXPENDITURE, 2020-2022 ($MILLION)
- FIGURE 56. LG ELECTRONICS: REVENUE SHARE BY SEGMENT, 2022 (%)
- FIGURE 57. ADVANTECH CO., LTD.: NET REVENUE, 2020-2022 ($MILLION)
- FIGURE 58. ADVANTECH CO., LTD.: REVENUE SHARE BY SEGMENT, 2021 (%)
- FIGURE 59. SIEMENS: NET REVENUE, 2020-2022 ($MILLION)
- FIGURE 60. SIEMENS: REVENUE SHARE BY SEGMENT, 2022 (%)
- FIGURE 61. SIEMENS: REVENUE SHARE BY REGION, 2022 (%)

