
PUBLISHER: Allied Market Research | PRODUCT CODE: 1344423

PUBLISHER: Allied Market Research | PRODUCT CODE: 1344423
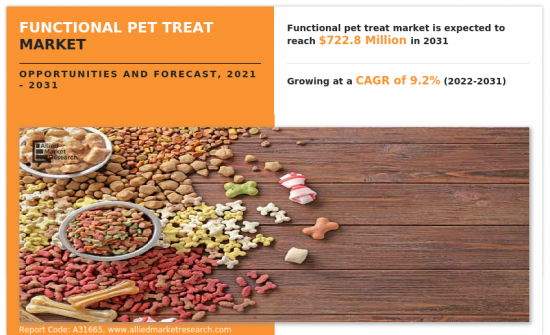
Functional Pet Treat Market By Pet, By Application, By Distribution Channel : Global Opportunity Analysis and Industry Forecast, 2022-2031
According to a new report published by Allied Market Research, titled, "Functional Pet Treat Market," The functional pet treat market was valued at $290.96 million in 2021, and is estimated to reach $722.8 million by 2031, growing at a CAGR of 9.2% from 2022 to 2031.
Functional pet treat is a new & innovative product segment in the pet treat industry, which not only requires advertisement for its awareness but also a wide distribution network. Rapid increase in number of large retail stores, including supermarkets and hypermarkets in developing economies has enabled easier availability of functional pet treat, as these stores help increase sales of organic & conventional functional pet treat products. Supermarkets and convenience stores have served as better distribution points for various pet supplements. In addition, growth in urbanization is expected to boost growth of the retail sector, which, in turn, generates demand for functional pet treat.
The concept of pet ownership is not just limited to developed countries, such as U.S., the UK, and Australia, but is also escalating in developing nations such as India, China, and Brazil. With rapid increase in personal disposable income, people in such nations are able to own a pet and provide the best quality of life to them. Mexico alone owned around 18 million pets that resulted in around 8% of increased pet treat sales in 2015. In addition, the Asia-Pacific functional pet treat industry is growing tremendously, owing to increase in pet population. For instance, India's pet population has witnessed growth from 7 million in 2006 to more than 10 million pets in 2011. Improvement in consumer lifestyles and increase in incomes in developing countries resulted in increased acceptance for pets among all income groups.
Rise in regulatory constraints in pet treat, pet functional treat, and pet supplement industry are expected to negatively affect the functional pet treat market during the forecast period. For instance, in the U.S., pet treat is highly regulated by the U.S. FDA to meet both federal and state requirements. The U.S. FDA has imposed laws on both finished pet supplements and their application. Any ingredient cannot be used in pet treat supplement until it has been accepted by the FDA and Association of American Feed Control Officials (AAFCO). These organizations develop model bills & legislations for pet supplements.
Under the Food Safety Modernization Act (FSMA) 2010, guidelines for pet supplement manufacturers in the U.S. were issued related to certification, sterilization, hygiene, and labeling of food. In addition, owing to lack of a universal regulatory structure, global trading becomes difficult. Huge investments are made in manufacturing functional pet treats additives and different regulations & guidelines lead to severe losses for manufacturers. Therefore, it becomes expensive to frequently update manufacturing raw material and facilities in accordance with changing guidelines. The aforementioned factors are expected to hinder the growth of the market during the forecast period.
The functional pet treat market is analyzed across North America, Europe, Asia-Pacific, and LAMEA. In 2021, North America dominated the functional pet treat market, and is expected to sustain its dominance during the forecast period. This is majorly attributed to rise in adoption of pets and increase in spending on pet care products, including healthcare & grooming products. Furthermore, growth in innovation in pet treat & supplement packaging is expected to escalate the demand for functional pet treat in North America. Furthermore, rise in research to find natural & organic pet ingredient, which can be used in functional pet treat creates potential opportunities for growth of the market. Moreover, pet owners look for premium & super premium functional pet treat, owing to growth in concerns regarding health of their pets & animal welfare in North America. Canada and Mexico are lucrative markets for pet supplements, growing at a CAGR of 9.6% and 9.3%, respectively, during the forecast period.
For the purpose of analysis, the global functional pet treat market scope covers segmentation based on pet, application, distribution channel, and region. The report provides information on various pets such as dog, cat, and others. In addition, it outlines the details about different applications, including bone health, brain health, obesity, skin diseases, and others. Furthermore, the key distribution channels covered in the study include pet stores, pharmacies, veterinary clinics, online stores, and others. Moreover, it analyzes the current market trends of functional pet treat across different regions such as North America, Europe, Asia-Pacific, and LAMEA.
Further, the report covers strategies adopted by key market players to sustain the competitive environment and increase their market share. Archer-Daniels-Midland Company, Bacterfield, DAR PRO Ingredients, IsoNova Technologies LLC, Kerry Group, Nestle Purina PetCare Company, PDM Group (Prosper De Mulder Ltd.), Petcurean Pet Nutrition USA Inc., Roquette Freres, and The Scoular Company are some of the major players discussed in the report, which cater to the functional pet treat market.
Key Benefits For Stakeholders
- This report provides a quantitative analysis of the market segments, current trends, estimations, and dynamics of the functional pet treat market analysis from 2021 to 2031 to identify the prevailing functional pet treat market opportunities.
- The market research is offered along with information related to key drivers, restraints, and opportunities.
- Porter's five forces analysis highlights the potency of buyers and suppliers to enable stakeholders make profit-oriented business decisions and strengthen their supplier-buyer network.
- In-depth analysis of the functional pet treat market segmentation assists to determine the prevailing market opportunities.
- Major countries in each region are mapped according to their revenue contribution to the global market.
- Market player positioning facilitates benchmarking and provides a clear understanding of the present position of the market players.
- The report includes the analysis of the regional as well as global functional pet treat market trends, key players, market segments, application areas, and market growth strategies.
Key Market Segments
By Application
- Bone Health
- Brain Health
- Obesity
- Skin Diseases
- Others
By Pet
- Dog
- Cat
- Others
By Distribution Channel
- Pet Stores
- Pharmacies
- Veterinary Clinics
- Online Stores
- Others
By Region
- North America
- U.S.
- Canada
- Mexico
- Europe
- UK
- France
- Germany
- Russia
- Spain
- Italy
- Rest of Europe
- Asia-Pacific
- China
- Japan
- India
- Australia
- Rest of Asia-Pacific
- LAMEA
- Brazil
- Argentina
- Saudi Arabia
- South Africa
- Rest of LAMEA
Key Market Players:
- Sunshine Mills Inc.
- The J.M. Smucker Co.
- Plato Pet Treats
- Mars, Incorporated
- Real Pet Food Company Pty. Ltd.
- General Mills Inc.
- Thai Union Group PCL.
- Wellness Pet Company, Inc.
- Natural Balance Pet Foods, Inc.
- Colgate-Palmolive Company
- Nestle S.A.
- Nulo Pet Food
- Pure Treats Inc.
- Charoen Pokphand Foods PLC.
- Better Choice Company Inc.
TABLE OF CONTENTS
CHAPTER 1: INTRODUCTION
- 1.1. Report description
- 1.2. Key market segments
- 1.3. Key benefits to the stakeholders
- 1.4. Research Methodology
- 1.4.1. Primary research
- 1.4.2. Secondary research
- 1.4.3. Analyst tools and models
CHAPTER 2: EXECUTIVE SUMMARY
- 2.1. CXO Perspective
CHAPTER 3: MARKET OVERVIEW
- 3.1. Market definition and scope
- 3.2. Key findings
- 3.2.1. Top impacting factors
- 3.2.2. Top investment pockets
- 3.3. Porter's five forces analysis
- 3.3.1. Bargaining power of suppliers
- 3.3.2. Bargaining power of buyers
- 3.3.3. Threat of substitutes
- 3.3.4. Threat of new entrants
- 3.3.5. Intensity of rivalry
- 3.4. Market dynamics
- 3.4.1. Drivers
- 3.4.1.1. Traditional ways of feeding pets
- 3.4.1.2. Lack of awareness regarding the benefits of functional pet treat
- 3.4.1.3. Increase in regulatory guidelines related to pet treat
- 3.4.1. Drivers
- 3.4.2. Restraints
- 3.4.2.1. Rise in trend of pet humanization
- 3.4.2.2. Increase in awareness about pet health
- 3.4.2.3. Rapid growth of retail sector and pet shops
- 3.4.3. Opportunities
- 3.4.3.1. Product innovation and rise in demand for organic ingredients
- 3.4.3.2. Increase in pet ownership in developing nations
- 3.4.3.3. Rise in e-commerce sales
- 3.5. COVID-19 Impact Analysis on the market
- 3.6. Market Share Analysis
CHAPTER 4: FUNCTIONAL PET TREAT MARKET, BY PET
- 4.1. Overview
- 4.1.1. Market size and forecast
- 4.2. Dog
- 4.2.1. Key market trends, growth factors and opportunities
- 4.2.2. Market size and forecast, by region
- 4.2.3. Market share analysis by country
- 4.3. Cat
- 4.3.1. Key market trends, growth factors and opportunities
- 4.3.2. Market size and forecast, by region
- 4.3.3. Market share analysis by country
- 4.4. Others
- 4.4.1. Key market trends, growth factors and opportunities
- 4.4.2. Market size and forecast, by region
- 4.4.3. Market share analysis by country
CHAPTER 5: FUNCTIONAL PET TREAT MARKET, BY APPLICATION
- 5.1. Overview
- 5.1.1. Market size and forecast
- 5.2. Bone Health
- 5.2.1. Key market trends, growth factors and opportunities
- 5.2.2. Market size and forecast, by region
- 5.2.3. Market share analysis by country
- 5.3. Brain Health
- 5.3.1. Key market trends, growth factors and opportunities
- 5.3.2. Market size and forecast, by region
- 5.3.3. Market share analysis by country
- 5.4. Obesity
- 5.4.1. Key market trends, growth factors and opportunities
- 5.4.2. Market size and forecast, by region
- 5.4.3. Market share analysis by country
- 5.5. Skin Diseases
- 5.5.1. Key market trends, growth factors and opportunities
- 5.5.2. Market size and forecast, by region
- 5.5.3. Market share analysis by country
- 5.6. Others
- 5.6.1. Key market trends, growth factors and opportunities
- 5.6.2. Market size and forecast, by region
- 5.6.3. Market share analysis by country
CHAPTER 6: FUNCTIONAL PET TREAT MARKET, BY DISTRIBUTION CHANNEL
- 6.1. Overview
- 6.1.1. Market size and forecast
- 6.2. Pet Stores
- 6.2.1. Key market trends, growth factors and opportunities
- 6.2.2. Market size and forecast, by region
- 6.2.3. Market share analysis by country
- 6.3. Pharmacies
- 6.3.1. Key market trends, growth factors and opportunities
- 6.3.2. Market size and forecast, by region
- 6.3.3. Market share analysis by country
- 6.4. Veterinary Clinics
- 6.4.1. Key market trends, growth factors and opportunities
- 6.4.2. Market size and forecast, by region
- 6.4.3. Market share analysis by country
- 6.5. Online Stores
- 6.5.1. Key market trends, growth factors and opportunities
- 6.5.2. Market size and forecast, by region
- 6.5.3. Market share analysis by country
- 6.6. Others
- 6.6.1. Key market trends, growth factors and opportunities
- 6.6.2. Market size and forecast, by region
- 6.6.3. Market share analysis by country
CHAPTER 7: FUNCTIONAL PET TREAT MARKET, BY REGION
- 7.1. Overview
- 7.1.1. Market size and forecast By Region
- 7.2. North America
- 7.2.1. Key trends and opportunities
- 7.2.2. Market size and forecast, by Pet
- 7.2.3. Market size and forecast, by Application
- 7.2.4. Market size and forecast, by Distribution Channel
- 7.2.5. Market size and forecast, by country
- 7.2.5.1. U.S.
- 7.2.5.1.1. Key market trends, growth factors and opportunities
- 7.2.5.1.2. Market size and forecast, by Pet
- 7.2.5.1.3. Market size and forecast, by Application
- 7.2.5.1.4. Market size and forecast, by Distribution Channel
- 7.2.5.2. Canada
- 7.2.5.2.1. Key market trends, growth factors and opportunities
- 7.2.5.2.2. Market size and forecast, by Pet
- 7.2.5.2.3. Market size and forecast, by Application
- 7.2.5.2.4. Market size and forecast, by Distribution Channel
- 7.2.5.3. Mexico
- 7.2.5.3.1. Key market trends, growth factors and opportunities
- 7.2.5.3.2. Market size and forecast, by Pet
- 7.2.5.3.3. Market size and forecast, by Application
- 7.2.5.3.4. Market size and forecast, by Distribution Channel
- 7.3. Europe
- 7.3.1. Key trends and opportunities
- 7.3.2. Market size and forecast, by Pet
- 7.3.3. Market size and forecast, by Application
- 7.3.4. Market size and forecast, by Distribution Channel
- 7.3.5. Market size and forecast, by country
- 7.3.5.1. UK
- 7.3.5.1.1. Key market trends, growth factors and opportunities
- 7.3.5.1.2. Market size and forecast, by Pet
- 7.3.5.1.3. Market size and forecast, by Application
- 7.3.5.1.4. Market size and forecast, by Distribution Channel
- 7.3.5.2. France
- 7.3.5.2.1. Key market trends, growth factors and opportunities
- 7.3.5.2.2. Market size and forecast, by Pet
- 7.3.5.2.3. Market size and forecast, by Application
- 7.3.5.2.4. Market size and forecast, by Distribution Channel
- 7.3.5.3. Germany
- 7.3.5.3.1. Key market trends, growth factors and opportunities
- 7.3.5.3.2. Market size and forecast, by Pet
- 7.3.5.3.3. Market size and forecast, by Application
- 7.3.5.3.4. Market size and forecast, by Distribution Channel
- 7.3.5.4. Russia
- 7.3.5.4.1. Key market trends, growth factors and opportunities
- 7.3.5.4.2. Market size and forecast, by Pet
- 7.3.5.4.3. Market size and forecast, by Application
- 7.3.5.4.4. Market size and forecast, by Distribution Channel
- 7.3.5.5. Spain
- 7.3.5.5.1. Key market trends, growth factors and opportunities
- 7.3.5.5.2. Market size and forecast, by Pet
- 7.3.5.5.3. Market size and forecast, by Application
- 7.3.5.5.4. Market size and forecast, by Distribution Channel
- 7.3.5.6. Italy
- 7.3.5.6.1. Key market trends, growth factors and opportunities
- 7.3.5.6.2. Market size and forecast, by Pet
- 7.3.5.6.3. Market size and forecast, by Application
- 7.3.5.6.4. Market size and forecast, by Distribution Channel
- 7.3.5.7. Rest of Europe
- 7.3.5.7.1. Key market trends, growth factors and opportunities
- 7.3.5.7.2. Market size and forecast, by Pet
- 7.3.5.7.3. Market size and forecast, by Application
- 7.3.5.7.4. Market size and forecast, by Distribution Channel
- 7.4. Asia-Pacific
- 7.4.1. Key trends and opportunities
- 7.4.2. Market size and forecast, by Pet
- 7.4.3. Market size and forecast, by Application
- 7.4.4. Market size and forecast, by Distribution Channel
- 7.4.5. Market size and forecast, by country
- 7.4.5.1. China
- 7.4.5.1.1. Key market trends, growth factors and opportunities
- 7.4.5.1.2. Market size and forecast, by Pet
- 7.4.5.1.3. Market size and forecast, by Application
- 7.4.5.1.4. Market size and forecast, by Distribution Channel
- 7.4.5.2. Japan
- 7.4.5.2.1. Key market trends, growth factors and opportunities
- 7.4.5.2.2. Market size and forecast, by Pet
- 7.4.5.2.3. Market size and forecast, by Application
- 7.4.5.2.4. Market size and forecast, by Distribution Channel
- 7.4.5.3. India
- 7.4.5.3.1. Key market trends, growth factors and opportunities
- 7.4.5.3.2. Market size and forecast, by Pet
- 7.4.5.3.3. Market size and forecast, by Application
- 7.4.5.3.4. Market size and forecast, by Distribution Channel
- 7.4.5.4. Australia
- 7.4.5.4.1. Key market trends, growth factors and opportunities
- 7.4.5.4.2. Market size and forecast, by Pet
- 7.4.5.4.3. Market size and forecast, by Application
- 7.4.5.4.4. Market size and forecast, by Distribution Channel
- 7.4.5.5. Rest of Asia-Pacific
- 7.4.5.5.1. Key market trends, growth factors and opportunities
- 7.4.5.5.2. Market size and forecast, by Pet
- 7.4.5.5.3. Market size and forecast, by Application
- 7.4.5.5.4. Market size and forecast, by Distribution Channel
- 7.5. LAMEA
- 7.5.1. Key trends and opportunities
- 7.5.2. Market size and forecast, by Pet
- 7.5.3. Market size and forecast, by Application
- 7.5.4. Market size and forecast, by Distribution Channel
- 7.5.5. Market size and forecast, by country
- 7.5.5.1. Brazil
- 7.5.5.1.1. Key market trends, growth factors and opportunities
- 7.5.5.1.2. Market size and forecast, by Pet
- 7.5.5.1.3. Market size and forecast, by Application
- 7.5.5.1.4. Market size and forecast, by Distribution Channel
- 7.5.5.2. Argentina
- 7.5.5.2.1. Key market trends, growth factors and opportunities
- 7.5.5.2.2. Market size and forecast, by Pet
- 7.5.5.2.3. Market size and forecast, by Application
- 7.5.5.2.4. Market size and forecast, by Distribution Channel
- 7.5.5.3. Saudi Arabia
- 7.5.5.3.1. Key market trends, growth factors and opportunities
- 7.5.5.3.2. Market size and forecast, by Pet
- 7.5.5.3.3. Market size and forecast, by Application
- 7.5.5.3.4. Market size and forecast, by Distribution Channel
- 7.5.5.4. South Africa
- 7.5.5.4.1. Key market trends, growth factors and opportunities
- 7.5.5.4.2. Market size and forecast, by Pet
- 7.5.5.4.3. Market size and forecast, by Application
- 7.5.5.4.4. Market size and forecast, by Distribution Channel
- 7.5.5.5. Rest of LAMEA
- 7.5.5.5.1. Key market trends, growth factors and opportunities
- 7.5.5.5.2. Market size and forecast, by Pet
- 7.5.5.5.3. Market size and forecast, by Application
- 7.5.5.5.4. Market size and forecast, by Distribution Channel
CHAPTER 8: COMPETITIVE LANDSCAPE
- 8.1. Introduction
- 8.2. Top winning strategies
- 8.3. Product Mapping of Top 10 Player
- 8.4. Competitive Dashboard
- 8.5. Competitive Heatmap
- 8.6. Top player positioning, 2021
CHAPTER 9: COMPANY PROFILES
- 9.1. Nestle S.A.
- 9.1.1. Company overview
- 9.1.2. Key Executives
- 9.1.3. Company snapshot
- 9.1.4. Operating business segments
- 9.1.5. Product portfolio
- 9.1.6. Business performance
- 9.1.7. Key strategic moves and developments
- 9.2. Mars, Incorporated
- 9.2.1. Company overview
- 9.2.2. Key Executives
- 9.2.3. Company snapshot
- 9.2.4. Operating business segments
- 9.2.5. Product portfolio
- 9.2.6. Key strategic moves and developments
- 9.3. General Mills Inc.
- 9.3.1. Company overview
- 9.3.2. Key Executives
- 9.3.3. Company snapshot
- 9.3.4. Operating business segments
- 9.3.5. Product portfolio
- 9.3.6. Business performance
- 9.3.7. Key strategic moves and developments
- 9.4. Real Pet Food Company Pty. Ltd.
- 9.4.1. Company overview
- 9.4.2. Key Executives
- 9.4.3. Company snapshot
- 9.4.4. Operating business segments
- 9.4.5. Product portfolio
- 9.4.6. Key strategic moves and developments
- 9.5. Natural Balance Pet Foods, Inc.
- 9.5.1. Company overview
- 9.5.2. Key Executives
- 9.5.3. Company snapshot
- 9.5.4. Operating business segments
- 9.5.5. Product portfolio
- 9.6. Wellness Pet Company, Inc.
- 9.6.1. Company overview
- 9.6.2. Key Executives
- 9.6.3. Company snapshot
- 9.6.4. Operating business segments
- 9.6.5. Product portfolio
- 9.7. Sunshine Mills Inc.
- 9.7.1. Company overview
- 9.7.2. Key Executives
- 9.7.3. Company snapshot
- 9.7.4. Operating business segments
- 9.7.5. Product portfolio
- 9.8. Colgate-Palmolive Company
- 9.8.1. Company overview
- 9.8.2. Key Executives
- 9.8.3. Company snapshot
- 9.8.4. Operating business segments
- 9.8.5. Product portfolio
- 9.8.6. Business performance
- 9.9. Plato Pet Treats
- 9.9.1. Company overview
- 9.9.2. Key Executives
- 9.9.3. Company snapshot
- 9.9.4. Operating business segments
- 9.9.5. Product portfolio
- 9.9.6. Key strategic moves and developments
- 9.10. The J.M. Smucker Co.
- 9.10.1. Company overview
- 9.10.2. Key Executives
- 9.10.3. Company snapshot
- 9.10.4. Operating business segments
- 9.10.5. Product portfolio
- 9.10.6. Business performance
- 9.11. Better Choice Company Inc.
- 9.11.1. Company overview
- 9.11.2. Key Executives
- 9.11.3. Company snapshot
- 9.11.4. Operating business segments
- 9.11.5. Product portfolio
- 9.11.6. Business performance
- 9.11.7. Key strategic moves and developments
- 9.12. Charoen Pokphand Foods PLC.
- 9.12.1. Company overview
- 9.12.2. Key Executives
- 9.12.3. Company snapshot
- 9.12.4. Operating business segments
- 9.12.5. Product portfolio
- 9.12.6. Business performance
- 9.13. Pure Treats Inc.
- 9.13.1. Company overview
- 9.13.2. Key Executives
- 9.13.3. Company snapshot
- 9.13.4. Operating business segments
- 9.13.5. Product portfolio
- 9.14. Nulo Pet Food
- 9.14.1. Company overview
- 9.14.2. Key Executives
- 9.14.3. Company snapshot
- 9.14.4. Operating business segments
- 9.14.5. Product portfolio
- 9.15. Thai Union Group PCL.
- 9.15.1. Company overview
- 9.15.2. Key Executives
- 9.15.3. Company snapshot
- 9.15.4. Operating business segments
- 9.15.5. Product portfolio
- 9.15.6. Business performance
LIST OF TABLES
- TABLE 01. GLOBAL FUNCTIONAL PET TREAT MARKET, BY PET, 2021-2031 ($MILLION)
- TABLE 02. FUNCTIONAL PET TREAT MARKET FOR DOG, BY REGION, 2021-2031 ($MILLION)
- TABLE 03. FUNCTIONAL PET TREAT MARKET FOR CAT, BY REGION, 2021-2031 ($MILLION)
- TABLE 04. FUNCTIONAL PET TREAT MARKET FOR OTHERS, BY REGION, 2021-2031 ($MILLION)
- TABLE 05. GLOBAL FUNCTIONAL PET TREAT MARKET, BY APPLICATION, 2021-2031 ($MILLION)
- TABLE 06. FUNCTIONAL PET TREAT MARKET FOR BONE HEALTH, BY REGION, 2021-2031 ($MILLION)
- TABLE 07. FUNCTIONAL PET TREAT MARKET FOR BRAIN HEALTH, BY REGION, 2021-2031 ($MILLION)
- TABLE 08. FUNCTIONAL PET TREAT MARKET FOR OBESITY, BY REGION, 2021-2031 ($MILLION)
- TABLE 09. FUNCTIONAL PET TREAT MARKET FOR SKIN DISEASES, BY REGION, 2021-2031 ($MILLION)
- TABLE 10. FUNCTIONAL PET TREAT MARKET FOR OTHERS, BY REGION, 2021-2031 ($MILLION)
- TABLE 11. GLOBAL FUNCTIONAL PET TREAT MARKET, BY DISTRIBUTION CHANNEL, 2021-2031 ($MILLION)
- TABLE 12. FUNCTIONAL PET TREAT MARKET FOR PET STORES, BY REGION, 2021-2031 ($MILLION)
- TABLE 13. FUNCTIONAL PET TREAT MARKET FOR PHARMACIES, BY REGION, 2021-2031 ($MILLION)
- TABLE 14. FUNCTIONAL PET TREAT MARKET FOR VETERINARY CLINICS, BY REGION, 2021-2031 ($MILLION)
- TABLE 15. FUNCTIONAL PET TREAT MARKET FOR ONLINE STORES, BY REGION, 2021-2031 ($MILLION)
- TABLE 16. FUNCTIONAL PET TREAT MARKET FOR OTHERS, BY REGION, 2021-2031 ($MILLION)
- TABLE 17. FUNCTIONAL PET TREAT MARKET, BY REGION, 2021-2031 ($MILLION)
- TABLE 18. NORTH AMERICA FUNCTIONAL PET TREAT MARKET, BY PET, 2021-2031 ($MILLION)
- TABLE 19. NORTH AMERICA FUNCTIONAL PET TREAT MARKET, BY APPLICATION, 2021-2031 ($MILLION)
- TABLE 20. NORTH AMERICA FUNCTIONAL PET TREAT MARKET, BY DISTRIBUTION CHANNEL, 2021-2031 ($MILLION)
- TABLE 21. NORTH AMERICA FUNCTIONAL PET TREAT MARKET, BY COUNTRY, 2021-2031 ($MILLION)
- TABLE 22. U.S. FUNCTIONAL PET TREAT MARKET, BY PET, 2021-2031 ($MILLION)
- TABLE 23. U.S. FUNCTIONAL PET TREAT MARKET, BY APPLICATION, 2021-2031 ($MILLION)
- TABLE 24. U.S. FUNCTIONAL PET TREAT MARKET, BY DISTRIBUTION CHANNEL, 2021-2031 ($MILLION)
- TABLE 25. CANADA FUNCTIONAL PET TREAT MARKET, BY PET, 2021-2031 ($MILLION)
- TABLE 26. CANADA FUNCTIONAL PET TREAT MARKET, BY APPLICATION, 2021-2031 ($MILLION)
- TABLE 27. CANADA FUNCTIONAL PET TREAT MARKET, BY DISTRIBUTION CHANNEL, 2021-2031 ($MILLION)
- TABLE 28. MEXICO FUNCTIONAL PET TREAT MARKET, BY PET, 2021-2031 ($MILLION)
- TABLE 29. MEXICO FUNCTIONAL PET TREAT MARKET, BY APPLICATION, 2021-2031 ($MILLION)
- TABLE 30. MEXICO FUNCTIONAL PET TREAT MARKET, BY DISTRIBUTION CHANNEL, 2021-2031 ($MILLION)
- TABLE 31. EUROPE FUNCTIONAL PET TREAT MARKET, BY PET, 2021-2031 ($MILLION)
- TABLE 32. EUROPE FUNCTIONAL PET TREAT MARKET, BY APPLICATION, 2021-2031 ($MILLION)
- TABLE 33. EUROPE FUNCTIONAL PET TREAT MARKET, BY DISTRIBUTION CHANNEL, 2021-2031 ($MILLION)
- TABLE 34. EUROPE FUNCTIONAL PET TREAT MARKET, BY COUNTRY, 2021-2031 ($MILLION)
- TABLE 35. UK FUNCTIONAL PET TREAT MARKET, BY PET, 2021-2031 ($MILLION)
- TABLE 36. UK FUNCTIONAL PET TREAT MARKET, BY APPLICATION, 2021-2031 ($MILLION)
- TABLE 37. UK FUNCTIONAL PET TREAT MARKET, BY DISTRIBUTION CHANNEL, 2021-2031 ($MILLION)
- TABLE 38. FRANCE FUNCTIONAL PET TREAT MARKET, BY PET, 2021-2031 ($MILLION)
- TABLE 39. FRANCE FUNCTIONAL PET TREAT MARKET, BY APPLICATION, 2021-2031 ($MILLION)
- TABLE 40. FRANCE FUNCTIONAL PET TREAT MARKET, BY DISTRIBUTION CHANNEL, 2021-2031 ($MILLION)
- TABLE 41. GERMANY FUNCTIONAL PET TREAT MARKET, BY PET, 2021-2031 ($MILLION)
- TABLE 42. GERMANY FUNCTIONAL PET TREAT MARKET, BY APPLICATION, 2021-2031 ($MILLION)
- TABLE 43. GERMANY FUNCTIONAL PET TREAT MARKET, BY DISTRIBUTION CHANNEL, 2021-2031 ($MILLION)
- TABLE 44. RUSSIA FUNCTIONAL PET TREAT MARKET, BY PET, 2021-2031 ($MILLION)
- TABLE 45. RUSSIA FUNCTIONAL PET TREAT MARKET, BY APPLICATION, 2021-2031 ($MILLION)
- TABLE 46. RUSSIA FUNCTIONAL PET TREAT MARKET, BY DISTRIBUTION CHANNEL, 2021-2031 ($MILLION)
- TABLE 47. SPAIN FUNCTIONAL PET TREAT MARKET, BY PET, 2021-2031 ($MILLION)
- TABLE 48. SPAIN FUNCTIONAL PET TREAT MARKET, BY APPLICATION, 2021-2031 ($MILLION)
- TABLE 49. SPAIN FUNCTIONAL PET TREAT MARKET, BY DISTRIBUTION CHANNEL, 2021-2031 ($MILLION)
- TABLE 50. ITALY FUNCTIONAL PET TREAT MARKET, BY PET, 2021-2031 ($MILLION)
- TABLE 51. ITALY FUNCTIONAL PET TREAT MARKET, BY APPLICATION, 2021-2031 ($MILLION)
- TABLE 52. ITALY FUNCTIONAL PET TREAT MARKET, BY DISTRIBUTION CHANNEL, 2021-2031 ($MILLION)
- TABLE 53. REST OF EUROPE FUNCTIONAL PET TREAT MARKET, BY PET, 2021-2031 ($MILLION)
- TABLE 54. REST OF EUROPE FUNCTIONAL PET TREAT MARKET, BY APPLICATION, 2021-2031 ($MILLION)
- TABLE 55. REST OF EUROPE FUNCTIONAL PET TREAT MARKET, BY DISTRIBUTION CHANNEL, 2021-2031 ($MILLION)
- TABLE 56. ASIA-PACIFIC FUNCTIONAL PET TREAT MARKET, BY PET, 2021-2031 ($MILLION)
- TABLE 57. ASIA-PACIFIC FUNCTIONAL PET TREAT MARKET, BY APPLICATION, 2021-2031 ($MILLION)
- TABLE 58. ASIA-PACIFIC FUNCTIONAL PET TREAT MARKET, BY DISTRIBUTION CHANNEL, 2021-2031 ($MILLION)
- TABLE 59. ASIA-PACIFIC FUNCTIONAL PET TREAT MARKET, BY COUNTRY, 2021-2031 ($MILLION)
- TABLE 60. CHINA FUNCTIONAL PET TREAT MARKET, BY PET, 2021-2031 ($MILLION)
- TABLE 61. CHINA FUNCTIONAL PET TREAT MARKET, BY APPLICATION, 2021-2031 ($MILLION)
- TABLE 62. CHINA FUNCTIONAL PET TREAT MARKET, BY DISTRIBUTION CHANNEL, 2021-2031 ($MILLION)
- TABLE 63. JAPAN FUNCTIONAL PET TREAT MARKET, BY PET, 2021-2031 ($MILLION)
- TABLE 64. JAPAN FUNCTIONAL PET TREAT MARKET, BY APPLICATION, 2021-2031 ($MILLION)
- TABLE 65. JAPAN FUNCTIONAL PET TREAT MARKET, BY DISTRIBUTION CHANNEL, 2021-2031 ($MILLION)
- TABLE 66. INDIA FUNCTIONAL PET TREAT MARKET, BY PET, 2021-2031 ($MILLION)
- TABLE 67. INDIA FUNCTIONAL PET TREAT MARKET, BY APPLICATION, 2021-2031 ($MILLION)
- TABLE 68. INDIA FUNCTIONAL PET TREAT MARKET, BY DISTRIBUTION CHANNEL, 2021-2031 ($MILLION)
- TABLE 69. AUSTRALIA FUNCTIONAL PET TREAT MARKET, BY PET, 2021-2031 ($MILLION)
- TABLE 70. AUSTRALIA FUNCTIONAL PET TREAT MARKET, BY APPLICATION, 2021-2031 ($MILLION)
- TABLE 71. AUSTRALIA FUNCTIONAL PET TREAT MARKET, BY DISTRIBUTION CHANNEL, 2021-2031 ($MILLION)
- TABLE 72. REST OF ASIA-PACIFIC FUNCTIONAL PET TREAT MARKET, BY PET, 2021-2031 ($MILLION)
- TABLE 73. REST OF ASIA-PACIFIC FUNCTIONAL PET TREAT MARKET, BY APPLICATION, 2021-2031 ($MILLION)
- TABLE 74. REST OF ASIA-PACIFIC FUNCTIONAL PET TREAT MARKET, BY DISTRIBUTION CHANNEL, 2021-2031 ($MILLION)
- TABLE 75. LAMEA FUNCTIONAL PET TREAT MARKET, BY PET, 2021-2031 ($MILLION)
- TABLE 76. LAMEA FUNCTIONAL PET TREAT MARKET, BY APPLICATION, 2021-2031 ($MILLION)
- TABLE 77. LAMEA FUNCTIONAL PET TREAT MARKET, BY DISTRIBUTION CHANNEL, 2021-2031 ($MILLION)
- TABLE 78. LAMEA FUNCTIONAL PET TREAT MARKET, BY COUNTRY, 2021-2031 ($MILLION)
- TABLE 79. BRAZIL FUNCTIONAL PET TREAT MARKET, BY PET, 2021-2031 ($MILLION)
- TABLE 80. BRAZIL FUNCTIONAL PET TREAT MARKET, BY APPLICATION, 2021-2031 ($MILLION)
- TABLE 81. BRAZIL FUNCTIONAL PET TREAT MARKET, BY DISTRIBUTION CHANNEL, 2021-2031 ($MILLION)
- TABLE 82. ARGENTINA FUNCTIONAL PET TREAT MARKET, BY PET, 2021-2031 ($MILLION)
- TABLE 83. ARGENTINA FUNCTIONAL PET TREAT MARKET, BY APPLICATION, 2021-2031 ($MILLION)
- TABLE 84. ARGENTINA FUNCTIONAL PET TREAT MARKET, BY DISTRIBUTION CHANNEL, 2021-2031 ($MILLION)
- TABLE 85. SAUDI ARABIA FUNCTIONAL PET TREAT MARKET, BY PET, 2021-2031 ($MILLION)
- TABLE 86. SAUDI ARABIA FUNCTIONAL PET TREAT MARKET, BY APPLICATION, 2021-2031 ($MILLION)
- TABLE 87. SAUDI ARABIA FUNCTIONAL PET TREAT MARKET, BY DISTRIBUTION CHANNEL, 2021-2031 ($MILLION)
- TABLE 88. SOUTH AFRICA FUNCTIONAL PET TREAT MARKET, BY PET, 2021-2031 ($MILLION)
- TABLE 89. SOUTH AFRICA FUNCTIONAL PET TREAT MARKET, BY APPLICATION, 2021-2031 ($MILLION)
- TABLE 90. SOUTH AFRICA FUNCTIONAL PET TREAT MARKET, BY DISTRIBUTION CHANNEL, 2021-2031 ($MILLION)
- TABLE 91. REST OF LAMEA FUNCTIONAL PET TREAT MARKET, BY PET, 2021-2031 ($MILLION)
- TABLE 92. REST OF LAMEA FUNCTIONAL PET TREAT MARKET, BY APPLICATION, 2021-2031 ($MILLION)
- TABLE 93. REST OF LAMEA FUNCTIONAL PET TREAT MARKET, BY DISTRIBUTION CHANNEL, 2021-2031 ($MILLION)
- TABLE 94. NESTLE S.A.: KEY EXECUTIVES
- TABLE 95. NESTLE S.A.: COMPANY SNAPSHOT
- TABLE 96. NESTLE S.A.: PRODUCT SEGMENTS
- TABLE 97. NESTLE S.A.: PRODUCT PORTFOLIO
- TABLE 98. NESTLE S.A.: KEY STRATERGIES
- TABLE 99. MARS, INCORPORATED: KEY EXECUTIVES
- TABLE 100. MARS, INCORPORATED: COMPANY SNAPSHOT
- TABLE 101. MARS, INCORPORATED: PRODUCT SEGMENTS
- TABLE 102. MARS, INCORPORATED: PRODUCT PORTFOLIO
- TABLE 103. MARS, INCORPORATED: KEY STRATERGIES
- TABLE 104. GENERAL MILLS INC.: KEY EXECUTIVES
- TABLE 105. GENERAL MILLS INC.: COMPANY SNAPSHOT
- TABLE 106. GENERAL MILLS INC.: PRODUCT SEGMENTS
- TABLE 107. GENERAL MILLS INC.: SERVICE SEGMENTS
- TABLE 108. GENERAL MILLS INC.: PRODUCT PORTFOLIO
- TABLE 109. GENERAL MILLS INC.: KEY STRATERGIES
- TABLE 110. REAL PET FOOD COMPANY PTY. LTD.: KEY EXECUTIVES
- TABLE 111. REAL PET FOOD COMPANY PTY. LTD.: COMPANY SNAPSHOT
- TABLE 112. REAL PET FOOD COMPANY PTY. LTD.: PRODUCT SEGMENTS
- TABLE 113. REAL PET FOOD COMPANY PTY. LTD.: PRODUCT PORTFOLIO
- TABLE 114. REAL PET FOOD COMPANY PTY. LTD.: KEY STRATERGIES
- TABLE 115. NATURAL BALANCE PET FOODS, INC.: KEY EXECUTIVES
- TABLE 116. NATURAL BALANCE PET FOODS, INC.: COMPANY SNAPSHOT
- TABLE 117. NATURAL BALANCE PET FOODS, INC.: PRODUCT SEGMENTS
- TABLE 118. NATURAL BALANCE PET FOODS, INC.: PRODUCT PORTFOLIO
- TABLE 119. WELLNESS PET COMPANY, INC.: KEY EXECUTIVES
- TABLE 120. WELLNESS PET COMPANY, INC.: COMPANY SNAPSHOT
- TABLE 121. WELLNESS PET COMPANY, INC.: PRODUCT SEGMENTS
- TABLE 122. WELLNESS PET COMPANY, INC.: PRODUCT PORTFOLIO
- TABLE 123. SUNSHINE MILLS INC.: KEY EXECUTIVES
- TABLE 124. SUNSHINE MILLS INC.: COMPANY SNAPSHOT
- TABLE 125. SUNSHINE MILLS INC.: PRODUCT SEGMENTS
- TABLE 126. SUNSHINE MILLS INC.: PRODUCT PORTFOLIO
- TABLE 127. COLGATE-PALMOLIVE COMPANY: KEY EXECUTIVES
- TABLE 128. COLGATE-PALMOLIVE COMPANY: COMPANY SNAPSHOT
- TABLE 129. COLGATE-PALMOLIVE COMPANY: PRODUCT SEGMENTS
- TABLE 130. COLGATE-PALMOLIVE COMPANY: PRODUCT PORTFOLIO
- TABLE 131. PLATO PET TREATS: KEY EXECUTIVES
- TABLE 132. PLATO PET TREATS: COMPANY SNAPSHOT
- TABLE 133. PLATO PET TREATS: PRODUCT SEGMENTS
- TABLE 134. PLATO PET TREATS: PRODUCT PORTFOLIO
- TABLE 135. PLATO PET TREATS: KEY STRATERGIES
- TABLE 136. THE J.M. SMUCKER CO.: KEY EXECUTIVES
- TABLE 137. THE J.M. SMUCKER CO.: COMPANY SNAPSHOT
- TABLE 138. THE J.M. SMUCKER CO.: PRODUCT SEGMENTS
- TABLE 139. THE J.M. SMUCKER CO.: PRODUCT PORTFOLIO
- TABLE 140. BETTER CHOICE COMPANY INC.: KEY EXECUTIVES
- TABLE 141. BETTER CHOICE COMPANY INC.: COMPANY SNAPSHOT
- TABLE 142. BETTER CHOICE COMPANY INC.: PRODUCT SEGMENTS
- TABLE 143. BETTER CHOICE COMPANY INC.: PRODUCT PORTFOLIO
- TABLE 144. BETTER CHOICE COMPANY INC.: KEY STRATERGIES
- TABLE 145. CHAROEN POKPHAND FOODS PLC.: KEY EXECUTIVES
- TABLE 146. CHAROEN POKPHAND FOODS PLC.: COMPANY SNAPSHOT
- TABLE 147. CHAROEN POKPHAND FOODS PLC.: PRODUCT SEGMENTS
- TABLE 148. CHAROEN POKPHAND FOODS PLC.: PRODUCT PORTFOLIO
- TABLE 149. PURE TREATS INC.: KEY EXECUTIVES
- TABLE 150. PURE TREATS INC.: COMPANY SNAPSHOT
- TABLE 151. PURE TREATS INC.: PRODUCT SEGMENTS
- TABLE 152. PURE TREATS INC.: PRODUCT PORTFOLIO
- TABLE 153. NULO PET FOOD: KEY EXECUTIVES
- TABLE 154. NULO PET FOOD: COMPANY SNAPSHOT
- TABLE 155. NULO PET FOOD: PRODUCT SEGMENTS
- TABLE 156. NULO PET FOOD: PRODUCT PORTFOLIO
- TABLE 157. THAI UNION GROUP PCL.: KEY EXECUTIVES
- TABLE 158. THAI UNION GROUP PCL.: COMPANY SNAPSHOT
- TABLE 159. THAI UNION GROUP PCL.: PRODUCT SEGMENTS
- TABLE 160. THAI UNION GROUP PCL.: PRODUCT PORTFOLIO
LIST OF FIGURES
- FIGURE 01. FUNCTIONAL PET TREAT MARKET, 2021-2031
- FIGURE 02. SEGMENTATION OF FUNCTIONAL PET TREAT MARKET, 2021-2031
- FIGURE 03. TOP INVESTMENT POCKETS IN FUNCTIONAL PET TREAT MARKET (2022-2031)
- FIGURE 04. LOW BARGAINING POWER OF SUPPLIERS
- FIGURE 05. LOW BARGAINING POWER OF BUYERS
- FIGURE 06. LOW THREAT OF SUBSTITUTES
- FIGURE 07. LOW THREAT OF NEW ENTRANTS
- FIGURE 08. LOW INTENSITY OF RIVALRY
- FIGURE 09. DRIVERS, RESTRAINTS AND OPPORTUNITIES: GLOBALFUNCTIONAL PET TREAT MARKET
- FIGURE 10. MARKET SHARE ANALYSIS: FUNCTIONAL PET TREAT MARKET
- FIGURE 11. FUNCTIONAL PET TREAT MARKET, BY PET, 2021(%)
- FIGURE 12. COMPARATIVE SHARE ANALYSIS OF FUNCTIONAL PET TREAT MARKET FOR DOG, BY COUNTRY 2021 AND 2031(%)
- FIGURE 13. COMPARATIVE SHARE ANALYSIS OF FUNCTIONAL PET TREAT MARKET FOR CAT, BY COUNTRY 2021 AND 2031(%)
- FIGURE 14. COMPARATIVE SHARE ANALYSIS OF FUNCTIONAL PET TREAT MARKET FOR OTHERS, BY COUNTRY 2021 AND 2031(%)
- FIGURE 15. FUNCTIONAL PET TREAT MARKET, BY APPLICATION, 2021(%)
- FIGURE 16. COMPARATIVE SHARE ANALYSIS OF FUNCTIONAL PET TREAT MARKET FOR BONE HEALTH, BY COUNTRY 2021 AND 2031(%)
- FIGURE 17. COMPARATIVE SHARE ANALYSIS OF FUNCTIONAL PET TREAT MARKET FOR BRAIN HEALTH, BY COUNTRY 2021 AND 2031(%)
- FIGURE 18. COMPARATIVE SHARE ANALYSIS OF FUNCTIONAL PET TREAT MARKET FOR OBESITY, BY COUNTRY 2021 AND 2031(%)
- FIGURE 19. COMPARATIVE SHARE ANALYSIS OF FUNCTIONAL PET TREAT MARKET FOR SKIN DISEASES, BY COUNTRY 2021 AND 2031(%)
- FIGURE 20. COMPARATIVE SHARE ANALYSIS OF FUNCTIONAL PET TREAT MARKET FOR OTHERS, BY COUNTRY 2021 AND 2031(%)
- FIGURE 21. FUNCTIONAL PET TREAT MARKET, BY DISTRIBUTION CHANNEL, 2021(%)
- FIGURE 22. COMPARATIVE SHARE ANALYSIS OF FUNCTIONAL PET TREAT MARKET FOR PET STORES, BY COUNTRY 2021 AND 2031(%)
- FIGURE 23. COMPARATIVE SHARE ANALYSIS OF FUNCTIONAL PET TREAT MARKET FOR PHARMACIES, BY COUNTRY 2021 AND 2031(%)
- FIGURE 24. COMPARATIVE SHARE ANALYSIS OF FUNCTIONAL PET TREAT MARKET FOR VETERINARY CLINICS, BY COUNTRY 2021 AND 2031(%)
- FIGURE 25. COMPARATIVE SHARE ANALYSIS OF FUNCTIONAL PET TREAT MARKET FOR ONLINE STORES, BY COUNTRY 2021 AND 2031(%)
- FIGURE 26. COMPARATIVE SHARE ANALYSIS OF FUNCTIONAL PET TREAT MARKET FOR OTHERS, BY COUNTRY 2021 AND 2031(%)
- FIGURE 27. FUNCTIONAL PET TREAT MARKET BY REGION, 2021
- FIGURE 28. U.S. FUNCTIONAL PET TREAT MARKET, 2021-2031 ($MILLION)
- FIGURE 29. CANADA FUNCTIONAL PET TREAT MARKET, 2021-2031 ($MILLION)
- FIGURE 30. MEXICO FUNCTIONAL PET TREAT MARKET, 2021-2031 ($MILLION)
- FIGURE 31. UK FUNCTIONAL PET TREAT MARKET, 2021-2031 ($MILLION)
- FIGURE 32. FRANCE FUNCTIONAL PET TREAT MARKET, 2021-2031 ($MILLION)
- FIGURE 33. GERMANY FUNCTIONAL PET TREAT MARKET, 2021-2031 ($MILLION)
- FIGURE 34. RUSSIA FUNCTIONAL PET TREAT MARKET, 2021-2031 ($MILLION)
- FIGURE 35. SPAIN FUNCTIONAL PET TREAT MARKET, 2021-2031 ($MILLION)
- FIGURE 36. ITALY FUNCTIONAL PET TREAT MARKET, 2021-2031 ($MILLION)
- FIGURE 37. REST OF EUROPE FUNCTIONAL PET TREAT MARKET, 2021-2031 ($MILLION)
- FIGURE 38. CHINA FUNCTIONAL PET TREAT MARKET, 2021-2031 ($MILLION)
- FIGURE 39. JAPAN FUNCTIONAL PET TREAT MARKET, 2021-2031 ($MILLION)
- FIGURE 40. INDIA FUNCTIONAL PET TREAT MARKET, 2021-2031 ($MILLION)
- FIGURE 41. AUSTRALIA FUNCTIONAL PET TREAT MARKET, 2021-2031 ($MILLION)
- FIGURE 42. REST OF ASIA-PACIFIC FUNCTIONAL PET TREAT MARKET, 2021-2031 ($MILLION)
- FIGURE 43. BRAZIL FUNCTIONAL PET TREAT MARKET, 2021-2031 ($MILLION)
- FIGURE 44. ARGENTINA FUNCTIONAL PET TREAT MARKET, 2021-2031 ($MILLION)
- FIGURE 45. SAUDI ARABIA FUNCTIONAL PET TREAT MARKET, 2021-2031 ($MILLION)
- FIGURE 46. SOUTH AFRICA FUNCTIONAL PET TREAT MARKET, 2021-2031 ($MILLION)
- FIGURE 47. REST OF LAMEA FUNCTIONAL PET TREAT MARKET, 2021-2031 ($MILLION)
- FIGURE 48. TOP WINNING STRATEGIES, BY YEAR
- FIGURE 49. TOP WINNING STRATEGIES, BY DEVELOPMENT
- FIGURE 50. TOP WINNING STRATEGIES, BY COMPANY
- FIGURE 51. PRODUCT MAPPING OF TOP 10 PLAYERS
- FIGURE 52. COMPETITIVE DASHBOARD
- FIGURE 53. COMPETITIVE HEATMAP: FUNCTIONAL PET TREAT MARKET
- FIGURE 54. TOP PLAYER POSITIONING, 2021
- FIGURE 55. NESTLE S.A.: NET REVENUE, 2020-2022 ($MILLION)
- FIGURE 56. NESTLE S.A.: RESEARCH & DEVELOPMENT EXPENDITURE, 2020-2022 ($MILLION)
- FIGURE 57. NESTLE S.A.: REVENUE SHARE BY SEGMENT, 2022 (%)
- FIGURE 58. NESTLE S.A.: REVENUE SHARE BY REGION, 2022 (%)
- FIGURE 59. GENERAL MILLS INC.: NET REVENUE, 2019-2021 ($MILLION)
- FIGURE 60. GENERAL MILLS INC.: RESEARCH & DEVELOPMENT EXPENDITURE, 2019-2021 ($MILLION)
- FIGURE 61. GENERAL MILLS INC.: REVENUE SHARE BY SEGMENT, 2021 (%)
- FIGURE 62. GENERAL MILLS INC.: REVENUE SHARE BY REGION, 2021 (%)
- FIGURE 63. COLGATE-PALMOLIVE COMPANY: NET REVENUE, 2020-2022 ($MILLION)
- FIGURE 64. COLGATE-PALMOLIVE COMPANY: RESEARCH & DEVELOPMENT EXPENDITURE, 2020-2022 ($MILLION)
- FIGURE 65. COLGATE-PALMOLIVE COMPANY: REVENUE SHARE BY SEGMENT, 2022 (%)
- FIGURE 66. THE J.M. SMUCKER CO.: NET SALES, 2020-2022 ($MILLION)
- FIGURE 67. THE J.M. SMUCKER CO.: RESEARCH & DEVELOPMENT EXPENDITURE, 2020-2022
- FIGURE 68. THE J.M. SMUCKER CO.: REVENUE SHARE BY SEGMENT, 2022 (%)
- FIGURE 69. THE J.M. SMUCKER CO.: REVENUE SHARE BY REGION, 2022 (%)
- FIGURE 70. BETTER CHOICE COMPANY INC.: NET SALES, 2020-2022 ($MILLION)
- FIGURE 71. CHAROEN POKPHAND FOODS PLC.: NET REVENUE, 2019-2021 ($MILLION)
- FIGURE 72. THAI UNION GROUP PCL.: NET REVENUE, 2019-2021 ($MILLION)
- FIGURE 73. THAI UNION GROUP PCL.: RESEARCH & DEVELOPMENT EXPENDITURE, 2019-2021
- FIGURE 74. THAI UNION GROUP PCL.: REVENUE SHARE BY SEGMENT, 2021 (%)
- FIGURE 75. THAI UNION GROUP PCL.: REVENUE SHARE BY REGION, 2021 (%)

