
PUBLISHER: Allied Market Research | PRODUCT CODE: 1344453

PUBLISHER: Allied Market Research | PRODUCT CODE: 1344453
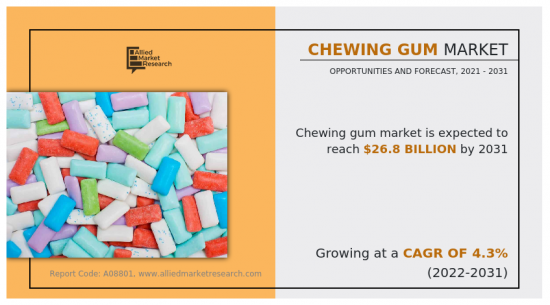
Chewing gum Market By Type, By Form, By Distribution Channel : Global Opportunity Analysis and Industry Forecast, 2022-2031
According to a new report published by Allied Market Research, titled, "Chewing gum Market," The chewing gum market was valued at $16.1 billion in 2021, and is estimated to reach $26.8 billion by 2031, growing at a CAGR of 4.3% from 2022 to 2031.
Since ancient times, chewing gum has been used around the globe to refresh breath and is one of the most popular varieties of confectionery among customers. The child population contributes a major share of the global consumption of chewing gum, hence its fueling the market growth for chewing gums. While the other key factors for the market growth include innovation, processing, and packaging. Factors such as customer health awareness, consciousness, and varying consumer eating habits and tastes drive innovation. In addition, consumers are interested in trying out new flavors of chewing gums, and therefore chewing gum manufacturers are introducing new chewing variants by integrating useful ingredients, organic herbal fillings, tropical fruit, and exotic flavors in product formulations. Innovative packaging tactics, such as appealing jars, family-sized packs, resealable packaging, and advertising increases product sales and raises awareness.
Following the arrival of the COVID-19 pandemic in 2020, there has been a significant consumer shift toward veganism, with a 500% increase in veganism discovered when compared to 2014. Veganism is practiced by up to 6% of the US population, up from 1% in 2014. Furthermore, over 500,000 people signed up for the vegan challenge in 2021, which is 25% more than the challenge in 2020. There will only be 400,000 participants in 2020. Moreover, retail sales of plant-based confectionery in the U.S. have increased at a promising rate over the last three years. This demonstrates that the consumer shift toward plant-based or vegan products is increasing and will continue to be positive in the future. As a result, demand for vegan chewing gum is expected to grow in the upcoming years, as both vegan and non-vegan population are interested in experiencing the taste of vegan or plant-based confectionery, which is projected to propel the market growth. Furthermore, key players are entering the vegan market and introducing vegan products. For instance, Veganie introduced a new line of vegan chewing gum in 2021 to cater to the growing vegan population.
Expansion of sales channels is the major factor that contributes toward the growth of the chewing gum market, and the online retail platform is one among them and is also the fastest-growing segment. Presently, many retail players are managing their web-based retail stores where customers can learn more about organizations and their products. The availability of multiple options of product and their price comparison on online platforms is also resulting in an increase in the number of online shopping by consumers. This is beneficial to key players as it is eliminating the need for any physical outlets or stores and is also helping the customers to read reviews provided by other users, and compare various stores, and products as well as the price of different sellers for different variants of chewing gum.
Furthermore, as per the data of the World Bank, in the year 2020, North America is the leader with approximately 88.4% of the population being internet users, followed by Europe and Central Asia, accounting for around 83.9% of the population as internet users. Some of the popular online retailers in the chewing gum market are Amazon.com and Flipkart.com. Furthermore, besides only sales channels, product availability is rising even in convenience stores and local shops in small regions, which propels the market growth.
The chewing gum market is segmented into type, form, distribution channel, and region. By type, the market is classified into sugared chewing gum and sugar-free chewing gum. By form, the market is categorized into sticks/tabs, pellets/pillows, liquid filled gum, and others. By distribution channel, the market is divided into supermarkets/hypermarkets, specialty stores, convenience stores, e-commerce, and others. Region-wise, the market is analyzed across North America (the U.S., Canada, and Mexico), Europe (UK, Germany, France, Italy, Spain, and the rest of Europe), Asia-Pacific (China, Japan, India, South Korea, Australia, and rest of Asia-Pacific), and LAMEA (Brazil, South Africa, Saudi Arabia, Turkey, and rest of LAMEA).
Players operating in the global chewing gum market have adopted various developmental strategies to expand their chewing gum market share, increase profitability, and remain competitive in the market. Key players profiled in the report include Arcor Group, Cloetta AB, Ferndale Confectionery Pty Ltd, Ferrero Group, Gumlink Confectionery Company A/S, Grenades Gum, LLC, HARIBO GmbH & Co. KG, Lotte Corporation, Mars, Incorporated., Meiji Holdings Co., Ltd., Mondelez International, Inc., Perfetti Van Melle, The Hershey Company, Tootsie Roll Inc., and Yıldız Holding.
Key Benefits For Stakeholders
- This report provides a quantitative analysis of the market segments, current trends, estimations, and dynamics of the chewing gum market analysis from 2021 to 2031 to identify the prevailing chewing gum market opportunities.
- The market research is offered along with information related to key drivers, restraints, and opportunities.
- Porter's five forces analysis highlights the potency of buyers and suppliers to enable stakeholders make profit-oriented business decisions and strengthen their supplier-buyer network.
- In-depth analysis of the chewing gum market segmentation assists to determine the prevailing market opportunities.
- Major countries in each region are mapped according to their revenue contribution to the global market.
- Market player positioning facilitates benchmarking and provides a clear understanding of the present position of the market players.
- The report includes the analysis of the regional as well as global chewing gum market trends, key players, market segments, application areas, and market growth strategies.
Key Market Segments
By Form
- Sticks/tabs
- Pellets/pillows
- Liquid Filled Gum
- Others
By Type
- Sugared Chewing Gum
- Sub-type
- Unflavored
- Flavored
- Sugar-free Chewing Gum
- Sub-type
- Unflavored
- Flavored
By Distribution Channel
- Supermarkets/hypermarkets
- Specialty Stores
- E-commerce
- Others
- Convenience Stores
By Region
- North America
- U.S.
- Canada
- Mexico
- Europe
- UK
- Germany
- France
- Italy
- Spain
- Rest of Europe
- Asia-Pacific
- China
- Japan
- India
- South Korea
- Australia
- Rest of Asia-Pacific
- LAMEA
- Brazil
- South Africa,
- Saudi Arabia
- Turkey
- Rest of LAMEA
Key Market Players:
- Grenades Gum, LLC
- Cloetta AB
- The Hershey Company
- Mondelez International, Inc.
- Arcor Group
- Ferrero International S.A.
- Gumlink Confectionery Company A/S
- Perfetti Van Melle Group B.V.
- Y?ld?z Holding A/S
- HARIBO GmbH & Co. KG
- Ferndale Confectionery Pty Ltd
- Mars, Incorporated
- Lotte Corporation
- Tootsie Roll Industries, Inc.
- Meiji Holdings Co., Ltd.
TABLE OF CONTENTS
CHAPTER 1: INTRODUCTION
- 1.1. Report description
- 1.2. Key market segments
- 1.3. Key benefits to the stakeholders
- 1.4. Research Methodology
- 1.4.1. Primary research
- 1.4.2. Secondary research
- 1.4.3. Analyst tools and models
CHAPTER 2: EXECUTIVE SUMMARY
- 2.1. CXO Perspective
CHAPTER 3: MARKET OVERVIEW
- 3.1. Market definition and scope
- 3.2. Key findings
- 3.2.1. Top impacting factors
- 3.2.2. Top investment pockets
- 3.3. Porter's five forces analysis
- 3.3.1. Bargaining power of suppliers
- 3.3.2. Bargaining power of buyers
- 3.3.3. Threat of substitutes
- 3.3.4. Threat of new entrants
- 3.3.5. Intensity of rivalry
- 3.4. Market dynamics
- 3.4.1. Drivers
- 3.4.1.1. Innovation in packaging and promotion
- 3.4.1.2. Health benefits associated with chewing gum
- 3.4.1. Drivers
- 3.4.2. Restraints
- 3.4.2.1. Chewing gum causes plastic pollution
- 3.4.2.2. Surge in prevalence of obesity and other diseases
- 3.4.3. Opportunities
- 3.4.3.1. Expanding sales channel is offering growth impetus to the market
- 3.5. COVID-19 Impact Analysis on the market
- 3.6. Company Share Analysis
- 3.7. Market Share Analysis
- 3.8. Parent Market Analysis
- 3.9. Pricing Analysis
- 3.10. Value Chain Analysis
CHAPTER 4: CHEWING GUM MARKET, BY TYPE
- 4.1. Overview
- 4.1.1. Market size and forecast
- 4.2. Sugared Chewing Gum
- 4.2.1. Key market trends, growth factors and opportunities
- 4.2.2. Market size and forecast, by region
- 4.2.3. Market share analysis by country
- 4.2.4. Sugared Chewing Gum Chewing gum Market by Sub-type
- 4.2.4.1. Unflavored Market size and forecast, by region
- 4.2.4.2. Flavored Market size and forecast, by region
- 4.3. Sugar-free Chewing Gum
- 4.3.1. Key market trends, growth factors and opportunities
- 4.3.2. Market size and forecast, by region
- 4.3.3. Market share analysis by country
- 4.3.4. Sugar-free Chewing Gum Chewing gum Market by Sub-type
- 4.3.4.1. Unflavored Market size and forecast, by region
- 4.3.4.2. Flavored Market size and forecast, by region
CHAPTER 5: CHEWING GUM MARKET, BY FORM
- 5.1. Overview
- 5.1.1. Market size and forecast
- 5.2. Sticks/tabs
- 5.2.1. Key market trends, growth factors and opportunities
- 5.2.2. Market size and forecast, by region
- 5.2.3. Market share analysis by country
- 5.3. Pellets/pillows
- 5.3.1. Key market trends, growth factors and opportunities
- 5.3.2. Market size and forecast, by region
- 5.3.3. Market share analysis by country
- 5.4. Liquid Filled Gum
- 5.4.1. Key market trends, growth factors and opportunities
- 5.4.2. Market size and forecast, by region
- 5.4.3. Market share analysis by country
- 5.5. Others
- 5.5.1. Key market trends, growth factors and opportunities
- 5.5.2. Market size and forecast, by region
- 5.5.3. Market share analysis by country
CHAPTER 6: CHEWING GUM MARKET, BY DISTRIBUTION CHANNEL
- 6.1. Overview
- 6.1.1. Market size and forecast
- 6.2. Supermarkets/hypermarkets
- 6.2.1. Key market trends, growth factors and opportunities
- 6.2.2. Market size and forecast, by region
- 6.2.3. Market share analysis by country
- 6.3. Specialty Stores
- 6.3.1. Key market trends, growth factors and opportunities
- 6.3.2. Market size and forecast, by region
- 6.3.3. Market share analysis by country
- 6.4. Convenience Stores
- 6.4.1. Key market trends, growth factors and opportunities
- 6.4.2. Market size and forecast, by region
- 6.4.3. Market share analysis by country
- 6.5. E-commerce
- 6.5.1. Key market trends, growth factors and opportunities
- 6.5.2. Market size and forecast, by region
- 6.5.3. Market share analysis by country
- 6.6. Others
- 6.6.1. Key market trends, growth factors and opportunities
- 6.6.2. Market size and forecast, by region
- 6.6.3. Market share analysis by country
CHAPTER 7: CHEWING GUM MARKET, BY REGION
- 7.1. Overview
- 7.1.1. Market size and forecast By Region
- 7.2. North America
- 7.2.1. Key trends and opportunities
- 7.2.2. Market size and forecast, by Type
- 7.2.2.1. North America Sugared Chewing Gum Chewing gum Market by Sub-type
- 7.2.2.2. North America Sugar-free Chewing Gum Chewing gum Market by Sub-type
- 7.2.3. Market size and forecast, by Form
- 7.2.4. Market size and forecast, by Distribution Channel
- 7.2.5. Market size and forecast, by country
- 7.2.5.1. U.S.
- 7.2.5.1.1. Key market trends, growth factors and opportunities
- 7.2.5.1.2. Market size and forecast, by Type
- 7.2.5.1.3. Market size and forecast, by Form
- 7.2.5.1.4. Market size and forecast, by Distribution Channel
- 7.2.5.2. Canada
- 7.2.5.2.1. Key market trends, growth factors and opportunities
- 7.2.5.2.2. Market size and forecast, by Type
- 7.2.5.2.3. Market size and forecast, by Form
- 7.2.5.2.4. Market size and forecast, by Distribution Channel
- 7.2.5.3. Mexico
- 7.2.5.3.1. Key market trends, growth factors and opportunities
- 7.2.5.3.2. Market size and forecast, by Type
- 7.2.5.3.3. Market size and forecast, by Form
- 7.2.5.3.4. Market size and forecast, by Distribution Channel
- 7.3. Europe
- 7.3.1. Key trends and opportunities
- 7.3.2. Market size and forecast, by Type
- 7.3.2.1. Europe Sugared Chewing Gum Chewing gum Market by Sub-type
- 7.3.2.2. Europe Sugar-free Chewing Gum Chewing gum Market by Sub-type
- 7.3.3. Market size and forecast, by Form
- 7.3.4. Market size and forecast, by Distribution Channel
- 7.3.5. Market size and forecast, by country
- 7.3.5.1. UK
- 7.3.5.1.1. Key market trends, growth factors and opportunities
- 7.3.5.1.2. Market size and forecast, by Type
- 7.3.5.1.3. Market size and forecast, by Form
- 7.3.5.1.4. Market size and forecast, by Distribution Channel
- 7.3.5.2. Germany
- 7.3.5.2.1. Key market trends, growth factors and opportunities
- 7.3.5.2.2. Market size and forecast, by Type
- 7.3.5.2.3. Market size and forecast, by Form
- 7.3.5.2.4. Market size and forecast, by Distribution Channel
- 7.3.5.3. France
- 7.3.5.3.1. Key market trends, growth factors and opportunities
- 7.3.5.3.2. Market size and forecast, by Type
- 7.3.5.3.3. Market size and forecast, by Form
- 7.3.5.3.4. Market size and forecast, by Distribution Channel
- 7.3.5.4. Italy
- 7.3.5.4.1. Key market trends, growth factors and opportunities
- 7.3.5.4.2. Market size and forecast, by Type
- 7.3.5.4.3. Market size and forecast, by Form
- 7.3.5.4.4. Market size and forecast, by Distribution Channel
- 7.3.5.5. Spain
- 7.3.5.5.1. Key market trends, growth factors and opportunities
- 7.3.5.5.2. Market size and forecast, by Type
- 7.3.5.5.3. Market size and forecast, by Form
- 7.3.5.5.4. Market size and forecast, by Distribution Channel
- 7.3.5.6. Rest of Europe
- 7.3.5.6.1. Key market trends, growth factors and opportunities
- 7.3.5.6.2. Market size and forecast, by Type
- 7.3.5.6.3. Market size and forecast, by Form
- 7.3.5.6.4. Market size and forecast, by Distribution Channel
- 7.4. Asia-Pacific
- 7.4.1. Key trends and opportunities
- 7.4.2. Market size and forecast, by Type
- 7.4.2.1. Asia-Pacific Sugared Chewing Gum Chewing gum Market by Sub-type
- 7.4.2.2. Asia-Pacific Sugar-free Chewing Gum Chewing gum Market by Sub-type
- 7.4.3. Market size and forecast, by Form
- 7.4.4. Market size and forecast, by Distribution Channel
- 7.4.5. Market size and forecast, by country
- 7.4.5.1. China
- 7.4.5.1.1. Key market trends, growth factors and opportunities
- 7.4.5.1.2. Market size and forecast, by Type
- 7.4.5.1.3. Market size and forecast, by Form
- 7.4.5.1.4. Market size and forecast, by Distribution Channel
- 7.4.5.2. Japan
- 7.4.5.2.1. Key market trends, growth factors and opportunities
- 7.4.5.2.2. Market size and forecast, by Type
- 7.4.5.2.3. Market size and forecast, by Form
- 7.4.5.2.4. Market size and forecast, by Distribution Channel
- 7.4.5.3. India
- 7.4.5.3.1. Key market trends, growth factors and opportunities
- 7.4.5.3.2. Market size and forecast, by Type
- 7.4.5.3.3. Market size and forecast, by Form
- 7.4.5.3.4. Market size and forecast, by Distribution Channel
- 7.4.5.4. South Korea
- 7.4.5.4.1. Key market trends, growth factors and opportunities
- 7.4.5.4.2. Market size and forecast, by Type
- 7.4.5.4.3. Market size and forecast, by Form
- 7.4.5.4.4. Market size and forecast, by Distribution Channel
- 7.4.5.5. Australia
- 7.4.5.5.1. Key market trends, growth factors and opportunities
- 7.4.5.5.2. Market size and forecast, by Type
- 7.4.5.5.3. Market size and forecast, by Form
- 7.4.5.5.4. Market size and forecast, by Distribution Channel
- 7.4.5.6. Rest of Asia-Pacific
- 7.4.5.6.1. Key market trends, growth factors and opportunities
- 7.4.5.6.2. Market size and forecast, by Type
- 7.4.5.6.3. Market size and forecast, by Form
- 7.4.5.6.4. Market size and forecast, by Distribution Channel
- 7.5. LAMEA
- 7.5.1. Key trends and opportunities
- 7.5.2. Market size and forecast, by Type
- 7.5.2.1. LAMEA Sugared Chewing Gum Chewing gum Market by Sub-type
- 7.5.2.2. LAMEA Sugar-free Chewing Gum Chewing gum Market by Sub-type
- 7.5.3. Market size and forecast, by Form
- 7.5.4. Market size and forecast, by Distribution Channel
- 7.5.5. Market size and forecast, by country
- 7.5.5.1. Brazil
- 7.5.5.1.1. Key market trends, growth factors and opportunities
- 7.5.5.1.2. Market size and forecast, by Type
- 7.5.5.1.3. Market size and forecast, by Form
- 7.5.5.1.4. Market size and forecast, by Distribution Channel
- 7.5.5.2. South Africa,
- 7.5.5.2.1. Key market trends, growth factors and opportunities
- 7.5.5.2.2. Market size and forecast, by Type
- 7.5.5.2.3. Market size and forecast, by Form
- 7.5.5.2.4. Market size and forecast, by Distribution Channel
- 7.5.5.3. Saudi Arabia
- 7.5.5.3.1. Key market trends, growth factors and opportunities
- 7.5.5.3.2. Market size and forecast, by Type
- 7.5.5.3.3. Market size and forecast, by Form
- 7.5.5.3.4. Market size and forecast, by Distribution Channel
- 7.5.5.4. Turkey
- 7.5.5.4.1. Key market trends, growth factors and opportunities
- 7.5.5.4.2. Market size and forecast, by Type
- 7.5.5.4.3. Market size and forecast, by Form
- 7.5.5.4.4. Market size and forecast, by Distribution Channel
- 7.5.5.5. Rest of LAMEA
- 7.5.5.5.1. Key market trends, growth factors and opportunities
- 7.5.5.5.2. Market size and forecast, by Type
- 7.5.5.5.3. Market size and forecast, by Form
- 7.5.5.5.4. Market size and forecast, by Distribution Channel
CHAPTER 8: COMPETITIVE LANDSCAPE
- 8.1. Introduction
- 8.2. Top winning strategies
- 8.3. Product Mapping of Top 10 Player
- 8.4. Competitive Dashboard
- 8.5. Competitive Heatmap
- 8.6. Top player positioning, 2021
CHAPTER 9: COMPANY PROFILES
- 9.1. Arcor Group
- 9.1.1. Company overview
- 9.1.2. Key Executives
- 9.1.3. Company snapshot
- 9.1.4. Operating business segments
- 9.1.5. Product portfolio
- 9.1.6. Business performance
- 9.1.7. Key strategic moves and developments
- 9.2. Cloetta AB
- 9.2.1. Company overview
- 9.2.2. Key Executives
- 9.2.3. Company snapshot
- 9.2.4. Operating business segments
- 9.2.5. Product portfolio
- 9.2.6. Business performance
- 9.2.7. Key strategic moves and developments
- 9.3. Ferndale Confectionery Pty Ltd
- 9.3.1. Company overview
- 9.3.2. Key Executives
- 9.3.3. Company snapshot
- 9.3.4. Operating business segments
- 9.3.5. Product portfolio
- 9.3.6. Key strategic moves and developments
- 9.4. Ferrero International S.A.
- 9.4.1. Company overview
- 9.4.2. Key Executives
- 9.4.3. Company snapshot
- 9.4.4. Operating business segments
- 9.4.5. Product portfolio
- 9.4.6. Key strategic moves and developments
- 9.5. Gumlink Confectionery Company A/S
- 9.5.1. Company overview
- 9.5.2. Key Executives
- 9.5.3. Company snapshot
- 9.5.4. Operating business segments
- 9.5.5. Product portfolio
- 9.6. Grenades Gum, LLC
- 9.6.1. Company overview
- 9.6.2. Key Executives
- 9.6.3. Company snapshot
- 9.6.4. Operating business segments
- 9.6.5. Product portfolio
- 9.7. HARIBO GmbH & Co. KG
- 9.7.1. Company overview
- 9.7.2. Key Executives
- 9.7.3. Company snapshot
- 9.7.4. Operating business segments
- 9.7.5. Product portfolio
- 9.7.6. Key strategic moves and developments
- 9.8. Lotte Corporation
- 9.8.1. Company overview
- 9.8.2. Key Executives
- 9.8.3. Company snapshot
- 9.8.4. Operating business segments
- 9.8.5. Product portfolio
- 9.8.6. Business performance
- 9.8.7. Key strategic moves and developments
- 9.9. Mars, Incorporated
- 9.9.1. Company overview
- 9.9.2. Key Executives
- 9.9.3. Company snapshot
- 9.9.4. Operating business segments
- 9.9.5. Product portfolio
- 9.9.6. Key strategic moves and developments
- 9.10. Meiji Holdings Co., Ltd.
- 9.10.1. Company overview
- 9.10.2. Key Executives
- 9.10.3. Company snapshot
- 9.10.4. Operating business segments
- 9.10.5. Product portfolio
- 9.10.6. Business performance
- 9.11. Mondelez International, Inc.
- 9.11.1. Company overview
- 9.11.2. Key Executives
- 9.11.3. Company snapshot
- 9.11.4. Operating business segments
- 9.11.5. Product portfolio
- 9.11.6. Business performance
- 9.11.7. Key strategic moves and developments
- 9.12. Perfetti Van Melle Group B.V.
- 9.12.1. Company overview
- 9.12.2. Key Executives
- 9.12.3. Company snapshot
- 9.12.4. Operating business segments
- 9.12.5. Product portfolio
- 9.12.6. Key strategic moves and developments
- 9.13. The Hershey Company
- 9.13.1. Company overview
- 9.13.2. Key Executives
- 9.13.3. Company snapshot
- 9.13.4. Operating business segments
- 9.13.5. Product portfolio
- 9.13.6. Business performance
- 9.13.7. Key strategic moves and developments
- 9.14. Tootsie Roll Industries, Inc.
- 9.14.1. Company overview
- 9.14.2. Key Executives
- 9.14.3. Company snapshot
- 9.14.4. Operating business segments
- 9.14.5. Product portfolio
- 9.14.6. Business performance
- 9.15. Yıldız Holding A/S
- 9.15.1. Company overview
- 9.15.2. Key Executives
- 9.15.3. Company snapshot
- 9.15.4. Operating business segments
- 9.15.5. Product portfolio
LIST OF TABLES
- TABLE 01. GLOBAL CHEWING GUM MARKET, BY TYPE, 2021-2031 ($MILLION)
- TABLE 02. GLOBAL CHEWING GUM MARKET, BY TYPE, 2021-2031 (MILLION UNITS)
- TABLE 03. CHEWING GUM MARKET FOR SUGARED CHEWING GUM, BY REGION, 2021-2031 ($MILLION)
- TABLE 04. CHEWING GUM MARKET FOR SUGARED CHEWING GUM, BY REGION, 2021-2031 (MILLION UNITS)
- TABLE 05. GLOBAL SUGARED CHEWING GUM CHEWING GUM MARKET, BY SUB-TYPE, 2021-2031 ($MILLION)
- TABLE 06. GLOBAL SUGARED CHEWING GUM CHEWING GUM MARKET, BY SUB-TYPE, 2021-2031 (MILLION UNITS)
- TABLE 07. CHEWING GUM MARKET FOR UNFLAVORED, BY REGION, 2021-2031 ($MILLION)
- TABLE 08. CHEWING GUM MARKET FOR UNFLAVORED, BY REGION, 2021-2031 (MILLION UNITS)
- TABLE 09. CHEWING GUM MARKET FOR FLAVORED, BY REGION, 2021-2031 ($MILLION)
- TABLE 10. CHEWING GUM MARKET FOR FLAVORED, BY REGION, 2021-2031 (MILLION UNITS)
- TABLE 11. CHEWING GUM MARKET FOR SUGAR-FREE CHEWING GUM, BY REGION, 2021-2031 ($MILLION)
- TABLE 12. CHEWING GUM MARKET FOR SUGAR-FREE CHEWING GUM, BY REGION, 2021-2031 (MILLION UNITS)
- TABLE 13. GLOBAL SUGAR-FREE CHEWING GUM CHEWING GUM MARKET, BY SUB-TYPE, 2021-2031 ($MILLION)
- TABLE 14. GLOBAL SUGAR-FREE CHEWING GUM CHEWING GUM MARKET, BY SUB-TYPE, 2021-2031 (MILLION UNITS)
- TABLE 15. CHEWING GUM MARKET FOR UNFLAVORED, BY REGION, 2021-2031 ($MILLION)
- TABLE 16. CHEWING GUM MARKET FOR UNFLAVORED, BY REGION, 2021-2031 (MILLION UNITS)
- TABLE 17. CHEWING GUM MARKET FOR FLAVORED, BY REGION, 2021-2031 ($MILLION)
- TABLE 18. CHEWING GUM MARKET FOR FLAVORED, BY REGION, 2021-2031 (MILLION UNITS)
- TABLE 19. GLOBAL CHEWING GUM MARKET, BY FORM, 2021-2031 ($MILLION)
- TABLE 20. CHEWING GUM MARKET FOR STICKS/TABS, BY REGION, 2021-2031 ($MILLION)
- TABLE 21. CHEWING GUM MARKET FOR PELLETS/PILLOWS, BY REGION, 2021-2031 ($MILLION)
- TABLE 22. CHEWING GUM MARKET FOR LIQUID FILLED GUM, BY REGION, 2021-2031 ($MILLION)
- TABLE 23. CHEWING GUM MARKET FOR OTHERS, BY REGION, 2021-2031 ($MILLION)
- TABLE 24. GLOBAL CHEWING GUM MARKET, BY DISTRIBUTION CHANNEL, 2021-2031 ($MILLION)
- TABLE 25. CHEWING GUM MARKET FOR SUPERMARKETS/HYPERMARKETS, BY REGION, 2021-2031 ($MILLION)
- TABLE 26. CHEWING GUM MARKET FOR SPECIALTY STORES, BY REGION, 2021-2031 ($MILLION)
- TABLE 27. CHEWING GUM MARKET FOR CONVENIENCE STORES, BY REGION, 2021-2031 ($MILLION)
- TABLE 28. CHEWING GUM MARKET FOR E-COMMERCE, BY REGION, 2021-2031 ($MILLION)
- TABLE 29. CHEWING GUM MARKET FOR OTHERS, BY REGION, 2021-2031 ($MILLION)
- TABLE 30. CHEWING GUM MARKET, BY REGION, 2021-2031 ($MILLION)
- TABLE 31. CHEWING GUM MARKET, BY REGION, 2021-2031 (MILLION UNITS)
- TABLE 32. NORTH AMERICA CHEWING GUM MARKET, BY TYPE, 2021-2031 ($MILLION)
- TABLE 33. NORTH AMERICA CHEWING GUM MARKET, BY TYPE, 2021-2031 (MILLION UNITS)
- TABLE 34. NORTH AMERICA SUGARED CHEWING GUM CHEWING GUM MARKET, BY SUB-TYPE, 2021-2031 ($MILLION)
- TABLE 35. NORTH AMERICA SUGARED CHEWING GUM CHEWING GUM MARKET, BY SUB-TYPE, 2021-2031 (MILLION UNITS)
- TABLE 36. NORTH AMERICA SUGAR-FREE CHEWING GUM CHEWING GUM MARKET, BY SUB-TYPE, 2021-2031 ($MILLION)
- TABLE 37. NORTH AMERICA SUGAR-FREE CHEWING GUM CHEWING GUM MARKET, BY SUB-TYPE, 2021-2031 (MILLION UNITS)
- TABLE 38. NORTH AMERICA CHEWING GUM MARKET, BY FORM, 2021-2031 ($MILLION)
- TABLE 39. NORTH AMERICA CHEWING GUM MARKET, BY DISTRIBUTION CHANNEL, 2021-2031 ($MILLION)
- TABLE 40. NORTH AMERICA CHEWING GUM MARKET, BY COUNTRY, 2021-2031 ($MILLION)
- TABLE 41. NORTH AMERICA CHEWING GUM MARKET, BY COUNTRY, 2021-2031 (MILLION UNITS)
- TABLE 42. U.S. CHEWING GUM MARKET, BY TYPE, 2021-2031 ($MILLION)
- TABLE 43. U.S. CHEWING GUM MARKET, BY TYPE, 2021-2031 (MILLION UNITS)
- TABLE 44. U.S. CHEWING GUM MARKET, BY FORM, 2021-2031 ($MILLION)
- TABLE 45. U.S. CHEWING GUM MARKET, BY DISTRIBUTION CHANNEL, 2021-2031 ($MILLION)
- TABLE 46. CANADA CHEWING GUM MARKET, BY TYPE, 2021-2031 ($MILLION)
- TABLE 47. CANADA CHEWING GUM MARKET, BY TYPE, 2021-2031 (MILLION UNITS)
- TABLE 48. CANADA CHEWING GUM MARKET, BY FORM, 2021-2031 ($MILLION)
- TABLE 49. CANADA CHEWING GUM MARKET, BY DISTRIBUTION CHANNEL, 2021-2031 ($MILLION)
- TABLE 50. MEXICO CHEWING GUM MARKET, BY TYPE, 2021-2031 ($MILLION)
- TABLE 51. MEXICO CHEWING GUM MARKET, BY TYPE, 2021-2031 (MILLION UNITS)
- TABLE 52. MEXICO CHEWING GUM MARKET, BY FORM, 2021-2031 ($MILLION)
- TABLE 53. MEXICO CHEWING GUM MARKET, BY DISTRIBUTION CHANNEL, 2021-2031 ($MILLION)
- TABLE 54. EUROPE CHEWING GUM MARKET, BY TYPE, 2021-2031 ($MILLION)
- TABLE 55. EUROPE CHEWING GUM MARKET, BY TYPE, 2021-2031 (MILLION UNITS)
- TABLE 56. EUROPE SUGARED CHEWING GUM CHEWING GUM MARKET, BY SUB-TYPE, 2021-2031 ($MILLION)
- TABLE 57. EUROPE SUGARED CHEWING GUM CHEWING GUM MARKET, BY SUB-TYPE, 2021-2031 (MILLION UNITS)
- TABLE 58. EUROPE SUGAR-FREE CHEWING GUM CHEWING GUM MARKET, BY SUB-TYPE, 2021-2031 ($MILLION)
- TABLE 59. EUROPE SUGAR-FREE CHEWING GUM CHEWING GUM MARKET, BY SUB-TYPE, 2021-2031 (MILLION UNITS)
- TABLE 60. EUROPE CHEWING GUM MARKET, BY FORM, 2021-2031 ($MILLION)
- TABLE 61. EUROPE CHEWING GUM MARKET, BY DISTRIBUTION CHANNEL, 2021-2031 ($MILLION)
- TABLE 62. EUROPE CHEWING GUM MARKET, BY COUNTRY, 2021-2031 ($MILLION)
- TABLE 63. EUROPE CHEWING GUM MARKET, BY COUNTRY, 2021-2031 (MILLION UNITS)
- TABLE 64. UK CHEWING GUM MARKET, BY TYPE, 2021-2031 ($MILLION)
- TABLE 65. UK CHEWING GUM MARKET, BY TYPE, 2021-2031 (MILLION UNITS)
- TABLE 66. UK CHEWING GUM MARKET, BY FORM, 2021-2031 ($MILLION)
- TABLE 67. UK CHEWING GUM MARKET, BY DISTRIBUTION CHANNEL, 2021-2031 ($MILLION)
- TABLE 68. GERMANY CHEWING GUM MARKET, BY TYPE, 2021-2031 ($MILLION)
- TABLE 69. GERMANY CHEWING GUM MARKET, BY TYPE, 2021-2031 (MILLION UNITS)
- TABLE 70. GERMANY CHEWING GUM MARKET, BY FORM, 2021-2031 ($MILLION)
- TABLE 71. GERMANY CHEWING GUM MARKET, BY DISTRIBUTION CHANNEL, 2021-2031 ($MILLION)
- TABLE 72. FRANCE CHEWING GUM MARKET, BY TYPE, 2021-2031 ($MILLION)
- TABLE 73. FRANCE CHEWING GUM MARKET, BY TYPE, 2021-2031 (MILLION UNITS)
- TABLE 74. FRANCE CHEWING GUM MARKET, BY FORM, 2021-2031 ($MILLION)
- TABLE 75. FRANCE CHEWING GUM MARKET, BY DISTRIBUTION CHANNEL, 2021-2031 ($MILLION)
- TABLE 76. ITALY CHEWING GUM MARKET, BY TYPE, 2021-2031 ($MILLION)
- TABLE 77. ITALY CHEWING GUM MARKET, BY TYPE, 2021-2031 (MILLION UNITS)
- TABLE 78. ITALY CHEWING GUM MARKET, BY FORM, 2021-2031 ($MILLION)
- TABLE 79. ITALY CHEWING GUM MARKET, BY DISTRIBUTION CHANNEL, 2021-2031 ($MILLION)
- TABLE 80. SPAIN CHEWING GUM MARKET, BY TYPE, 2021-2031 ($MILLION)
- TABLE 81. SPAIN CHEWING GUM MARKET, BY TYPE, 2021-2031 (MILLION UNITS)
- TABLE 82. SPAIN CHEWING GUM MARKET, BY FORM, 2021-2031 ($MILLION)
- TABLE 83. SPAIN CHEWING GUM MARKET, BY DISTRIBUTION CHANNEL, 2021-2031 ($MILLION)
- TABLE 84. REST OF EUROPE CHEWING GUM MARKET, BY TYPE, 2021-2031 ($MILLION)
- TABLE 85. REST OF EUROPE CHEWING GUM MARKET, BY TYPE, 2021-2031 (MILLION UNITS)
- TABLE 86. REST OF EUROPE CHEWING GUM MARKET, BY FORM, 2021-2031 ($MILLION)
- TABLE 87. REST OF EUROPE CHEWING GUM MARKET, BY DISTRIBUTION CHANNEL, 2021-2031 ($MILLION)
- TABLE 88. ASIA-PACIFIC CHEWING GUM MARKET, BY TYPE, 2021-2031 ($MILLION)
- TABLE 89. ASIA-PACIFIC CHEWING GUM MARKET, BY TYPE, 2021-2031 (MILLION UNITS)
- TABLE 90. ASIA-PACIFIC SUGARED CHEWING GUM CHEWING GUM MARKET, BY SUB-TYPE, 2021-2031 ($MILLION)
- TABLE 91. ASIA-PACIFIC SUGARED CHEWING GUM CHEWING GUM MARKET, BY SUB-TYPE, 2021-2031 (MILLION UNITS)
- TABLE 92. ASIA-PACIFIC SUGAR-FREE CHEWING GUM CHEWING GUM MARKET, BY SUB-TYPE, 2021-2031 ($MILLION)
- TABLE 93. ASIA-PACIFIC SUGAR-FREE CHEWING GUM CHEWING GUM MARKET, BY SUB-TYPE, 2021-2031 (MILLION UNITS)
- TABLE 94. ASIA-PACIFIC CHEWING GUM MARKET, BY FORM, 2021-2031 ($MILLION)
- TABLE 95. ASIA-PACIFIC CHEWING GUM MARKET, BY DISTRIBUTION CHANNEL, 2021-2031 ($MILLION)
- TABLE 96. ASIA-PACIFIC CHEWING GUM MARKET, BY COUNTRY, 2021-2031 ($MILLION)
- TABLE 97. ASIA-PACIFIC CHEWING GUM MARKET, BY COUNTRY, 2021-2031 (MILLION UNITS)
- TABLE 98. CHINA CHEWING GUM MARKET, BY TYPE, 2021-2031 ($MILLION)
- TABLE 99. CHINA CHEWING GUM MARKET, BY TYPE, 2021-2031 (MILLION UNITS)
- TABLE 100. CHINA CHEWING GUM MARKET, BY FORM, 2021-2031 ($MILLION)
- TABLE 101. CHINA CHEWING GUM MARKET, BY DISTRIBUTION CHANNEL, 2021-2031 ($MILLION)
- TABLE 102. JAPAN CHEWING GUM MARKET, BY TYPE, 2021-2031 ($MILLION)
- TABLE 103. JAPAN CHEWING GUM MARKET, BY TYPE, 2021-2031 (MILLION UNITS)
- TABLE 104. JAPAN CHEWING GUM MARKET, BY FORM, 2021-2031 ($MILLION)
- TABLE 105. JAPAN CHEWING GUM MARKET, BY DISTRIBUTION CHANNEL, 2021-2031 ($MILLION)
- TABLE 106. INDIA CHEWING GUM MARKET, BY TYPE, 2021-2031 ($MILLION)
- TABLE 107. INDIA CHEWING GUM MARKET, BY TYPE, 2021-2031 (MILLION UNITS)
- TABLE 108. INDIA CHEWING GUM MARKET, BY FORM, 2021-2031 ($MILLION)
- TABLE 109. INDIA CHEWING GUM MARKET, BY DISTRIBUTION CHANNEL, 2021-2031 ($MILLION)
- TABLE 110. SOUTH KOREA CHEWING GUM MARKET, BY TYPE, 2021-2031 ($MILLION)
- TABLE 111. SOUTH KOREA CHEWING GUM MARKET, BY TYPE, 2021-2031 (MILLION UNITS)
- TABLE 112. SOUTH KOREA CHEWING GUM MARKET, BY FORM, 2021-2031 ($MILLION)
- TABLE 113. SOUTH KOREA CHEWING GUM MARKET, BY DISTRIBUTION CHANNEL, 2021-2031 ($MILLION)
- TABLE 114. AUSTRALIA CHEWING GUM MARKET, BY TYPE, 2021-2031 ($MILLION)
- TABLE 115. AUSTRALIA CHEWING GUM MARKET, BY TYPE, 2021-2031 (MILLION UNITS)
- TABLE 116. AUSTRALIA CHEWING GUM MARKET, BY FORM, 2021-2031 ($MILLION)
- TABLE 117. AUSTRALIA CHEWING GUM MARKET, BY DISTRIBUTION CHANNEL, 2021-2031 ($MILLION)
- TABLE 118. REST OF ASIA-PACIFIC CHEWING GUM MARKET, BY TYPE, 2021-2031 ($MILLION)
- TABLE 119. REST OF ASIA-PACIFIC CHEWING GUM MARKET, BY TYPE, 2021-2031 (MILLION UNITS)
- TABLE 120. REST OF ASIA-PACIFIC CHEWING GUM MARKET, BY FORM, 2021-2031 ($MILLION)
- TABLE 121. REST OF ASIA-PACIFIC CHEWING GUM MARKET, BY DISTRIBUTION CHANNEL, 2021-2031 ($MILLION)
- TABLE 122. LAMEA CHEWING GUM MARKET, BY TYPE, 2021-2031 ($MILLION)
- TABLE 123. LAMEA CHEWING GUM MARKET, BY TYPE, 2021-2031 (MILLION UNITS)
- TABLE 124. LAMEA SUGARED CHEWING GUM CHEWING GUM MARKET, BY SUB-TYPE, 2021-2031 ($MILLION)
- TABLE 125. LAMEA SUGARED CHEWING GUM CHEWING GUM MARKET, BY SUB-TYPE, 2021-2031 (MILLION UNITS)
- TABLE 126. LAMEA SUGAR-FREE CHEWING GUM CHEWING GUM MARKET, BY SUB-TYPE, 2021-2031 ($MILLION)
- TABLE 127. LAMEA SUGAR-FREE CHEWING GUM CHEWING GUM MARKET, BY SUB-TYPE, 2021-2031 (MILLION UNITS)
- TABLE 128. LAMEA CHEWING GUM MARKET, BY FORM, 2021-2031 ($MILLION)
- TABLE 129. LAMEA CHEWING GUM MARKET, BY DISTRIBUTION CHANNEL, 2021-2031 ($MILLION)
- TABLE 130. LAMEA CHEWING GUM MARKET, BY COUNTRY, 2021-2031 ($MILLION)
- TABLE 131. LAMEA CHEWING GUM MARKET, BY COUNTRY, 2021-2031 (MILLION UNITS)
- TABLE 132. BRAZIL CHEWING GUM MARKET, BY TYPE, 2021-2031 ($MILLION)
- TABLE 133. BRAZIL CHEWING GUM MARKET, BY TYPE, 2021-2031 (MILLION UNITS)
- TABLE 134. BRAZIL CHEWING GUM MARKET, BY FORM, 2021-2031 ($MILLION)
- TABLE 135. BRAZIL CHEWING GUM MARKET, BY DISTRIBUTION CHANNEL, 2021-2031 ($MILLION)
- TABLE 136. SOUTH AFRICA, CHEWING GUM MARKET, BY TYPE, 2021-2031 ($MILLION)
- TABLE 137. SOUTH AFRICA, CHEWING GUM MARKET, BY TYPE, 2021-2031 (MILLION UNITS)
- TABLE 138. SOUTH AFRICA, CHEWING GUM MARKET, BY FORM, 2021-2031 ($MILLION)
- TABLE 139. SOUTH AFRICA, CHEWING GUM MARKET, BY DISTRIBUTION CHANNEL, 2021-2031 ($MILLION)
- TABLE 140. SAUDI ARABIA CHEWING GUM MARKET, BY TYPE, 2021-2031 ($MILLION)
- TABLE 141. SAUDI ARABIA CHEWING GUM MARKET, BY TYPE, 2021-2031 (MILLION UNITS)
- TABLE 142. SAUDI ARABIA CHEWING GUM MARKET, BY FORM, 2021-2031 ($MILLION)
- TABLE 143. SAUDI ARABIA CHEWING GUM MARKET, BY DISTRIBUTION CHANNEL, 2021-2031 ($MILLION)
- TABLE 144. TURKEY CHEWING GUM MARKET, BY TYPE, 2021-2031 ($MILLION)
- TABLE 145. TURKEY CHEWING GUM MARKET, BY TYPE, 2021-2031 (MILLION UNITS)
- TABLE 146. TURKEY CHEWING GUM MARKET, BY FORM, 2021-2031 ($MILLION)
- TABLE 147. TURKEY CHEWING GUM MARKET, BY DISTRIBUTION CHANNEL, 2021-2031 ($MILLION)
- TABLE 148. REST OF LAMEA CHEWING GUM MARKET, BY TYPE, 2021-2031 ($MILLION)
- TABLE 149. REST OF LAMEA CHEWING GUM MARKET, BY TYPE, 2021-2031 (MILLION UNITS)
- TABLE 150. REST OF LAMEA CHEWING GUM MARKET, BY FORM, 2021-2031 ($MILLION)
- TABLE 151. REST OF LAMEA CHEWING GUM MARKET, BY DISTRIBUTION CHANNEL, 2021-2031 ($MILLION)
- TABLE 152. ARCOR GROUP: KEY EXECUTIVES
- TABLE 153. ARCOR GROUP: COMPANY SNAPSHOT
- TABLE 154. ARCOR GROUP: PRODUCT SEGMENTS
- TABLE 155. ARCOR GROUP: PRODUCT PORTFOLIO
- TABLE 156. ARCOR GROUP: KEY STRATERGIES
- TABLE 157. CLOETTA AB: KEY EXECUTIVES
- TABLE 158. CLOETTA AB: COMPANY SNAPSHOT
- TABLE 159. CLOETTA AB: PRODUCT SEGMENTS
- TABLE 160. CLOETTA AB: PRODUCT PORTFOLIO
- TABLE 161. CLOETTA AB: KEY STRATERGIES
- TABLE 162. FERNDALE CONFECTIONERY PTY LTD: KEY EXECUTIVES
- TABLE 163. FERNDALE CONFECTIONERY PTY LTD: COMPANY SNAPSHOT
- TABLE 164. FERNDALE CONFECTIONERY PTY LTD: PRODUCT SEGMENTS
- TABLE 165. FERNDALE CONFECTIONERY PTY LTD: PRODUCT PORTFOLIO
- TABLE 166. FERNDALE CONFECTIONERY PTY LTD: KEY STRATERGIES
- TABLE 167. FERRERO INTERNATIONAL S.A.: KEY EXECUTIVES
- TABLE 168. FERRERO INTERNATIONAL S.A.: COMPANY SNAPSHOT
- TABLE 169. FERRERO INTERNATIONAL S.A.: PRODUCT SEGMENTS
- TABLE 170. FERRERO INTERNATIONAL S.A.: PRODUCT PORTFOLIO
- TABLE 171. FERRERO INTERNATIONAL S.A.: KEY STRATERGIES
- TABLE 172. GUMLINK CONFECTIONERY COMPANY A/S: KEY EXECUTIVES
- TABLE 173. GUMLINK CONFECTIONERY COMPANY A/S: COMPANY SNAPSHOT
- TABLE 174. GUMLINK CONFECTIONERY COMPANY A/S: PRODUCT SEGMENTS
- TABLE 175. GUMLINK CONFECTIONERY COMPANY A/S: PRODUCT PORTFOLIO
- TABLE 176. GRENADES GUM, LLC: KEY EXECUTIVES
- TABLE 177. GRENADES GUM, LLC: COMPANY SNAPSHOT
- TABLE 178. GRENADES GUM, LLC: PRODUCT SEGMENTS
- TABLE 179. GRENADES GUM, LLC: PRODUCT PORTFOLIO
- TABLE 180. HARIBO GMBH & CO. KG: KEY EXECUTIVES
- TABLE 181. HARIBO GMBH & CO. KG: COMPANY SNAPSHOT
- TABLE 182. HARIBO GMBH & CO. KG: PRODUCT SEGMENTS
- TABLE 183. HARIBO GMBH & CO. KG: PRODUCT PORTFOLIO
- TABLE 184. HARIBO GMBH & CO. KG: KEY STRATERGIES
- TABLE 185. LOTTE CORPORATION: KEY EXECUTIVES
- TABLE 186. LOTTE CORPORATION: COMPANY SNAPSHOT
- TABLE 187. LOTTE CORPORATION: PRODUCT SEGMENTS
- TABLE 188. LOTTE CORPORATION: SERVICE SEGMENTS
- TABLE 189. LOTTE CORPORATION: PRODUCT PORTFOLIO
- TABLE 190. LOTTE CORPORATION: KEY STRATERGIES
- TABLE 191. MARS, INCORPORATED: KEY EXECUTIVES
- TABLE 192. MARS, INCORPORATED: COMPANY SNAPSHOT
- TABLE 193. MARS, INCORPORATED: PRODUCT SEGMENTS
- TABLE 194. MARS, INCORPORATED: PRODUCT PORTFOLIO
- TABLE 195. MARS, INCORPORATED: KEY STRATERGIES
- TABLE 196. MEIJI HOLDINGS CO., LTD.: KEY EXECUTIVES
- TABLE 197. MEIJI HOLDINGS CO., LTD.: COMPANY SNAPSHOT
- TABLE 198. MEIJI HOLDINGS CO., LTD.: PRODUCT SEGMENTS
- TABLE 199. MEIJI HOLDINGS CO., LTD.: PRODUCT PORTFOLIO
- TABLE 200. MONDELEZ INTERNATIONAL, INC.: KEY EXECUTIVES
- TABLE 201. MONDELEZ INTERNATIONAL, INC.: COMPANY SNAPSHOT
- TABLE 202. MONDELEZ INTERNATIONAL, INC.: PRODUCT SEGMENTS
- TABLE 203. MONDELEZ INTERNATIONAL, INC.: PRODUCT PORTFOLIO
- TABLE 204. MONDELEZ INTERNATIONAL, INC.: KEY STRATERGIES
- TABLE 205. PERFETTI VAN MELLE GROUP B.V.: KEY EXECUTIVES
- TABLE 206. PERFETTI VAN MELLE GROUP B.V.: COMPANY SNAPSHOT
- TABLE 207. PERFETTI VAN MELLE GROUP B.V.: PRODUCT SEGMENTS
- TABLE 208. PERFETTI VAN MELLE GROUP B.V.: PRODUCT PORTFOLIO
- TABLE 209. PERFETTI VAN MELLE GROUP B.V.: KEY STRATERGIES
- TABLE 210. THE HERSHEY COMPANY: KEY EXECUTIVES
- TABLE 211. THE HERSHEY COMPANY: COMPANY SNAPSHOT
- TABLE 212. THE HERSHEY COMPANY: PRODUCT SEGMENTS
- TABLE 213. THE HERSHEY COMPANY: PRODUCT PORTFOLIO
- TABLE 214. THE HERSHEY COMPANY: KEY STRATERGIES
- TABLE 215. TOOTSIE ROLL INDUSTRIES, INC.: KEY EXECUTIVES
- TABLE 216. TOOTSIE ROLL INDUSTRIES, INC.: COMPANY SNAPSHOT
- TABLE 217. TOOTSIE ROLL INDUSTRIES, INC.: PRODUCT SEGMENTS
- TABLE 218. TOOTSIE ROLL INDUSTRIES, INC.: PRODUCT PORTFOLIO
- TABLE 219. YILDIZ HOLDING A/S: KEY EXECUTIVES
- TABLE 220. YILDIZ HOLDING A/S: COMPANY SNAPSHOT
- TABLE 221. YILDIZ HOLDING A/S: PRODUCT SEGMENTS
- TABLE 222. YILDIZ HOLDING A/S: PRODUCT PORTFOLIO
LIST OF FIGURES
- FIGURE 01. CHEWING GUM MARKET, 2021-2031
- FIGURE 02. SEGMENTATION OF CHEWING GUM MARKET, 2021-2031
- FIGURE 03. TOP INVESTMENT POCKETS IN CHEWING GUM MARKET (2022-2031)
- FIGURE 04. MODERATE BARGAINING POWER OF SUPPLIERS
- FIGURE 05. MODERATE BARGAINING POWER OF BUYERS
- FIGURE 06. HIGH THREAT OF SUBSTITUTES
- FIGURE 07. MODERATE THREAT OF NEW ENTRANTS
- FIGURE 08. MODERATE INTENSITY OF RIVALRY
- FIGURE 09. DRIVERS, RESTRAINTS AND OPPORTUNITIES: GLOBALCHEWING GUM MARKET
- FIGURE 10. MARKET SHARE ANALYSIS: CHEWING GUM MARKET
- FIGURE 11. PRICING ANALYSIS: CHEWING GUM MARKET 2021 AND 2031
- FIGURE 12. VALUE CHAIN ANALYSIS: CHEWING GUM MARKET
- FIGURE 13. CHEWING GUM MARKET, BY TYPE, 2021(%)
- FIGURE 14. COMPARATIVE SHARE ANALYSIS OF CHEWING GUM MARKET FOR SUGARED CHEWING GUM, BY COUNTRY 2021 AND 2031(%)
- FIGURE 15. COMPARATIVE SHARE ANALYSIS OF CHEWING GUM MARKET FOR SUGAR-FREE CHEWING GUM, BY COUNTRY 2021 AND 2031(%)
- FIGURE 16. CHEWING GUM MARKET, BY FORM, 2021(%)
- FIGURE 17. COMPARATIVE SHARE ANALYSIS OF CHEWING GUM MARKET FOR STICKS/TABS, BY COUNTRY 2021 AND 2031(%)
- FIGURE 18. COMPARATIVE SHARE ANALYSIS OF CHEWING GUM MARKET FOR PELLETS/PILLOWS, BY COUNTRY 2021 AND 2031(%)
- FIGURE 19. COMPARATIVE SHARE ANALYSIS OF CHEWING GUM MARKET FOR LIQUID FILLED GUM, BY COUNTRY 2021 AND 2031(%)
- FIGURE 20. COMPARATIVE SHARE ANALYSIS OF CHEWING GUM MARKET FOR OTHERS, BY COUNTRY 2021 AND 2031(%)
- FIGURE 21. CHEWING GUM MARKET, BY DISTRIBUTION CHANNEL, 2021(%)
- FIGURE 22. COMPARATIVE SHARE ANALYSIS OF CHEWING GUM MARKET FOR SUPERMARKETS/HYPERMARKETS, BY COUNTRY 2021 AND 2031(%)
- FIGURE 23. COMPARATIVE SHARE ANALYSIS OF CHEWING GUM MARKET FOR SPECIALTY STORES, BY COUNTRY 2021 AND 2031(%)
- FIGURE 24. COMPARATIVE SHARE ANALYSIS OF CHEWING GUM MARKET FOR CONVENIENCE STORES, BY COUNTRY 2021 AND 2031(%)
- FIGURE 25. COMPARATIVE SHARE ANALYSIS OF CHEWING GUM MARKET FOR E-COMMERCE, BY COUNTRY 2021 AND 2031(%)
- FIGURE 26. COMPARATIVE SHARE ANALYSIS OF CHEWING GUM MARKET FOR OTHERS, BY COUNTRY 2021 AND 2031(%)
- FIGURE 27. CHEWING GUM MARKET BY REGION, 2021
- FIGURE 28. U.S. CHEWING GUM MARKET, 2021-2031 ($MILLION)
- FIGURE 29. CANADA CHEWING GUM MARKET, 2021-2031 ($MILLION)
- FIGURE 30. MEXICO CHEWING GUM MARKET, 2021-2031 ($MILLION)
- FIGURE 31. UK CHEWING GUM MARKET, 2021-2031 ($MILLION)
- FIGURE 32. GERMANY CHEWING GUM MARKET, 2021-2031 ($MILLION)
- FIGURE 33. FRANCE CHEWING GUM MARKET, 2021-2031 ($MILLION)
- FIGURE 34. ITALY CHEWING GUM MARKET, 2021-2031 ($MILLION)
- FIGURE 35. SPAIN CHEWING GUM MARKET, 2021-2031 ($MILLION)
- FIGURE 36. REST OF EUROPE CHEWING GUM MARKET, 2021-2031 ($MILLION)
- FIGURE 37. CHINA CHEWING GUM MARKET, 2021-2031 ($MILLION)
- FIGURE 38. JAPAN CHEWING GUM MARKET, 2021-2031 ($MILLION)
- FIGURE 39. INDIA CHEWING GUM MARKET, 2021-2031 ($MILLION)
- FIGURE 40. SOUTH KOREA CHEWING GUM MARKET, 2021-2031 ($MILLION)
- FIGURE 41. AUSTRALIA CHEWING GUM MARKET, 2021-2031 ($MILLION)
- FIGURE 42. REST OF ASIA-PACIFIC CHEWING GUM MARKET, 2021-2031 ($MILLION)
- FIGURE 43. BRAZIL CHEWING GUM MARKET, 2021-2031 ($MILLION)
- FIGURE 44. SOUTH AFRICA, CHEWING GUM MARKET, 2021-2031 ($MILLION)
- FIGURE 45. SAUDI ARABIA CHEWING GUM MARKET, 2021-2031 ($MILLION)
- FIGURE 46. TURKEY CHEWING GUM MARKET, 2021-2031 ($MILLION)
- FIGURE 47. REST OF LAMEA CHEWING GUM MARKET, 2021-2031 ($MILLION)
- FIGURE 48. TOP WINNING STRATEGIES, BY YEAR
- FIGURE 49. TOP WINNING STRATEGIES, BY DEVELOPMENT
- FIGURE 50. TOP WINNING STRATEGIES, BY COMPANY
- FIGURE 51. PRODUCT MAPPING OF TOP 10 PLAYERS
- FIGURE 52. COMPETITIVE DASHBOARD
- FIGURE 53. COMPETITIVE HEATMAP: CHEWING GUM MARKET
- FIGURE 54. TOP PLAYER POSITIONING, 2021
- FIGURE 55. ARCOR GROUP: NET SALES, 2019-2021 ($MILLION)
- FIGURE 56. ARCOR GROUP: RESEARCH & DEVELOPMENT EXPENDITURE, 2019-2021 ($MILLION)
- FIGURE 57. ARCOR GROUP: REVENUE SHARE BY SEGMENT, 2021 (%)
- FIGURE 58. ARCOR GROUP: REVENUE SHARE BY REGION, 2021 (%)
- FIGURE 59. CLOETTA AB: NET SALES, 2019-2021 ($MILLION)
- FIGURE 60. CLOETTA AB: RESEARCH & DEVELOPMENT EXPENDITURE, 2019-2021 ($MILLION)
- FIGURE 61. CLOETTA AB: REVENUE SHARE BY SEGMENT, 2021 (%)
- FIGURE 62. CLOETTA AB: REVENUE SHARE BY REGION, 2021 (%)
- FIGURE 63. LOTTE CORPORATION: NET SALES, 2019-2021 ($MILLION)
- FIGURE 64. MEIJI HOLDINGS CO., LTD.: NET SALES, 2019-2021 ($MILLION)
- FIGURE 65. MEIJI HOLDINGS CO., LTD.: RESEARCH & DEVELOPMENT EXPENDITURE, 2019-2021
- FIGURE 66. MEIJI HOLDINGS CO., LTD.: REVENUE SHARE BY SEGMENT, 2021 (%)
- FIGURE 67. MONDELEZ INTERNATIONAL, INC.: NET REVENUE, 2020-2022 ($MILLION)
- FIGURE 68. MONDELEZ INTERNATIONAL, INC.: RESEARCH & DEVELOPMENT EXPENDITURE, 2020-2022 ($MILLION)
- FIGURE 69. MONDELEZ INTERNATIONAL, INC.: REVENUE SHARE BY SEGMENT, 2022 (%)
- FIGURE 70. THE HERSHEY COMPANY: NET REVENUE, 2019-2021 ($MILLION)
- FIGURE 71. THE HERSHEY COMPANY: REVENUE SHARE BY SEGMENT, 2021 (%)
- FIGURE 72. TOOTSIE ROLL INDUSTRIES, INC.: NET REVENUE, 2019-2021 ($MILLION)
- FIGURE 73. TOOTSIE ROLL INDUSTRIES, INC.: REVENUE SHARE BY REGION, 2021 (%)

