
PUBLISHER: Allied Market Research | PRODUCT CODE: 1344461

PUBLISHER: Allied Market Research | PRODUCT CODE: 1344461
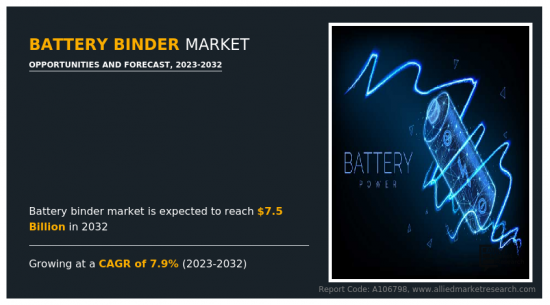
Battery Binder Market By Battery Type, By Material : Global Opportunity Analysis and Industry Forecast, 2023-2032
According to a new report published by Allied Market Research, titled, "Battery Binder Market," The battery binder market was valued at $3.5 billion in 2022, and is estimated to reach $7.5 billion by 2032, growing at a CAGR of 7.9% from 2023 to 2032.
Battery binders provide strong adhesion between the active electrode materials and the current collector, ensuring efficient electron transfer and minimizing internal resistance. Moreover, they form a protective coating on the electrodes, enhancing their stability and preventing degradation. Binders contribute to the mechanical stability and integrity of the battery cell, preventing electrode detachment or structural failure during charging and discharging cycles. They improve the lifespan and overall performance of battery. Battery binders are designed to be chemically stable in the presence of the battery electrolyte, minimizing any adverse reactions that could affect the battery's performance and safety.
Binders exhibit high thermal and chemical stability, maintaining their integrity and functionality over a wide range of operating temperatures and conditions. This ensures the longevity and safety of the battery cell. The rapid adoption of electric vehicles worldwide fuels the demand for high-performance batteries. Battery binders offer improved energy density, cycle life, and thermal stability and are anticipated to find substantial opportunities in the EV market.
The increase in use of smartphones, tablets, wearable devices, and other portable electronics necessitates compact and long-lasting batteries have demanded the battery binders market. Battery binders enable higher energy storage and improved safety would be in high demand. Grid-scale energy storage solutions have become increasingly important as renewable energy sources, such as solar and wind, are integrated into the power grid. These intermittent energy sources require effective energy storage systems to address the fluctuating supply and demand dynamics. Battery binders play a vital role in enhancing the efficiency, reliability, and safety of energy storage systems.
Advancements in next-generation batteries are expected to provide sufficient development prospects for the expansion of the global battery binders market in the future years. Next-generation battery binders are essential for enhancing the performance and safety of batteries. They hold the active materials in electrodes of a battery together and provide mechanical stability.
Nissan announced plans to introduce laminated solid-state batteries by 2028, as part of their Ambition 2030 strategy, and invested $17 billion in new electric vehicle concepts. Solid-state binders, replacing traditional liquid binders such as PVDF, offer improved stability and safety. They consist of polymers or ceramics that enhance adhesion between active materials and improve electrode integrity. The U.S. Department of Energy pledged $2.91 billion to boost advanced battery production for energy storage systems and electric vehicles, as directed by the Bipartisan Infrastructure Law. Nanostructured binders with nanoscale engineering enable better electrode-electrolyte contact, reduced ion transport resistance, and higher energy and power densities in batteries.
The battery binders market is segmented into battery type, material, and region. On the basis of battery type, the market is segmented into lithium-ion, nickel cadmium, lead acid, and others. On the basis of materials, the market is divided into polyvinylidene fluoride (PVDF), carboxymethyl cellulose (CMC), polymethyl methacrylate (PMMA), styrene-butadiene copolymer (SBR), and others. On the basis of region, the market is studied across North America, Europe, Asia-Pacific, and LAMEA.
By battery type lead acid segment is the fastest growing segment of the battery binders market in 2022. Lead-acid batteries are a type of rechargeable battery that has been in use for many years. They consist of lead electrodes immersed in an electrolyte solution of sulfuric acid. The electrodes are typically made of lead grids or plates, which are designed to maximize the surface area for chemical reactions. In the construction of lead-acid batteries, the lead plates are held together using a variety of materials, including lead-based binders. These binders serve as a structural component to hold the active materials in place and provide mechanical stability to the battery.
By material, carboxymethyl cellulose segment is the fastest growing segment of the battery binders market in 2022. Carboxymethyl cellulose (CMC) is a versatile polymer derived from cellulose and has a wide range of applications in various industries, including the battery industry. In battery manufacturing, CMC is often used as a binder material to hold together the active materials, such as electrode powders and other components, within the battery cell. CMC has the ability to modify the rheological properties of the electrode slurry. It can improve the viscosity and flow characteristics of the slurry, making it easier to coat the electrode materials onto the current collectors during the manufacturing process.
On the basis of region, Asia-Pacific is the fastest growing region of the battery binders market in 2022. Japan is a leading producer of batteries for the automotive industry and employs various binder materials like PVDF, CMC, and SBR to create superior batteries. The country has made substantial investments in advancing battery technologies, leading to a surge in demand for battery binders. The International Energy Agency reports that Japan plans to increase its global output capacity at Japanese companies to 600 gigawatt hours (GWh) by 2030, aiming for a 20% market share in the global rechargeable battery market by the same year.
The major players operating in the global metal abrasives market include I.S.T Corporation Arkema, The Lubrizol Corporation, BASF SE, Solvay S.A., Daikin Industries, Ltd., Zeon Corporation, Targray, I.S.T Corporation, Synthomer PLC, and Trinseo. In April 2023, Arkema expanded its offering with the launch of its Incellion portfolio of sustainable waterborne acrylic solutions for high-capacity anodes, cathode primers, and ceramic-coated separators. In June 2022, Solvay announced the completion of its polyvinylidene fluoride (PVDF) capacity expansion project at the Changshu site in China. The company doubled its production capacity for this high-performance polymer before the expected time to meet the growing customer demand for EV batteries.
Key findings of the study:
- By battery type, the lithium-ion segment was the highest revenue contributor to the market in 2022.
- By materials, the polyvinylidene fluoride segment was the highest revenue contributor to the market, with in 2022, with a CAGR of 7.9%.
- By region, Asia-Pacific domiated the battery binders market in 2022.
Key Benefits For Stakeholders
- This report provides a quantitative analysis of the market segments, current trends, estimations, and dynamics of the battery binder market analysis from 2022 to 2032 to identify the prevailing battery binder market opportunities.
- The market research is offered along with information related to key drivers, restraints, and opportunities.
- Porter's five forces analysis highlights the potency of buyers and suppliers to enable stakeholders make profit-oriented business decisions and strengthen their supplier-buyer network.
- In-depth analysis of the battery binder market segmentation assists to determine the prevailing market opportunities.
- Major countries in each region are mapped according to their revenue contribution to the global market.
- Market player positioning facilitates benchmarking and provides a clear understanding of the present position of the market players.
- The report includes the analysis of the regional as well as global battery binder market trends, key players, market segments, application areas, and market growth strategies.
Key Market Segments
By Battery Type
- Lead Acid
- Nickel Cadmium
- Others
- Lithium-ion
By Material
- Polyvinylidene Fluoride
- Carboxymethyl Cellulose
- Polymethyl Methacrylate
- Styrene-butadiene Copolymer
- Others
By Region
- North America
- U.S.
- Canada
- Mexico
- Europe
- Germany
- UK
- France
- Italy
- Spain
- Rest of Europe
- Asia-Pacific
- China
- India
- Japan
- South Korea
- Australia
- Rest of Asia-Pacific
- LAMEA
- Brazil
- Saudi Arabia
- South Africa
- Rest of LAMEA
Key Market Players:
- BASF SE
- Targray
- Solvay S.A.
- SYNTHOMER PLC
- Daikin Industries, Ltd.
- The Lubrizol Corporation
- Trinseo S.A.
- Arkema
- Zeon Corporation
- Industrial Summit Technology Corp.
TABLE OF CONTENTS
CHAPTER 1: INTRODUCTION
- 1.1. Report description
- 1.2. Key market segments
- 1.3. Key benefits to the stakeholders
- 1.4. Research Methodology
- 1.4.1. Primary research
- 1.4.2. Secondary research
- 1.4.3. Analyst tools and models
CHAPTER 2: EXECUTIVE SUMMARY
- 2.1. CXO Perspective
CHAPTER 3: MARKET OVERVIEW
- 3.1. Market definition and scope
- 3.2. Key findings
- 3.2.1. Top impacting factors
- 3.2.2. Top investment pockets
- 3.3. Porter's five forces analysis
- 3.3.1. Bargaining power of suppliers
- 3.3.2. Bargaining power of buyers
- 3.3.3. Threat of substitutes
- 3.3.4. Threat of new entrants
- 3.3.5. Intensity of rivalry
- 3.4. Market dynamics
- 3.4.1. Drivers
- 3.4.1.1. Mechanical binding of battery binders
- 3.4.1.2. Rise in demand for multifunctional battery binders
- 3.4.1.3. Increase in demand for battery binders in electric vehicles
- 3.4.1. Drivers
- 3.4.2. Restraints
- 3.4.2.1. The affinity of binders to liquid electrolytes
- 3.4.3. Opportunities
- 3.4.3.1. Advancements in next-generation batteries
- 3.5. COVID-19 Impact Analysis on the market
- 3.6. Key Regulation Analysis
- 3.7. Market Share Analysis
- 3.8. Patent Landscape
- 3.9. Pricing Analysis
- 3.10. Value Chain Analysis
CHAPTER 4: BATTERY BINDER MARKET, BY BATTERY TYPE
- 4.1. Overview
- 4.1.1. Market size and forecast
- 4.2. Lithium-ion
- 4.2.1. Key market trends, growth factors and opportunities
- 4.2.2. Market size and forecast, by region
- 4.2.3. Market share analysis by country
- 4.3. Lead Acid
- 4.3.1. Key market trends, growth factors and opportunities
- 4.3.2. Market size and forecast, by region
- 4.3.3. Market share analysis by country
- 4.4. Nickel Cadmium
- 4.4.1. Key market trends, growth factors and opportunities
- 4.4.2. Market size and forecast, by region
- 4.4.3. Market share analysis by country
- 4.5. Others
- 4.5.1. Key market trends, growth factors and opportunities
- 4.5.2. Market size and forecast, by region
- 4.5.3. Market share analysis by country
CHAPTER 5: BATTERY BINDER MARKET, BY MATERIAL
- 5.1. Overview
- 5.1.1. Market size and forecast
- 5.2. Polyvinylidene Fluoride
- 5.2.1. Key market trends, growth factors and opportunities
- 5.2.2. Market size and forecast, by region
- 5.2.3. Market share analysis by country
- 5.3. Carboxymethyl Cellulose
- 5.3.1. Key market trends, growth factors and opportunities
- 5.3.2. Market size and forecast, by region
- 5.3.3. Market share analysis by country
- 5.4. Polymethyl Methacrylate
- 5.4.1. Key market trends, growth factors and opportunities
- 5.4.2. Market size and forecast, by region
- 5.4.3. Market share analysis by country
- 5.5. Styrene-butadiene Copolymer
- 5.5.1. Key market trends, growth factors and opportunities
- 5.5.2. Market size and forecast, by region
- 5.5.3. Market share analysis by country
- 5.6. Others
- 5.6.1. Key market trends, growth factors and opportunities
- 5.6.2. Market size and forecast, by region
- 5.6.3. Market share analysis by country
CHAPTER 6: BATTERY BINDER MARKET, BY REGION
- 6.1. Overview
- 6.1.1. Market size and forecast By Region
- 6.2. North America
- 6.2.1. Key trends and opportunities
- 6.2.2. Market size and forecast, by Battery Type
- 6.2.3. Market size and forecast, by Material
- 6.2.4. Market size and forecast, by country
- 6.2.4.1. U.S.
- 6.2.4.1.1. Key market trends, growth factors and opportunities
- 6.2.4.1.2. Market size and forecast, by Battery Type
- 6.2.4.1.3. Market size and forecast, by Material
- 6.2.4.2. Canada
- 6.2.4.2.1. Key market trends, growth factors and opportunities
- 6.2.4.2.2. Market size and forecast, by Battery Type
- 6.2.4.2.3. Market size and forecast, by Material
- 6.2.4.3. Mexico
- 6.2.4.3.1. Key market trends, growth factors and opportunities
- 6.2.4.3.2. Market size and forecast, by Battery Type
- 6.2.4.3.3. Market size and forecast, by Material
- 6.3. Europe
- 6.3.1. Key trends and opportunities
- 6.3.2. Market size and forecast, by Battery Type
- 6.3.3. Market size and forecast, by Material
- 6.3.4. Market size and forecast, by country
- 6.3.4.1. Germany
- 6.3.4.1.1. Key market trends, growth factors and opportunities
- 6.3.4.1.2. Market size and forecast, by Battery Type
- 6.3.4.1.3. Market size and forecast, by Material
- 6.3.4.2. UK
- 6.3.4.2.1. Key market trends, growth factors and opportunities
- 6.3.4.2.2. Market size and forecast, by Battery Type
- 6.3.4.2.3. Market size and forecast, by Material
- 6.3.4.3. France
- 6.3.4.3.1. Key market trends, growth factors and opportunities
- 6.3.4.3.2. Market size and forecast, by Battery Type
- 6.3.4.3.3. Market size and forecast, by Material
- 6.3.4.4. Italy
- 6.3.4.4.1. Key market trends, growth factors and opportunities
- 6.3.4.4.2. Market size and forecast, by Battery Type
- 6.3.4.4.3. Market size and forecast, by Material
- 6.3.4.5. Spain
- 6.3.4.5.1. Key market trends, growth factors and opportunities
- 6.3.4.5.2. Market size and forecast, by Battery Type
- 6.3.4.5.3. Market size and forecast, by Material
- 6.3.4.6. Rest of Europe
- 6.3.4.6.1. Key market trends, growth factors and opportunities
- 6.3.4.6.2. Market size and forecast, by Battery Type
- 6.3.4.6.3. Market size and forecast, by Material
- 6.4. Asia-Pacific
- 6.4.1. Key trends and opportunities
- 6.4.2. Market size and forecast, by Battery Type
- 6.4.3. Market size and forecast, by Material
- 6.4.4. Market size and forecast, by country
- 6.4.4.1. China
- 6.4.4.1.1. Key market trends, growth factors and opportunities
- 6.4.4.1.2. Market size and forecast, by Battery Type
- 6.4.4.1.3. Market size and forecast, by Material
- 6.4.4.2. India
- 6.4.4.2.1. Key market trends, growth factors and opportunities
- 6.4.4.2.2. Market size and forecast, by Battery Type
- 6.4.4.2.3. Market size and forecast, by Material
- 6.4.4.3. Japan
- 6.4.4.3.1. Key market trends, growth factors and opportunities
- 6.4.4.3.2. Market size and forecast, by Battery Type
- 6.4.4.3.3. Market size and forecast, by Material
- 6.4.4.4. South Korea
- 6.4.4.4.1. Key market trends, growth factors and opportunities
- 6.4.4.4.2. Market size and forecast, by Battery Type
- 6.4.4.4.3. Market size and forecast, by Material
- 6.4.4.5. Australia
- 6.4.4.5.1. Key market trends, growth factors and opportunities
- 6.4.4.5.2. Market size and forecast, by Battery Type
- 6.4.4.5.3. Market size and forecast, by Material
- 6.4.4.6. Rest of Asia-Pacific
- 6.4.4.6.1. Key market trends, growth factors and opportunities
- 6.4.4.6.2. Market size and forecast, by Battery Type
- 6.4.4.6.3. Market size and forecast, by Material
- 6.5. LAMEA
- 6.5.1. Key trends and opportunities
- 6.5.2. Market size and forecast, by Battery Type
- 6.5.3. Market size and forecast, by Material
- 6.5.4. Market size and forecast, by country
- 6.5.4.1. Brazil
- 6.5.4.1.1. Key market trends, growth factors and opportunities
- 6.5.4.1.2. Market size and forecast, by Battery Type
- 6.5.4.1.3. Market size and forecast, by Material
- 6.5.4.2. Saudi Arabia
- 6.5.4.2.1. Key market trends, growth factors and opportunities
- 6.5.4.2.2. Market size and forecast, by Battery Type
- 6.5.4.2.3. Market size and forecast, by Material
- 6.5.4.3. South Africa
- 6.5.4.3.1. Key market trends, growth factors and opportunities
- 6.5.4.3.2. Market size and forecast, by Battery Type
- 6.5.4.3.3. Market size and forecast, by Material
- 6.5.4.4. Rest of LAMEA
- 6.5.4.4.1. Key market trends, growth factors and opportunities
- 6.5.4.4.2. Market size and forecast, by Battery Type
- 6.5.4.4.3. Market size and forecast, by Material
CHAPTER 7: COMPETITIVE LANDSCAPE
- 7.1. Introduction
- 7.2. Top winning strategies
- 7.3. Product Mapping of Top 10 Player
- 7.4. Competitive Dashboard
- 7.5. Competitive Heatmap
- 7.6. Top player positioning, 2022
CHAPTER 8: COMPANY PROFILES
- 8.1. Arkema
- 8.1.1. Company overview
- 8.1.2. Key Executives
- 8.1.3. Company snapshot
- 8.1.4. Operating business segments
- 8.1.5. Product portfolio
- 8.1.6. Business performance
- 8.1.7. Key strategic moves and developments
- 8.2. The Lubrizol Corporation
- 8.2.1. Company overview
- 8.2.2. Key Executives
- 8.2.3. Company snapshot
- 8.2.4. Operating business segments
- 8.2.5. Product portfolio
- 8.2.6. Key strategic moves and developments
- 8.3. BASF SE
- 8.3.1. Company overview
- 8.3.2. Key Executives
- 8.3.3. Company snapshot
- 8.3.4. Operating business segments
- 8.3.5. Product portfolio
- 8.3.6. Business performance
- 8.3.7. Key strategic moves and developments
- 8.4. Solvay S.A.
- 8.4.1. Company overview
- 8.4.2. Key Executives
- 8.4.3. Company snapshot
- 8.4.4. Operating business segments
- 8.4.5. Product portfolio
- 8.4.6. Business performance
- 8.4.7. Key strategic moves and developments
- 8.5. Daikin Industries, Ltd.
- 8.5.1. Company overview
- 8.5.2. Key Executives
- 8.5.3. Company snapshot
- 8.5.4. Operating business segments
- 8.5.5. Product portfolio
- 8.5.6. Business performance
- 8.6. Zeon Corporation
- 8.6.1. Company overview
- 8.6.2. Key Executives
- 8.6.3. Company snapshot
- 8.6.4. Operating business segments
- 8.6.5. Product portfolio
- 8.6.6. Business performance
- 8.7. Targray
- 8.7.1. Company overview
- 8.7.2. Key Executives
- 8.7.3. Company snapshot
- 8.7.4. Operating business segments
- 8.7.5. Product portfolio
- 8.8. Industrial Summit Technology Corp.
- 8.8.1. Company overview
- 8.8.2. Key Executives
- 8.8.3. Company snapshot
- 8.8.4. Operating business segments
- 8.8.5. Product portfolio
- 8.9. SYNTHOMER PLC
- 8.9.1. Company overview
- 8.9.2. Key Executives
- 8.9.3. Company snapshot
- 8.9.4. Operating business segments
- 8.9.5. Product portfolio
- 8.9.6. Business performance
- 8.10. Trinseo S.A.
- 8.10.1. Company overview
- 8.10.2. Key Executives
- 8.10.3. Company snapshot
- 8.10.4. Operating business segments
- 8.10.5. Product portfolio
- 8.10.6. Business performance
- 8.10.7. Key strategic moves and developments
LIST OF TABLES
- TABLE 01. GLOBAL BATTERY BINDER MARKET, BY BATTERY TYPE, 2022-2032 ($MILLION)
- TABLE 02. GLOBAL BATTERY BINDER MARKET, BY BATTERY TYPE, 2022-2032 (KILOTON)
- TABLE 03. BATTERY BINDER MARKET FOR LITHIUM-ION, BY REGION, 2022-2032 ($MILLION)
- TABLE 04. BATTERY BINDER MARKET FOR LITHIUM-ION, BY REGION, 2022-2032 (KILOTON)
- TABLE 05. BATTERY BINDER MARKET FOR LEAD ACID, BY REGION, 2022-2032 ($MILLION)
- TABLE 06. BATTERY BINDER MARKET FOR LEAD ACID, BY REGION, 2022-2032 (KILOTON)
- TABLE 07. BATTERY BINDER MARKET FOR NICKEL CADMIUM, BY REGION, 2022-2032 ($MILLION)
- TABLE 08. BATTERY BINDER MARKET FOR NICKEL CADMIUM, BY REGION, 2022-2032 (KILOTON)
- TABLE 09. BATTERY BINDER MARKET FOR OTHERS, BY REGION, 2022-2032 ($MILLION)
- TABLE 10. BATTERY BINDER MARKET FOR OTHERS, BY REGION, 2022-2032 (KILOTON)
- TABLE 11. GLOBAL BATTERY BINDER MARKET, BY MATERIAL, 2022-2032 ($MILLION)
- TABLE 12. GLOBAL BATTERY BINDER MARKET, BY MATERIAL, 2022-2032 (KILOTON)
- TABLE 13. BATTERY BINDER MARKET FOR POLYVINYLIDENE FLUORIDE, BY REGION, 2022-2032 ($MILLION)
- TABLE 14. BATTERY BINDER MARKET FOR POLYVINYLIDENE FLUORIDE, BY REGION, 2022-2032 (KILOTON)
- TABLE 15. BATTERY BINDER MARKET FOR CARBOXYMETHYL CELLULOSE, BY REGION, 2022-2032 ($MILLION)
- TABLE 16. BATTERY BINDER MARKET FOR CARBOXYMETHYL CELLULOSE, BY REGION, 2022-2032 (KILOTON)
- TABLE 17. BATTERY BINDER MARKET FOR POLYMETHYL METHACRYLATE, BY REGION, 2022-2032 ($MILLION)
- TABLE 18. BATTERY BINDER MARKET FOR POLYMETHYL METHACRYLATE, BY REGION, 2022-2032 (KILOTON)
- TABLE 19. BATTERY BINDER MARKET FOR STYRENE-BUTADIENE COPOLYMER, BY REGION, 2022-2032 ($MILLION)
- TABLE 20. BATTERY BINDER MARKET FOR STYRENE-BUTADIENE COPOLYMER, BY REGION, 2022-2032 (KILOTON)
- TABLE 21. BATTERY BINDER MARKET FOR OTHERS, BY REGION, 2022-2032 ($MILLION)
- TABLE 22. BATTERY BINDER MARKET FOR OTHERS, BY REGION, 2022-2032 (KILOTON)
- TABLE 23. BATTERY BINDER MARKET, BY REGION, 2022-2032 ($MILLION)
- TABLE 24. BATTERY BINDER MARKET, BY REGION, 2022-2032 (KILOTON)
- TABLE 25. NORTH AMERICA BATTERY BINDER MARKET, BY BATTERY TYPE, 2022-2032 ($MILLION)
- TABLE 26. NORTH AMERICA BATTERY BINDER MARKET, BY BATTERY TYPE, 2022-2032 (KILOTON)
- TABLE 27. NORTH AMERICA BATTERY BINDER MARKET, BY MATERIAL, 2022-2032 ($MILLION)
- TABLE 28. NORTH AMERICA BATTERY BINDER MARKET, BY MATERIAL, 2022-2032 (KILOTON)
- TABLE 29. NORTH AMERICA BATTERY BINDER MARKET, BY COUNTRY, 2022-2032 ($MILLION)
- TABLE 30. NORTH AMERICA BATTERY BINDER MARKET, BY COUNTRY, 2022-2032 (KILOTON)
- TABLE 31. U.S. BATTERY BINDER MARKET, BY BATTERY TYPE, 2022-2032 ($MILLION)
- TABLE 32. U.S. BATTERY BINDER MARKET, BY BATTERY TYPE, 2022-2032 (KILOTON)
- TABLE 33. U.S. BATTERY BINDER MARKET, BY MATERIAL, 2022-2032 ($MILLION)
- TABLE 34. U.S. BATTERY BINDER MARKET, BY MATERIAL, 2022-2032 (KILOTON)
- TABLE 35. CANADA BATTERY BINDER MARKET, BY BATTERY TYPE, 2022-2032 ($MILLION)
- TABLE 36. CANADA BATTERY BINDER MARKET, BY BATTERY TYPE, 2022-2032 (KILOTON)
- TABLE 37. CANADA BATTERY BINDER MARKET, BY MATERIAL, 2022-2032 ($MILLION)
- TABLE 38. CANADA BATTERY BINDER MARKET, BY MATERIAL, 2022-2032 (KILOTON)
- TABLE 39. MEXICO BATTERY BINDER MARKET, BY BATTERY TYPE, 2022-2032 ($MILLION)
- TABLE 40. MEXICO BATTERY BINDER MARKET, BY BATTERY TYPE, 2022-2032 (KILOTON)
- TABLE 41. MEXICO BATTERY BINDER MARKET, BY MATERIAL, 2022-2032 ($MILLION)
- TABLE 42. MEXICO BATTERY BINDER MARKET, BY MATERIAL, 2022-2032 (KILOTON)
- TABLE 43. EUROPE BATTERY BINDER MARKET, BY BATTERY TYPE, 2022-2032 ($MILLION)
- TABLE 44. EUROPE BATTERY BINDER MARKET, BY BATTERY TYPE, 2022-2032 (KILOTON)
- TABLE 45. EUROPE BATTERY BINDER MARKET, BY MATERIAL, 2022-2032 ($MILLION)
- TABLE 46. EUROPE BATTERY BINDER MARKET, BY MATERIAL, 2022-2032 (KILOTON)
- TABLE 47. EUROPE BATTERY BINDER MARKET, BY COUNTRY, 2022-2032 ($MILLION)
- TABLE 48. EUROPE BATTERY BINDER MARKET, BY COUNTRY, 2022-2032 (KILOTON)
- TABLE 49. GERMANY BATTERY BINDER MARKET, BY BATTERY TYPE, 2022-2032 ($MILLION)
- TABLE 50. GERMANY BATTERY BINDER MARKET, BY BATTERY TYPE, 2022-2032 (KILOTON)
- TABLE 51. GERMANY BATTERY BINDER MARKET, BY MATERIAL, 2022-2032 ($MILLION)
- TABLE 52. GERMANY BATTERY BINDER MARKET, BY MATERIAL, 2022-2032 (KILOTON)
- TABLE 53. UK BATTERY BINDER MARKET, BY BATTERY TYPE, 2022-2032 ($MILLION)
- TABLE 54. UK BATTERY BINDER MARKET, BY BATTERY TYPE, 2022-2032 (KILOTON)
- TABLE 55. UK BATTERY BINDER MARKET, BY MATERIAL, 2022-2032 ($MILLION)
- TABLE 56. UK BATTERY BINDER MARKET, BY MATERIAL, 2022-2032 (KILOTON)
- TABLE 57. FRANCE BATTERY BINDER MARKET, BY BATTERY TYPE, 2022-2032 ($MILLION)
- TABLE 58. FRANCE BATTERY BINDER MARKET, BY BATTERY TYPE, 2022-2032 (KILOTON)
- TABLE 59. FRANCE BATTERY BINDER MARKET, BY MATERIAL, 2022-2032 ($MILLION)
- TABLE 60. FRANCE BATTERY BINDER MARKET, BY MATERIAL, 2022-2032 (KILOTON)
- TABLE 61. ITALY BATTERY BINDER MARKET, BY BATTERY TYPE, 2022-2032 ($MILLION)
- TABLE 62. ITALY BATTERY BINDER MARKET, BY BATTERY TYPE, 2022-2032 (KILOTON)
- TABLE 63. ITALY BATTERY BINDER MARKET, BY MATERIAL, 2022-2032 ($MILLION)
- TABLE 64. ITALY BATTERY BINDER MARKET, BY MATERIAL, 2022-2032 (KILOTON)
- TABLE 65. SPAIN BATTERY BINDER MARKET, BY BATTERY TYPE, 2022-2032 ($MILLION)
- TABLE 66. SPAIN BATTERY BINDER MARKET, BY BATTERY TYPE, 2022-2032 (KILOTON)
- TABLE 67. SPAIN BATTERY BINDER MARKET, BY MATERIAL, 2022-2032 ($MILLION)
- TABLE 68. SPAIN BATTERY BINDER MARKET, BY MATERIAL, 2022-2032 (KILOTON)
- TABLE 69. REST OF EUROPE BATTERY BINDER MARKET, BY BATTERY TYPE, 2022-2032 ($MILLION)
- TABLE 70. REST OF EUROPE BATTERY BINDER MARKET, BY BATTERY TYPE, 2022-2032 (KILOTON)
- TABLE 71. REST OF EUROPE BATTERY BINDER MARKET, BY MATERIAL, 2022-2032 ($MILLION)
- TABLE 72. REST OF EUROPE BATTERY BINDER MARKET, BY MATERIAL, 2022-2032 (KILOTON)
- TABLE 73. ASIA-PACIFIC BATTERY BINDER MARKET, BY BATTERY TYPE, 2022-2032 ($MILLION)
- TABLE 74. ASIA-PACIFIC BATTERY BINDER MARKET, BY BATTERY TYPE, 2022-2032 (KILOTON)
- TABLE 75. ASIA-PACIFIC BATTERY BINDER MARKET, BY MATERIAL, 2022-2032 ($MILLION)
- TABLE 76. ASIA-PACIFIC BATTERY BINDER MARKET, BY MATERIAL, 2022-2032 (KILOTON)
- TABLE 77. ASIA-PACIFIC BATTERY BINDER MARKET, BY COUNTRY, 2022-2032 ($MILLION)
- TABLE 78. ASIA-PACIFIC BATTERY BINDER MARKET, BY COUNTRY, 2022-2032 (KILOTON)
- TABLE 79. CHINA BATTERY BINDER MARKET, BY BATTERY TYPE, 2022-2032 ($MILLION)
- TABLE 80. CHINA BATTERY BINDER MARKET, BY BATTERY TYPE, 2022-2032 (KILOTON)
- TABLE 81. CHINA BATTERY BINDER MARKET, BY MATERIAL, 2022-2032 ($MILLION)
- TABLE 82. CHINA BATTERY BINDER MARKET, BY MATERIAL, 2022-2032 (KILOTON)
- TABLE 83. INDIA BATTERY BINDER MARKET, BY BATTERY TYPE, 2022-2032 ($MILLION)
- TABLE 84. INDIA BATTERY BINDER MARKET, BY BATTERY TYPE, 2022-2032 (KILOTON)
- TABLE 85. INDIA BATTERY BINDER MARKET, BY MATERIAL, 2022-2032 ($MILLION)
- TABLE 86. INDIA BATTERY BINDER MARKET, BY MATERIAL, 2022-2032 (KILOTON)
- TABLE 87. JAPAN BATTERY BINDER MARKET, BY BATTERY TYPE, 2022-2032 ($MILLION)
- TABLE 88. JAPAN BATTERY BINDER MARKET, BY BATTERY TYPE, 2022-2032 (KILOTON)
- TABLE 89. JAPAN BATTERY BINDER MARKET, BY MATERIAL, 2022-2032 ($MILLION)
- TABLE 90. JAPAN BATTERY BINDER MARKET, BY MATERIAL, 2022-2032 (KILOTON)
- TABLE 91. SOUTH KOREA BATTERY BINDER MARKET, BY BATTERY TYPE, 2022-2032 ($MILLION)
- TABLE 92. SOUTH KOREA BATTERY BINDER MARKET, BY BATTERY TYPE, 2022-2032 (KILOTON)
- TABLE 93. SOUTH KOREA BATTERY BINDER MARKET, BY MATERIAL, 2022-2032 ($MILLION)
- TABLE 94. SOUTH KOREA BATTERY BINDER MARKET, BY MATERIAL, 2022-2032 (KILOTON)
- TABLE 95. AUSTRALIA BATTERY BINDER MARKET, BY BATTERY TYPE, 2022-2032 ($MILLION)
- TABLE 96. AUSTRALIA BATTERY BINDER MARKET, BY BATTERY TYPE, 2022-2032 (KILOTON)
- TABLE 97. AUSTRALIA BATTERY BINDER MARKET, BY MATERIAL, 2022-2032 ($MILLION)
- TABLE 98. AUSTRALIA BATTERY BINDER MARKET, BY MATERIAL, 2022-2032 (KILOTON)
- TABLE 99. REST OF ASIA-PACIFIC BATTERY BINDER MARKET, BY BATTERY TYPE, 2022-2032 ($MILLION)
- TABLE 100. REST OF ASIA-PACIFIC BATTERY BINDER MARKET, BY BATTERY TYPE, 2022-2032 (KILOTON)
- TABLE 101. REST OF ASIA-PACIFIC BATTERY BINDER MARKET, BY MATERIAL, 2022-2032 ($MILLION)
- TABLE 102. REST OF ASIA-PACIFIC BATTERY BINDER MARKET, BY MATERIAL, 2022-2032 (KILOTON)
- TABLE 103. LAMEA BATTERY BINDER MARKET, BY BATTERY TYPE, 2022-2032 ($MILLION)
- TABLE 104. LAMEA BATTERY BINDER MARKET, BY BATTERY TYPE, 2022-2032 (KILOTON)
- TABLE 105. LAMEA BATTERY BINDER MARKET, BY MATERIAL, 2022-2032 ($MILLION)
- TABLE 106. LAMEA BATTERY BINDER MARKET, BY MATERIAL, 2022-2032 (KILOTON)
- TABLE 107. LAMEA BATTERY BINDER MARKET, BY COUNTRY, 2022-2032 ($MILLION)
- TABLE 108. LAMEA BATTERY BINDER MARKET, BY COUNTRY, 2022-2032 (KILOTON)
- TABLE 109. BRAZIL BATTERY BINDER MARKET, BY BATTERY TYPE, 2022-2032 ($MILLION)
- TABLE 110. BRAZIL BATTERY BINDER MARKET, BY BATTERY TYPE, 2022-2032 (KILOTON)
- TABLE 111. BRAZIL BATTERY BINDER MARKET, BY MATERIAL, 2022-2032 ($MILLION)
- TABLE 112. BRAZIL BATTERY BINDER MARKET, BY MATERIAL, 2022-2032 (KILOTON)
- TABLE 113. SAUDI ARABIA BATTERY BINDER MARKET, BY BATTERY TYPE, 2022-2032 ($MILLION)
- TABLE 114. SAUDI ARABIA BATTERY BINDER MARKET, BY BATTERY TYPE, 2022-2032 (KILOTON)
- TABLE 115. SAUDI ARABIA BATTERY BINDER MARKET, BY MATERIAL, 2022-2032 ($MILLION)
- TABLE 116. SAUDI ARABIA BATTERY BINDER MARKET, BY MATERIAL, 2022-2032 (KILOTON)
- TABLE 117. SOUTH AFRICA BATTERY BINDER MARKET, BY BATTERY TYPE, 2022-2032 ($MILLION)
- TABLE 118. SOUTH AFRICA BATTERY BINDER MARKET, BY BATTERY TYPE, 2022-2032 (KILOTON)
- TABLE 119. SOUTH AFRICA BATTERY BINDER MARKET, BY MATERIAL, 2022-2032 ($MILLION)
- TABLE 120. SOUTH AFRICA BATTERY BINDER MARKET, BY MATERIAL, 2022-2032 (KILOTON)
- TABLE 121. REST OF LAMEA BATTERY BINDER MARKET, BY BATTERY TYPE, 2022-2032 ($MILLION)
- TABLE 122. REST OF LAMEA BATTERY BINDER MARKET, BY BATTERY TYPE, 2022-2032 (KILOTON)
- TABLE 123. REST OF LAMEA BATTERY BINDER MARKET, BY MATERIAL, 2022-2032 ($MILLION)
- TABLE 124. REST OF LAMEA BATTERY BINDER MARKET, BY MATERIAL, 2022-2032 (KILOTON)
- TABLE 125. ARKEMA: KEY EXECUTIVES
- TABLE 126. ARKEMA: COMPANY SNAPSHOT
- TABLE 127. ARKEMA: PRODUCT SEGMENTS
- TABLE 128. ARKEMA: PRODUCT PORTFOLIO
- TABLE 129. ARKEMA: KEY STRATERGIES
- TABLE 130. THE LUBRIZOL CORPORATION: KEY EXECUTIVES
- TABLE 131. THE LUBRIZOL CORPORATION: COMPANY SNAPSHOT
- TABLE 132. THE LUBRIZOL CORPORATION: PRODUCT SEGMENTS
- TABLE 133. THE LUBRIZOL CORPORATION: PRODUCT PORTFOLIO
- TABLE 134. THE LUBRIZOL CORPORATION: KEY STRATERGIES
- TABLE 135. BASF SE: KEY EXECUTIVES
- TABLE 136. BASF SE: COMPANY SNAPSHOT
- TABLE 137. BASF SE: PRODUCT SEGMENTS
- TABLE 138. BASF SE: PRODUCT PORTFOLIO
- TABLE 139. BASF SE: KEY STRATERGIES
- TABLE 140. SOLVAY S.A.: KEY EXECUTIVES
- TABLE 141. SOLVAY S.A.: COMPANY SNAPSHOT
- TABLE 142. SOLVAY S.A.: PRODUCT SEGMENTS
- TABLE 143. SOLVAY S.A.: PRODUCT PORTFOLIO
- TABLE 144. SOLVAY S.A.: KEY STRATERGIES
- TABLE 145. DAIKIN INDUSTRIES, LTD.: KEY EXECUTIVES
- TABLE 146. DAIKIN INDUSTRIES, LTD.: COMPANY SNAPSHOT
- TABLE 147. DAIKIN INDUSTRIES, LTD.: PRODUCT SEGMENTS
- TABLE 148. DAIKIN INDUSTRIES, LTD.: PRODUCT PORTFOLIO
- TABLE 149. ZEON CORPORATION: KEY EXECUTIVES
- TABLE 150. ZEON CORPORATION: COMPANY SNAPSHOT
- TABLE 151. ZEON CORPORATION: PRODUCT SEGMENTS
- TABLE 152. ZEON CORPORATION: PRODUCT PORTFOLIO
- TABLE 153. TARGRAY: KEY EXECUTIVES
- TABLE 154. TARGRAY: COMPANY SNAPSHOT
- TABLE 155. TARGRAY: PRODUCT SEGMENTS
- TABLE 156. TARGRAY: PRODUCT PORTFOLIO
- TABLE 157. INDUSTRIAL SUMMIT TECHNOLOGY CORP.: KEY EXECUTIVES
- TABLE 158. INDUSTRIAL SUMMIT TECHNOLOGY CORP.: COMPANY SNAPSHOT
- TABLE 159. INDUSTRIAL SUMMIT TECHNOLOGY CORP.: PRODUCT SEGMENTS
- TABLE 160. INDUSTRIAL SUMMIT TECHNOLOGY CORP.: PRODUCT PORTFOLIO
- TABLE 161. SYNTHOMER PLC: KEY EXECUTIVES
- TABLE 162. SYNTHOMER PLC: COMPANY SNAPSHOT
- TABLE 163. SYNTHOMER PLC: PRODUCT SEGMENTS
- TABLE 164. SYNTHOMER PLC: PRODUCT PORTFOLIO
- TABLE 165. TRINSEO S.A.: KEY EXECUTIVES
- TABLE 166. TRINSEO S.A.: COMPANY SNAPSHOT
- TABLE 167. TRINSEO S.A.: PRODUCT SEGMENTS
- TABLE 168. TRINSEO S.A.: PRODUCT PORTFOLIO
- TABLE 169. TRINSEO S.A.: KEY STRATERGIES
LIST OF FIGURES
- FIGURE 01. BATTERY BINDER MARKET, 2022-2032
- FIGURE 02. SEGMENTATION OF BATTERY BINDER MARKET, 2022-2032
- FIGURE 03. TOP INVESTMENT POCKETS IN BATTERY BINDER MARKET (2023-2032)
- FIGURE 04. HIGH BARGAINING POWER OF SUPPLIERS
- FIGURE 05. MODERATE BARGAINING POWER OF BUYERS
- FIGURE 06. MODERATE THREAT OF SUBSTITUTES
- FIGURE 07. HIGH THREAT OF NEW ENTRANTS
- FIGURE 08. HIGH INTENSITY OF RIVALRY
- FIGURE 09. DRIVERS, RESTRAINTS AND OPPORTUNITIES: GLOBALBATTERY BINDER MARKET
- FIGURE 10. IMPACT OF KEY REGULATION: BATTERY BINDER MARKET
- FIGURE 11. MARKET SHARE ANALYSIS: BATTERY BINDER MARKET
- FIGURE 12. PATENT ANALYSIS BY COMPANY
- FIGURE 13. PATENT ANALYSIS BY COUNTRY
- FIGURE 14. PRICING ANALYSIS: BATTERY BINDER MARKET 2022 AND 2032
- FIGURE 15. VALUE CHAIN ANALYSIS: BATTERY BINDER MARKET
- FIGURE 16. BATTERY BINDER MARKET, BY BATTERY TYPE, 2022(%)
- FIGURE 17. COMPARATIVE SHARE ANALYSIS OF BATTERY BINDER MARKET FOR LITHIUM-ION, BY COUNTRY 2022 AND 2032(%)
- FIGURE 18. COMPARATIVE SHARE ANALYSIS OF BATTERY BINDER MARKET FOR LEAD ACID, BY COUNTRY 2022 AND 2032(%)
- FIGURE 19. COMPARATIVE SHARE ANALYSIS OF BATTERY BINDER MARKET FOR NICKEL CADMIUM, BY COUNTRY 2022 AND 2032(%)
- FIGURE 20. COMPARATIVE SHARE ANALYSIS OF BATTERY BINDER MARKET FOR OTHERS, BY COUNTRY 2022 AND 2032(%)
- FIGURE 21. BATTERY BINDER MARKET, BY MATERIAL, 2022(%)
- FIGURE 22. COMPARATIVE SHARE ANALYSIS OF BATTERY BINDER MARKET FOR POLYVINYLIDENE FLUORIDE, BY COUNTRY 2022 AND 2032(%)
- FIGURE 23. COMPARATIVE SHARE ANALYSIS OF BATTERY BINDER MARKET FOR CARBOXYMETHYL CELLULOSE, BY COUNTRY 2022 AND 2032(%)
- FIGURE 24. COMPARATIVE SHARE ANALYSIS OF BATTERY BINDER MARKET FOR POLYMETHYL METHACRYLATE, BY COUNTRY 2022 AND 2032(%)
- FIGURE 25. COMPARATIVE SHARE ANALYSIS OF BATTERY BINDER MARKET FOR STYRENE-BUTADIENE COPOLYMER, BY COUNTRY 2022 AND 2032(%)
- FIGURE 26. COMPARATIVE SHARE ANALYSIS OF BATTERY BINDER MARKET FOR OTHERS, BY COUNTRY 2022 AND 2032(%)
- FIGURE 27. BATTERY BINDER MARKET BY REGION, 2022
- FIGURE 28. U.S. BATTERY BINDER MARKET, 2022-2032 ($MILLION)
- FIGURE 29. CANADA BATTERY BINDER MARKET, 2022-2032 ($MILLION)
- FIGURE 30. MEXICO BATTERY BINDER MARKET, 2022-2032 ($MILLION)
- FIGURE 31. GERMANY BATTERY BINDER MARKET, 2022-2032 ($MILLION)
- FIGURE 32. UK BATTERY BINDER MARKET, 2022-2032 ($MILLION)
- FIGURE 33. FRANCE BATTERY BINDER MARKET, 2022-2032 ($MILLION)
- FIGURE 34. ITALY BATTERY BINDER MARKET, 2022-2032 ($MILLION)
- FIGURE 35. SPAIN BATTERY BINDER MARKET, 2022-2032 ($MILLION)
- FIGURE 36. REST OF EUROPE BATTERY BINDER MARKET, 2022-2032 ($MILLION)
- FIGURE 37. CHINA BATTERY BINDER MARKET, 2022-2032 ($MILLION)
- FIGURE 38. INDIA BATTERY BINDER MARKET, 2022-2032 ($MILLION)
- FIGURE 39. JAPAN BATTERY BINDER MARKET, 2022-2032 ($MILLION)
- FIGURE 40. SOUTH KOREA BATTERY BINDER MARKET, 2022-2032 ($MILLION)
- FIGURE 41. AUSTRALIA BATTERY BINDER MARKET, 2022-2032 ($MILLION)
- FIGURE 42. REST OF ASIA-PACIFIC BATTERY BINDER MARKET, 2022-2032 ($MILLION)
- FIGURE 43. BRAZIL BATTERY BINDER MARKET, 2022-2032 ($MILLION)
- FIGURE 44. SAUDI ARABIA BATTERY BINDER MARKET, 2022-2032 ($MILLION)
- FIGURE 45. SOUTH AFRICA BATTERY BINDER MARKET, 2022-2032 ($MILLION)
- FIGURE 46. REST OF LAMEA BATTERY BINDER MARKET, 2022-2032 ($MILLION)
- FIGURE 47. TOP WINNING STRATEGIES, BY YEAR
- FIGURE 48. TOP WINNING STRATEGIES, BY DEVELOPMENT
- FIGURE 49. TOP WINNING STRATEGIES, BY COMPANY
- FIGURE 50. PRODUCT MAPPING OF TOP 10 PLAYERS
- FIGURE 51. COMPETITIVE DASHBOARD
- FIGURE 52. COMPETITIVE HEATMAP: BATTERY BINDER MARKET
- FIGURE 53. TOP PLAYER POSITIONING, 2022
- FIGURE 54. ARKEMA: NET SALES, 2019-2021 ($MILLION)
- FIGURE 55. BASF SE: NET SALES, 2020-2022 ($MILLION)
- FIGURE 56. BASF SE: RESEARCH & DEVELOPMENT EXPENDITURE, 2020-2022 ($MILLION)
- FIGURE 57. BASF SE: REVENUE SHARE BY SEGMENT, 2022 (%)
- FIGURE 58. BASF SE: REVENUE SHARE BY REGION, 2022 (%)
- FIGURE 59. SOLVAY S.A.: NET REVENUE, 2019-2021 ($MILLION)
- FIGURE 60. SOLVAY S.A.: REVENUE SHARE BY SEGMENT, 2021 (%)
- FIGURE 61. SOLVAY S.A.: REVENUE SHARE BY REGION, 2021 (%)
- FIGURE 62. DAIKIN INDUSTRIES, LTD.: NET SALES, 2020-2022 ($MILLION)
- FIGURE 63. DAIKIN INDUSTRIES, LTD.: RESEARCH & DEVELOPMENT EXPENDITURE, 2020-2022 ($MILLION)
- FIGURE 64. DAIKIN INDUSTRIES, LTD.: REVENUE SHARE BY SEGMENT, 2022 (%)
- FIGURE 65. DAIKIN INDUSTRIES, LTD.: REVENUE SHARE BY REGION, 2022 (%)
- FIGURE 66. ZEON CORPORATION: NET REVENUE, 2020-2022 ($MILLION)
- FIGURE 67. ZEON CORPORATION: REVENUE SHARE BY SEGMENT, 2022 (%)
- FIGURE 68. ZEON CORPORATION: REVENUE SHARE BY REGION, 2022 (%)
- FIGURE 69. SYNTHOMER PLC: NET REVENUE, 2020-2022 ($MILLION)
- FIGURE 70. SYNTHOMER PLC: REVENUE SHARE BY SEGMENT, 2022 (%)
- FIGURE 71. TRINSEO S.A.: NET SALES, 2019-2021 ($MILLION)
- FIGURE 72. TRINSEO S.A.: REVENUE SHARE BY SEGMENT, 2021 (%)
- FIGURE 73. TRINSEO S.A.: REVENUE SHARE BY REGION, 2021 (%)

