
PUBLISHER: Allied Market Research | PRODUCT CODE: 1344471

PUBLISHER: Allied Market Research | PRODUCT CODE: 1344471
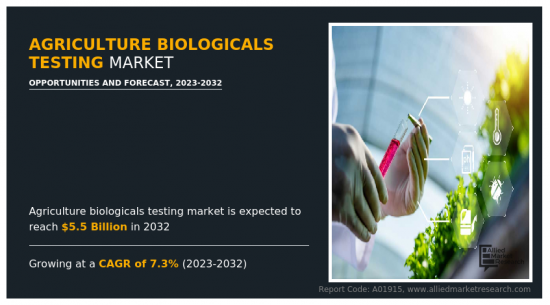
Agriculture Biologicals Testing Market By Product Type, By End-User : Global Opportunity Analysis and Industry Forecast, 2023-2032
According to a new report published by Allied Market Research, titled, "Agriculture Biologicals Testing Market," The agriculture biologicals testing market was valued at $2.7 billion in 2022, and is estimated to reach $5.5 billion by 2032, growing at a CAGR of 7.3% from 2023 to 2032.
The growth in the agricultural biological testing market is increasing due to a surge in demand for high-quality food products. Consumers are becoming more aware of the health benefits of eating organic and natural foods and are willing to pay a premium for such products. Therefore, farmers are increasingly trying to produce good products that are free of toxins and pollutants.
Agricultural biological testing is an important part of modern agriculture. The purpose of the assessment is to enable farmers to grow chemical free products. By doing these tests, farmers can identify potential problems before they develop into full-blown diseases that can damage crops. Agricultural biological testing helps control food safety and quality. This is especially important in the global food industry, where food safety regulations are strict.
Testing helps to prevent the spread of plant diseases and pests. Inspections can catch diseases and pests before they spread, enabling farmers to take action before they cause serious damage to crops. This is important because once an infestation or pest is established, it can be difficult and expensive to remove. Additionally, testing can help farmers decide on the best treatments for certain diseases or pests and reduce the use of pesticides and other chemicals in the process. Moreover, it helps increase crop yield and reduce crop loss. By identifying potential problems before they become serious problems, farmers can take steps to protect their crops and increase yields. This helps increase food production and reduce food insecurity in food-insecure areas. By protecting crops from pests and diseases, farmers can increase their income and improve their health.
Increasing demand for high-quality agricultural products has increased the demand for the agricultural biological testing market. Farmers are looking for ways to improve their crops to meet consumer demand, leading to an increase in chemical testing. By assessing the quality of their crops, farmers can ensure that they are producing quality products that meet the needs of the market. Additionally, agriculture biological farming can help identify the best crops and materials for good crops. This includes testing soil quality, determining the presence of pests and diseases, and testing the effectiveness of fertilizers and other inputs. This information can be used to make informed product management decisions.
The need for disease and pest management has led to a surge in the market demand for the biological testing market. Agriculture biological testing plays an important role in the detection, identification, and control of pests and diseases that can harm crops, animals, and humans. With the increasing demand for good and safe food, the bioassay industry has become an essential part of ensuring the safety of food and agricultural products. In addition, increasing international trade and travel increase the emergence of new and exotic diseases, making disease diagnosis and control difficult. In this context, biological testing has become an important tool in the detection and control of diseases, especially in the early stages. In addition, the use of bioassays in the pharmaceutical industry is increasing for the development of new drugs and vaccines.
The growing need for sustainable crop production has increased the demand for the agriculture biological testing industry. As the population grows, more crops must be produced with fewer resources, while the use of chemicals and fertilizers leads to environmental degradation. As a result, there has been a shift toward sustainable crop production, which includes the use of chemicals to ensure healthy and good crops. Testing helps identify diseases and pests that can affect crops, thereby improving crop production. Additionally, increasing demand for organic food has led to the use of agriculture biological testing to detect pesticides and other harmful chemicals in food. This trend creates a significant business opportunity for companies offering bioanalysis solutions. As a result, market demand for agriculture biological testing has increased and this trend is expected to surge during the forecast period.
Moreover, agricultural biological testing helps protect the environment. By reducing the use of pesticides and other chemicals in agriculture, experiments can help reduce the negative effects of these chemicals on the environment. Also, by preventing the spread of pests and diseases, experiments can reduce the need for land clearing and other agricultural practices that cause damage to forests and habitats. Agricultural biological testing contributes to sustainable agriculture. Sustainable agriculture is a method that focuses on balancing the economic, social, and environmental aspects to ensure the long-term sustainability of agriculture. Experiments can contribute to sustainable agriculture by reducing the use of pesticides and other chemicals, reducing the negative effects of these chemicals on the environment, and promoting the use of green farming practices.
The agriculture biological testing market is segmented into product type, end-user, and region. By product type, the market is bifurcated into bio pesticides, bio fertilizers, bio stimulants. As per end-user, the market is divided into biological product manufacturers, government agencies, plant breeders, and outsourced contract research organization. Region-wise, the market is analyzed across North America (the U.S., Canada, and Mexico), Europe (Germany, UK, France, Russia, Spain, Italy, and the rest of Europe), Asia-Pacific (China, Japan, South Korea, India, Australia, and rest of Asia-Pacific), and LAMEA (Latin America, Middle East, Africa).
The players in the agriculture biological testing market have adopted acquisition, business expansion, partnership, collaboration, and product launch as their key development strategies to increase profitability and improve their position in the market. Some of the key players profiled in the agriculture biological testing market analysis include SGS SA, Eurofins Scientific, Bionema Limited, Anadiag Group, Syntech Research Group, Staphyt SA, Laus GmbH, ALS Limited, RJ Hill Laboratories Limited, Eurofins APAL Pty Ltd.
Key Benefits For Stakeholders
- This report provides a quantitative analysis of the market segments, current trends, estimations, and dynamics of the agriculture biologicals testing market analysis from 2022 to 2032 to identify the prevailing agriculture biologicals testing market opportunities.
- The market research is offered along with information related to key drivers, restraints, and opportunities.
- Porter's five forces analysis highlights the potency of buyers and suppliers to enable stakeholders make profit-oriented business decisions and strengthen their supplier-buyer network.
- In-depth analysis of the agriculture biologicals testing market segmentation assists to determine the prevailing market opportunities.
- Major countries in each region are mapped according to their revenue contribution to the global market.
- Market player positioning facilitates benchmarking and provides a clear understanding of the present position of the market players.
- The report includes the analysis of the regional as well as global agriculture biologicals testing market trends, key players, market segments, application areas, and market growth strategies.
Key Market Segments
By Product Type
- Bio pesticides
- Bio fertilizers
- Bio stimulants
By End-User
- Government Agencies
- Plant Breeders
- Outsourced Contract Research Organization
- Biological Product Manufacturers
By Region
- North America
- U.S.
- Canada
- Mexico
- Europe
- Germany
- UK
- France
- Russia
- Spain
- Italy
- Rest of Europe
- Asia-Pacific
- China
- Japan
- South Korea
- India
- Australia
- Rest Of Asia Pacafic
- LAMEA
- Latin America
- Middle East
- Africa
Key Market Players:
- ALS Limited
- Anadiag Group
- Bionema Limited
- Eurofins APAL Pty Ltd
- Eurofins Scientific
- Laus GmbH
- RJ Hill Laboratories Limited
- SGS SA
- Staphyt SA
- Syntech Research Group
TABLE OF CONTENTS
CHAPTER 1: INTRODUCTION
- 1.1. Report description
- 1.2. Key market segments
- 1.3. Key benefits to the stakeholders
- 1.4. Research Methodology
- 1.4.1. Primary research
- 1.4.2. Secondary research
- 1.4.3. Analyst tools and models
CHAPTER 2: EXECUTIVE SUMMARY
- 2.1. CXO Perspective
CHAPTER 3: MARKET OVERVIEW
- 3.1. Market definition and scope
- 3.2. Key findings
- 3.2.1. Top impacting factors
- 3.2.2. Top investment pockets
- 3.3. Porter's five forces analysis
- 3.3.1. Bargaining power of suppliers
- 3.3.2. Bargaining power of buyers
- 3.3.3. Threat of substitutes
- 3.3.4. Threat of new entrants
- 3.3.5. Intensity of rivalry
- 3.4. Market dynamics
- 3.4.1. Drivers
- 3.4.1.1. Increased adoption of molecular diagnostics
- 3.4.1.2. The growing importance of soil testing
- 3.4.1.3. Increased use of biopesticides and biofertilizers
- 3.4.1.4. Expansion of the organic food industry
- 3.4.1. Drivers
- 3.4.2. Restraints
- 3.4.2.1. Limited infrastructure
- 3.4.2.2. Cultural and linguistic barriers
- 3.4.3. Opportunities
- 3.4.3.1. Biological pest control
- 3.4.3.2. Plant tissue testing
- 3.4.3.3. Nutrient management planning
- 3.5. COVID-19 Impact Analysis on the market
CHAPTER 4: AGRICULTURE BIOLOGICALS TESTING MARKET, BY PRODUCT TYPE
- 4.1. Overview
- 4.1.1. Market size and forecast
- 4.2. Bio pesticides
- 4.2.1. Key market trends, growth factors and opportunities
- 4.2.2. Market size and forecast, by region
- 4.2.3. Market share analysis by country
- 4.3. Bio fertilizers
- 4.3.1. Key market trends, growth factors and opportunities
- 4.3.2. Market size and forecast, by region
- 4.3.3. Market share analysis by country
- 4.4. Bio stimulants
- 4.4.1. Key market trends, growth factors and opportunities
- 4.4.2. Market size and forecast, by region
- 4.4.3. Market share analysis by country
CHAPTER 5: AGRICULTURE BIOLOGICALS TESTING MARKET, BY END-USER
- 5.1. Overview
- 5.1.1. Market size and forecast
- 5.2. Biological Product Manufacturers
- 5.2.1. Key market trends, growth factors and opportunities
- 5.2.2. Market size and forecast, by region
- 5.2.3. Market share analysis by country
- 5.3. Government Agencies
- 5.3.1. Key market trends, growth factors and opportunities
- 5.3.2. Market size and forecast, by region
- 5.3.3. Market share analysis by country
- 5.4. Plant Breeders
- 5.4.1. Key market trends, growth factors and opportunities
- 5.4.2. Market size and forecast, by region
- 5.4.3. Market share analysis by country
- 5.5. Outsourced Contract Research Organization
- 5.5.1. Key market trends, growth factors and opportunities
- 5.5.2. Market size and forecast, by region
- 5.5.3. Market share analysis by country
CHAPTER 6: AGRICULTURE BIOLOGICALS TESTING MARKET, BY REGION
- 6.1. Overview
- 6.1.1. Market size and forecast By Region
- 6.2. North America
- 6.2.1. Key trends and opportunities
- 6.2.2. Market size and forecast, by Product Type
- 6.2.3. Market size and forecast, by End-User
- 6.2.4. Market size and forecast, by country
- 6.2.4.1. U.S.
- 6.2.4.1.1. Key market trends, growth factors and opportunities
- 6.2.4.1.2. Market size and forecast, by Product Type
- 6.2.4.1.3. Market size and forecast, by End-User
- 6.2.4.2. Canada
- 6.2.4.2.1. Key market trends, growth factors and opportunities
- 6.2.4.2.2. Market size and forecast, by Product Type
- 6.2.4.2.3. Market size and forecast, by End-User
- 6.2.4.3. Mexico
- 6.2.4.3.1. Key market trends, growth factors and opportunities
- 6.2.4.3.2. Market size and forecast, by Product Type
- 6.2.4.3.3. Market size and forecast, by End-User
- 6.3. Europe
- 6.3.1. Key trends and opportunities
- 6.3.2. Market size and forecast, by Product Type
- 6.3.3. Market size and forecast, by End-User
- 6.3.4. Market size and forecast, by country
- 6.3.4.1. Germany
- 6.3.4.1.1. Key market trends, growth factors and opportunities
- 6.3.4.1.2. Market size and forecast, by Product Type
- 6.3.4.1.3. Market size and forecast, by End-User
- 6.3.4.2. UK
- 6.3.4.2.1. Key market trends, growth factors and opportunities
- 6.3.4.2.2. Market size and forecast, by Product Type
- 6.3.4.2.3. Market size and forecast, by End-User
- 6.3.4.3. France
- 6.3.4.3.1. Key market trends, growth factors and opportunities
- 6.3.4.3.2. Market size and forecast, by Product Type
- 6.3.4.3.3. Market size and forecast, by End-User
- 6.3.4.4. Russia
- 6.3.4.4.1. Key market trends, growth factors and opportunities
- 6.3.4.4.2. Market size and forecast, by Product Type
- 6.3.4.4.3. Market size and forecast, by End-User
- 6.3.4.5. Spain
- 6.3.4.5.1. Key market trends, growth factors and opportunities
- 6.3.4.5.2. Market size and forecast, by Product Type
- 6.3.4.5.3. Market size and forecast, by End-User
- 6.3.4.6. Italy
- 6.3.4.6.1. Key market trends, growth factors and opportunities
- 6.3.4.6.2. Market size and forecast, by Product Type
- 6.3.4.6.3. Market size and forecast, by End-User
- 6.3.4.7. Rest of Europe
- 6.3.4.7.1. Key market trends, growth factors and opportunities
- 6.3.4.7.2. Market size and forecast, by Product Type
- 6.3.4.7.3. Market size and forecast, by End-User
- 6.4. Asia-Pacific
- 6.4.1. Key trends and opportunities
- 6.4.2. Market size and forecast, by Product Type
- 6.4.3. Market size and forecast, by End-User
- 6.4.4. Market size and forecast, by country
- 6.4.4.1. China
- 6.4.4.1.1. Key market trends, growth factors and opportunities
- 6.4.4.1.2. Market size and forecast, by Product Type
- 6.4.4.1.3. Market size and forecast, by End-User
- 6.4.4.2. Japan
- 6.4.4.2.1. Key market trends, growth factors and opportunities
- 6.4.4.2.2. Market size and forecast, by Product Type
- 6.4.4.2.3. Market size and forecast, by End-User
- 6.4.4.3. South Korea
- 6.4.4.3.1. Key market trends, growth factors and opportunities
- 6.4.4.3.2. Market size and forecast, by Product Type
- 6.4.4.3.3. Market size and forecast, by End-User
- 6.4.4.4. India
- 6.4.4.4.1. Key market trends, growth factors and opportunities
- 6.4.4.4.2. Market size and forecast, by Product Type
- 6.4.4.4.3. Market size and forecast, by End-User
- 6.4.4.5. Australia
- 6.4.4.5.1. Key market trends, growth factors and opportunities
- 6.4.4.5.2. Market size and forecast, by Product Type
- 6.4.4.5.3. Market size and forecast, by End-User
- 6.4.4.6. Rest Of Asia Pacafic
- 6.4.4.6.1. Key market trends, growth factors and opportunities
- 6.4.4.6.2. Market size and forecast, by Product Type
- 6.4.4.6.3. Market size and forecast, by End-User
- 6.5. LAMEA
- 6.5.1. Key trends and opportunities
- 6.5.2. Market size and forecast, by Product Type
- 6.5.3. Market size and forecast, by End-User
- 6.5.4. Market size and forecast, by country
- 6.5.4.1. Latin America
- 6.5.4.1.1. Key market trends, growth factors and opportunities
- 6.5.4.1.2. Market size and forecast, by Product Type
- 6.5.4.1.3. Market size and forecast, by End-User
- 6.5.4.2. Middle East
- 6.5.4.2.1. Key market trends, growth factors and opportunities
- 6.5.4.2.2. Market size and forecast, by Product Type
- 6.5.4.2.3. Market size and forecast, by End-User
- 6.5.4.3. Africa
- 6.5.4.3.1. Key market trends, growth factors and opportunities
- 6.5.4.3.2. Market size and forecast, by Product Type
- 6.5.4.3.3. Market size and forecast, by End-User
CHAPTER 7: COMPETITIVE LANDSCAPE
- 7.1. Introduction
- 7.2. Top winning strategies
- 7.3. Product Mapping of Top 10 Player
- 7.4. Competitive Dashboard
- 7.5. Competitive Heatmap
- 7.6. Top player positioning, 2022
CHAPTER 8: COMPANY PROFILES
- 8.1. SGS SA
- 8.1.1. Company overview
- 8.1.2. Key Executives
- 8.1.3. Company snapshot
- 8.1.4. Operating business segments
- 8.1.5. Product portfolio
- 8.1.6. Business performance
- 8.1.7. Key strategic moves and developments
- 8.2. Eurofins Scientific
- 8.2.1. Company overview
- 8.2.2. Key Executives
- 8.2.3. Company snapshot
- 8.2.4. Operating business segments
- 8.2.5. Product portfolio
- 8.2.6. Business performance
- 8.3. Staphyt SA
- 8.3.1. Company overview
- 8.3.2. Key Executives
- 8.3.3. Company snapshot
- 8.3.4. Operating business segments
- 8.3.5. Product portfolio
- 8.4. Laus GmbH
- 8.4.1. Company overview
- 8.4.2. Key Executives
- 8.4.3. Company snapshot
- 8.4.4. Operating business segments
- 8.4.5. Product portfolio
- 8.5. Bionema Limited
- 8.5.1. Company overview
- 8.5.2. Key Executives
- 8.5.3. Company snapshot
- 8.5.4. Operating business segments
- 8.5.5. Product portfolio
- 8.6. Syntech Research Group
- 8.6.1. Company overview
- 8.6.2. Key Executives
- 8.6.3. Company snapshot
- 8.6.4. Operating business segments
- 8.6.5. Product portfolio
- 8.7. Anadiag Group
- 8.7.1. Company overview
- 8.7.2. Key Executives
- 8.7.3. Company snapshot
- 8.7.4. Operating business segments
- 8.7.5. Product portfolio
- 8.8. RJ Hill Laboratories Limited
- 8.8.1. Company overview
- 8.8.2. Key Executives
- 8.8.3. Company snapshot
- 8.8.4. Operating business segments
- 8.8.5. Product portfolio
- 8.9. Eurofins APAL Pty Ltd
- 8.9.1. Company overview
- 8.9.2. Key Executives
- 8.9.3. Company snapshot
- 8.9.4. Operating business segments
- 8.9.5. Product portfolio
- 8.10. ALS Limited
- 8.10.1. Company overview
- 8.10.2. Key Executives
- 8.10.3. Company snapshot
- 8.10.4. Operating business segments
- 8.10.5. Product portfolio
- 8.10.6. Business performance
- 8.10.7. Key strategic moves and developments
LIST OF TABLES
- TABLE 01. GLOBAL AGRICULTURE BIOLOGICALS TESTING MARKET, BY PRODUCT TYPE, 2022-2032 ($MILLION)
- TABLE 02. AGRICULTURE BIOLOGICALS TESTING MARKET FOR BIO PESTICIDES, BY REGION, 2022-2032 ($MILLION)
- TABLE 03. AGRICULTURE BIOLOGICALS TESTING MARKET FOR BIO FERTILIZERS, BY REGION, 2022-2032 ($MILLION)
- TABLE 04. AGRICULTURE BIOLOGICALS TESTING MARKET FOR BIO STIMULANTS, BY REGION, 2022-2032 ($MILLION)
- TABLE 05. GLOBAL AGRICULTURE BIOLOGICALS TESTING MARKET, BY END-USER, 2022-2032 ($MILLION)
- TABLE 06. AGRICULTURE BIOLOGICALS TESTING MARKET FOR BIOLOGICAL PRODUCT MANUFACTURERS, BY REGION, 2022-2032 ($MILLION)
- TABLE 07. AGRICULTURE BIOLOGICALS TESTING MARKET FOR GOVERNMENT AGENCIES, BY REGION, 2022-2032 ($MILLION)
- TABLE 08. AGRICULTURE BIOLOGICALS TESTING MARKET FOR PLANT BREEDERS, BY REGION, 2022-2032 ($MILLION)
- TABLE 09. AGRICULTURE BIOLOGICALS TESTING MARKET FOR OUTSOURCED CONTRACT RESEARCH ORGANIZATION, BY REGION, 2022-2032 ($MILLION)
- TABLE 10. AGRICULTURE BIOLOGICALS TESTING MARKET, BY REGION, 2022-2032 ($MILLION)
- TABLE 11. NORTH AMERICA AGRICULTURE BIOLOGICALS TESTING MARKET, BY PRODUCT TYPE, 2022-2032 ($MILLION)
- TABLE 12. NORTH AMERICA AGRICULTURE BIOLOGICALS TESTING MARKET, BY END-USER, 2022-2032 ($MILLION)
- TABLE 13. NORTH AMERICA AGRICULTURE BIOLOGICALS TESTING MARKET, BY COUNTRY, 2022-2032 ($MILLION)
- TABLE 14. U.S. AGRICULTURE BIOLOGICALS TESTING MARKET, BY PRODUCT TYPE, 2022-2032 ($MILLION)
- TABLE 15. U.S. AGRICULTURE BIOLOGICALS TESTING MARKET, BY END-USER, 2022-2032 ($MILLION)
- TABLE 16. CANADA AGRICULTURE BIOLOGICALS TESTING MARKET, BY PRODUCT TYPE, 2022-2032 ($MILLION)
- TABLE 17. CANADA AGRICULTURE BIOLOGICALS TESTING MARKET, BY END-USER, 2022-2032 ($MILLION)
- TABLE 18. MEXICO AGRICULTURE BIOLOGICALS TESTING MARKET, BY PRODUCT TYPE, 2022-2032 ($MILLION)
- TABLE 19. MEXICO AGRICULTURE BIOLOGICALS TESTING MARKET, BY END-USER, 2022-2032 ($MILLION)
- TABLE 20. EUROPE AGRICULTURE BIOLOGICALS TESTING MARKET, BY PRODUCT TYPE, 2022-2032 ($MILLION)
- TABLE 21. EUROPE AGRICULTURE BIOLOGICALS TESTING MARKET, BY END-USER, 2022-2032 ($MILLION)
- TABLE 22. EUROPE AGRICULTURE BIOLOGICALS TESTING MARKET, BY COUNTRY, 2022-2032 ($MILLION)
- TABLE 23. GERMANY AGRICULTURE BIOLOGICALS TESTING MARKET, BY PRODUCT TYPE, 2022-2032 ($MILLION)
- TABLE 24. GERMANY AGRICULTURE BIOLOGICALS TESTING MARKET, BY END-USER, 2022-2032 ($MILLION)
- TABLE 25. UK AGRICULTURE BIOLOGICALS TESTING MARKET, BY PRODUCT TYPE, 2022-2032 ($MILLION)
- TABLE 26. UK AGRICULTURE BIOLOGICALS TESTING MARKET, BY END-USER, 2022-2032 ($MILLION)
- TABLE 27. FRANCE AGRICULTURE BIOLOGICALS TESTING MARKET, BY PRODUCT TYPE, 2022-2032 ($MILLION)
- TABLE 28. FRANCE AGRICULTURE BIOLOGICALS TESTING MARKET, BY END-USER, 2022-2032 ($MILLION)
- TABLE 29. RUSSIA AGRICULTURE BIOLOGICALS TESTING MARKET, BY PRODUCT TYPE, 2022-2032 ($MILLION)
- TABLE 30. RUSSIA AGRICULTURE BIOLOGICALS TESTING MARKET, BY END-USER, 2022-2032 ($MILLION)
- TABLE 31. SPAIN AGRICULTURE BIOLOGICALS TESTING MARKET, BY PRODUCT TYPE, 2022-2032 ($MILLION)
- TABLE 32. SPAIN AGRICULTURE BIOLOGICALS TESTING MARKET, BY END-USER, 2022-2032 ($MILLION)
- TABLE 33. ITALY AGRICULTURE BIOLOGICALS TESTING MARKET, BY PRODUCT TYPE, 2022-2032 ($MILLION)
- TABLE 34. ITALY AGRICULTURE BIOLOGICALS TESTING MARKET, BY END-USER, 2022-2032 ($MILLION)
- TABLE 35. REST OF EUROPE AGRICULTURE BIOLOGICALS TESTING MARKET, BY PRODUCT TYPE, 2022-2032 ($MILLION)
- TABLE 36. REST OF EUROPE AGRICULTURE BIOLOGICALS TESTING MARKET, BY END-USER, 2022-2032 ($MILLION)
- TABLE 37. ASIA-PACIFIC AGRICULTURE BIOLOGICALS TESTING MARKET, BY PRODUCT TYPE, 2022-2032 ($MILLION)
- TABLE 38. ASIA-PACIFIC AGRICULTURE BIOLOGICALS TESTING MARKET, BY END-USER, 2022-2032 ($MILLION)
- TABLE 39. ASIA-PACIFIC AGRICULTURE BIOLOGICALS TESTING MARKET, BY COUNTRY, 2022-2032 ($MILLION)
- TABLE 40. CHINA AGRICULTURE BIOLOGICALS TESTING MARKET, BY PRODUCT TYPE, 2022-2032 ($MILLION)
- TABLE 41. CHINA AGRICULTURE BIOLOGICALS TESTING MARKET, BY END-USER, 2022-2032 ($MILLION)
- TABLE 42. JAPAN AGRICULTURE BIOLOGICALS TESTING MARKET, BY PRODUCT TYPE, 2022-2032 ($MILLION)
- TABLE 43. JAPAN AGRICULTURE BIOLOGICALS TESTING MARKET, BY END-USER, 2022-2032 ($MILLION)
- TABLE 44. SOUTH KOREA AGRICULTURE BIOLOGICALS TESTING MARKET, BY PRODUCT TYPE, 2022-2032 ($MILLION)
- TABLE 45. SOUTH KOREA AGRICULTURE BIOLOGICALS TESTING MARKET, BY END-USER, 2022-2032 ($MILLION)
- TABLE 46. INDIA AGRICULTURE BIOLOGICALS TESTING MARKET, BY PRODUCT TYPE, 2022-2032 ($MILLION)
- TABLE 47. INDIA AGRICULTURE BIOLOGICALS TESTING MARKET, BY END-USER, 2022-2032 ($MILLION)
- TABLE 48. AUSTRALIA AGRICULTURE BIOLOGICALS TESTING MARKET, BY PRODUCT TYPE, 2022-2032 ($MILLION)
- TABLE 49. AUSTRALIA AGRICULTURE BIOLOGICALS TESTING MARKET, BY END-USER, 2022-2032 ($MILLION)
- TABLE 50. REST OF ASIA PACAFIC AGRICULTURE BIOLOGICALS TESTING MARKET, BY PRODUCT TYPE, 2022-2032 ($MILLION)
- TABLE 51. REST OF ASIA PACAFIC AGRICULTURE BIOLOGICALS TESTING MARKET, BY END-USER, 2022-2032 ($MILLION)
- TABLE 52. LAMEA AGRICULTURE BIOLOGICALS TESTING MARKET, BY PRODUCT TYPE, 2022-2032 ($MILLION)
- TABLE 53. LAMEA AGRICULTURE BIOLOGICALS TESTING MARKET, BY END-USER, 2022-2032 ($MILLION)
- TABLE 54. LAMEA AGRICULTURE BIOLOGICALS TESTING MARKET, BY COUNTRY, 2022-2032 ($MILLION)
- TABLE 55. LATIN AMERICA AGRICULTURE BIOLOGICALS TESTING MARKET, BY PRODUCT TYPE, 2022-2032 ($MILLION)
- TABLE 56. LATIN AMERICA AGRICULTURE BIOLOGICALS TESTING MARKET, BY END-USER, 2022-2032 ($MILLION)
- TABLE 57. MIDDLE EAST AGRICULTURE BIOLOGICALS TESTING MARKET, BY PRODUCT TYPE, 2022-2032 ($MILLION)
- TABLE 58. MIDDLE EAST AGRICULTURE BIOLOGICALS TESTING MARKET, BY END-USER, 2022-2032 ($MILLION)
- TABLE 59. AFRICA AGRICULTURE BIOLOGICALS TESTING MARKET, BY PRODUCT TYPE, 2022-2032 ($MILLION)
- TABLE 60. AFRICA AGRICULTURE BIOLOGICALS TESTING MARKET, BY END-USER, 2022-2032 ($MILLION)
- TABLE 61. SGS SA: KEY EXECUTIVES
- TABLE 62. SGS SA: COMPANY SNAPSHOT
- TABLE 63. SGS SA: SERVICE SEGMENTS
- TABLE 64. SGS SA: PRODUCT PORTFOLIO
- TABLE 65. SGS SA: KEY STRATERGIES
- TABLE 66. EUROFINS SCIENTIFIC: KEY EXECUTIVES
- TABLE 67. EUROFINS SCIENTIFIC: COMPANY SNAPSHOT
- TABLE 68. EUROFINS SCIENTIFIC: SERVICE SEGMENTS
- TABLE 69. EUROFINS SCIENTIFIC: PRODUCT PORTFOLIO
- TABLE 70. STAPHYT SA: KEY EXECUTIVES
- TABLE 71. STAPHYT SA: COMPANY SNAPSHOT
- TABLE 72. STAPHYT SA: SERVICE SEGMENTS
- TABLE 73. STAPHYT SA: PRODUCT PORTFOLIO
- TABLE 74. LAUS GMBH: KEY EXECUTIVES
- TABLE 75. LAUS GMBH: COMPANY SNAPSHOT
- TABLE 76. LAUS GMBH: SERVICE SEGMENTS
- TABLE 77. LAUS GMBH: PRODUCT PORTFOLIO
- TABLE 78. BIONEMA LIMITED: KEY EXECUTIVES
- TABLE 79. BIONEMA LIMITED: COMPANY SNAPSHOT
- TABLE 80. BIONEMA LIMITED: SERVICE SEGMENTS
- TABLE 81. BIONEMA LIMITED: PRODUCT PORTFOLIO
- TABLE 82. SYNTECH RESEARCH GROUP: KEY EXECUTIVES
- TABLE 83. SYNTECH RESEARCH GROUP: COMPANY SNAPSHOT
- TABLE 84. SYNTECH RESEARCH GROUP: SERVICE SEGMENTS
- TABLE 85. SYNTECH RESEARCH GROUP: PRODUCT PORTFOLIO
- TABLE 86. ANADIAG GROUP: KEY EXECUTIVES
- TABLE 87. ANADIAG GROUP: COMPANY SNAPSHOT
- TABLE 88. ANADIAG GROUP: SERVICE SEGMENTS
- TABLE 89. ANADIAG GROUP: PRODUCT PORTFOLIO
- TABLE 90. RJ HILL LABORATORIES LIMITED: KEY EXECUTIVES
- TABLE 91. RJ HILL LABORATORIES LIMITED: COMPANY SNAPSHOT
- TABLE 92. RJ HILL LABORATORIES LIMITED: SERVICE SEGMENTS
- TABLE 93. RJ HILL LABORATORIES LIMITED: PRODUCT PORTFOLIO
- TABLE 94. EUROFINS APAL PTY LTD: KEY EXECUTIVES
- TABLE 95. EUROFINS APAL PTY LTD: COMPANY SNAPSHOT
- TABLE 96. EUROFINS APAL PTY LTD: SERVICE SEGMENTS
- TABLE 97. EUROFINS APAL PTY LTD: PRODUCT PORTFOLIO
- TABLE 98. ALS LIMITED: KEY EXECUTIVES
- TABLE 99. ALS LIMITED: COMPANY SNAPSHOT
- TABLE 100. ALS LIMITED: SERVICE SEGMENTS
- TABLE 101. ALS LIMITED: PRODUCT PORTFOLIO
- TABLE 102. ALS LIMITED: KEY STRATERGIES
LIST OF FIGURES
- FIGURE 01. AGRICULTURE BIOLOGICALS TESTING MARKET, 2022-2032
- FIGURE 02. SEGMENTATION OF AGRICULTURE BIOLOGICALS TESTING MARKET, 2022-2032
- FIGURE 03. TOP INVESTMENT POCKETS IN AGRICULTURE BIOLOGICALS TESTING MARKET (2023-2032)
- FIGURE 04. MODERATE BARGAINING POWER OF SUPPLIERS
- FIGURE 05. MODERATE BARGAINING POWER OF BUYERS
- FIGURE 06. MODERATE THREAT OF SUBSTITUTES
- FIGURE 07. MODERATE THREAT OF NEW ENTRANTS
- FIGURE 08. MODERATE INTENSITY OF RIVALRY
- FIGURE 09. DRIVERS, RESTRAINTS AND OPPORTUNITIES: GLOBALAGRICULTURE BIOLOGICALS TESTING MARKET
- FIGURE 10. AGRICULTURE BIOLOGICALS TESTING MARKET, BY PRODUCT TYPE, 2022(%)
- FIGURE 11. COMPARATIVE SHARE ANALYSIS OF AGRICULTURE BIOLOGICALS TESTING MARKET FOR BIO PESTICIDES, BY COUNTRY 2022 AND 2032(%)
- FIGURE 12. COMPARATIVE SHARE ANALYSIS OF AGRICULTURE BIOLOGICALS TESTING MARKET FOR BIO FERTILIZERS, BY COUNTRY 2022 AND 2032(%)
- FIGURE 13. COMPARATIVE SHARE ANALYSIS OF AGRICULTURE BIOLOGICALS TESTING MARKET FOR BIO STIMULANTS, BY COUNTRY 2022 AND 2032(%)
- FIGURE 14. AGRICULTURE BIOLOGICALS TESTING MARKET, BY END-USER, 2022(%)
- FIGURE 15. COMPARATIVE SHARE ANALYSIS OF AGRICULTURE BIOLOGICALS TESTING MARKET FOR BIOLOGICAL PRODUCT MANUFACTURERS, BY COUNTRY 2022 AND 2032(%)
- FIGURE 16. COMPARATIVE SHARE ANALYSIS OF AGRICULTURE BIOLOGICALS TESTING MARKET FOR GOVERNMENT AGENCIES, BY COUNTRY 2022 AND 2032(%)
- FIGURE 17. COMPARATIVE SHARE ANALYSIS OF AGRICULTURE BIOLOGICALS TESTING MARKET FOR PLANT BREEDERS, BY COUNTRY 2022 AND 2032(%)
- FIGURE 18. COMPARATIVE SHARE ANALYSIS OF AGRICULTURE BIOLOGICALS TESTING MARKET FOR OUTSOURCED CONTRACT RESEARCH ORGANIZATION, BY COUNTRY 2022 AND 2032(%)
- FIGURE 19. AGRICULTURE BIOLOGICALS TESTING MARKET BY REGION, 2022
- FIGURE 20. U.S. AGRICULTURE BIOLOGICALS TESTING MARKET, 2022-2032 ($MILLION)
- FIGURE 21. CANADA AGRICULTURE BIOLOGICALS TESTING MARKET, 2022-2032 ($MILLION)
- FIGURE 22. MEXICO AGRICULTURE BIOLOGICALS TESTING MARKET, 2022-2032 ($MILLION)
- FIGURE 23. GERMANY AGRICULTURE BIOLOGICALS TESTING MARKET, 2022-2032 ($MILLION)
- FIGURE 24. UK AGRICULTURE BIOLOGICALS TESTING MARKET, 2022-2032 ($MILLION)
- FIGURE 25. FRANCE AGRICULTURE BIOLOGICALS TESTING MARKET, 2022-2032 ($MILLION)
- FIGURE 26. RUSSIA AGRICULTURE BIOLOGICALS TESTING MARKET, 2022-2032 ($MILLION)
- FIGURE 27. SPAIN AGRICULTURE BIOLOGICALS TESTING MARKET, 2022-2032 ($MILLION)
- FIGURE 28. ITALY AGRICULTURE BIOLOGICALS TESTING MARKET, 2022-2032 ($MILLION)
- FIGURE 29. REST OF EUROPE AGRICULTURE BIOLOGICALS TESTING MARKET, 2022-2032 ($MILLION)
- FIGURE 30. CHINA AGRICULTURE BIOLOGICALS TESTING MARKET, 2022-2032 ($MILLION)
- FIGURE 31. JAPAN AGRICULTURE BIOLOGICALS TESTING MARKET, 2022-2032 ($MILLION)
- FIGURE 32. SOUTH KOREA AGRICULTURE BIOLOGICALS TESTING MARKET, 2022-2032 ($MILLION)
- FIGURE 33. INDIA AGRICULTURE BIOLOGICALS TESTING MARKET, 2022-2032 ($MILLION)
- FIGURE 34. AUSTRALIA AGRICULTURE BIOLOGICALS TESTING MARKET, 2022-2032 ($MILLION)
- FIGURE 35. REST OF ASIA PACAFIC AGRICULTURE BIOLOGICALS TESTING MARKET, 2022-2032 ($MILLION)
- FIGURE 36. LATIN AMERICA AGRICULTURE BIOLOGICALS TESTING MARKET, 2022-2032 ($MILLION)
- FIGURE 37. MIDDLE EAST AGRICULTURE BIOLOGICALS TESTING MARKET, 2022-2032 ($MILLION)
- FIGURE 38. AFRICA AGRICULTURE BIOLOGICALS TESTING MARKET, 2022-2032 ($MILLION)
- FIGURE 39. TOP WINNING STRATEGIES, BY YEAR
- FIGURE 40. TOP WINNING STRATEGIES, BY DEVELOPMENT
- FIGURE 41. TOP WINNING STRATEGIES, BY COMPANY
- FIGURE 42. PRODUCT MAPPING OF TOP 10 PLAYERS
- FIGURE 43. COMPETITIVE DASHBOARD
- FIGURE 44. COMPETITIVE HEATMAP: AGRICULTURE BIOLOGICALS TESTING MARKET
- FIGURE 45. TOP PLAYER POSITIONING, 2022
- FIGURE 46. SGS SA: NET REVENUE, 2019-2021 ($MILLION)
- FIGURE 47. SGS SA: REVENUE SHARE BY SEGMENT, 2021 (%)
- FIGURE 48. SGS SA: REVENUE SHARE BY REGION, 2021 (%)
- FIGURE 49. EUROFINS SCIENTIFIC: NET REVENUE, 2019-2021 ($MILLION)
- FIGURE 50. EUROFINS SCIENTIFIC: REVENUE SHARE BY SEGMENT, 2021 (%)
- FIGURE 51. ALS LIMITED: NET REVENUE, 2020-2022 ($MILLION)
- FIGURE 52. ALS LIMITED: REVENUE SHARE BY SEGMENT, 2022 (%)
- FIGURE 53. ALS LIMITED: REVENUE SHARE BY REGION, 2022 (%)

