
PUBLISHER: Allied Market Research | PRODUCT CODE: 1344478

PUBLISHER: Allied Market Research | PRODUCT CODE: 1344478
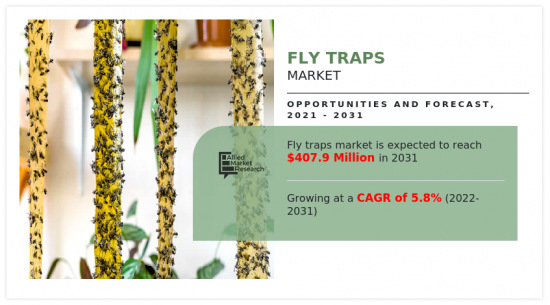
Fly Traps Market By Type, Application, Price Range, and Distribution Channel : Global Opportunity Analysis and Industry Forecast, 2023?2032
According to a new report published by Allied Market Research, titled, "Fly Traps Market by Type Application Price Range, and Distribution Channel, 2023-2032," The global fly traps market size was valued at $245,450.3 thousand in 2022, and is projected to reach $433,211.4 thousand by 2032, registering a CAGR of 5.9% from 2023 to 2032.
Fly traps are the devices or products that are especially designed to catch and kill the different parasitic and diseases spreading insects and flies such as houseflies, fruit fly, mosquito, horse-fly, and black fly. Fly traps can use chemicals and chemical-free elements and compounds to attract and kill flies, which helps in controlling the harmful insects and fly population.
The growth of the fly traps market is attributed to the factors such as increase in urban population all around the globe, which has resulted insignificant increase in food sources and conducive living habitats for various pests such as flies, cockroaches, and mosquitoes. This has resulted in increased demand for pest control products like fly traps across the globe. In addition, rapid migration is being witnessed from rural areas to urban centers, being more prevalent in developing countries such as India. This has further increased the population density of urban areas, which in turns is anticipated to fuel the demand for fly traps.
Rise in concern of consumers from residential and commercial sectors toward maintaining health and hygiene has escalated the adoption of pest control products and fly traps. Moreover, considerable rise has been witnessed in the prevalence of diseases caused by different kind of pests and flying insects; hence, making it essential to control them. However, health and environmental hazards caused by pesticides that are used in sticky and container fly traps, due to their chemical content, is the significant factor anticipated to hamper the market growth during the forecast period.
Furthermore, the significant increase in the awareness regarding the various infectious and vector borne diseases caused by the flies and insects is significantly boosting the demand for the fly traps among the global population. The surging prevalence of various vector borne diseases such as malaria, dengue, cholera, and encephalitis is fostering the sales revenues of the different types of fly traps in the market. The surging adoption of fly traps in the various sectors such as agriculture, residential, hospitality, foodservice industry, and industrial units across the globe is significantly driving the growth of the global fly traps market.
The global fly traps market is segmented on the basis of type, application, price range, distribution channel, and region. Depending on type, the market is categorized into container, sticky, and electric. The container segment is further segmented into fly light traps, fly baits, delta traps, and others.
On the basis of application, it is classified into residential and commercial. The applications covered in the study of commercial segment includes HoReCa, factories, building management, and others. By price range, the market is segregated into low, medium, and high. Further, the market, based on the distribution channel is bifurcated into supermarkets and hypermarkets, independent retail stores, e-commerce, and others. Region wise, the market is analyzed across North America, Europe, Asia-Pacific, and LAMEA.
Some of the major players analyzed in this report are: Agri Phero Solutionz, Cleanrth, Eco Trap Guard, Ecoman Biotech, Flies Be Gone, Godwill Energy Products Private Limited, Arbico Organics, Katchy Bug, McQwin, Pestronics, Rescue, Reza Hygiene, RSVP International, Sterling International, Inc., Woodstream Corporation, Brandenburg, and Rentokil.
Key Benefits For Stakeholders
- This report provides a quantitative analysis of the market segments, current trends, estimations, and dynamics of the fly traps market analysis from 2021 to 2031 to identify the prevailing fly traps market opportunities.
- The market research is offered along with information related to key drivers, restraints, and opportunities.
- Porter's five forces analysis highlights the potency of buyers and suppliers to enable stakeholders make profit-oriented business decisions and strengthen their supplier-buyer network.
- In-depth analysis of the fly traps market segmentation assists to determine the prevailing market opportunities.
- Major countries in each region are mapped according to their revenue contribution to the global market.
- Market player positioning facilitates benchmarking and provides a clear understanding of the present position of the market players.
- The report includes the analysis of the regional as well as global fly traps market trends, key players, market segments, application areas, and market growth strategies.
Key Market Segments
By Type
- Container
- Fly Light Traps
- Fly Baits
- Delta Traps
- Others
- Sticky
- Electric
By Application
- Residential
- Commercial
- HoReCa
- Factories
- Building Management
- Others
By Price Range
- Low
- Medium
- High
By Distribution Channel
- Supermarkets Hypermarkets
- Independent Retail Stores
- E-commerce
- Others
By Region
- North America
- U.S.
- Canada
- Mexico
- Europe
- Germany
- UK
- France
- Italy
- Spain
- Rest of Europe
- Asia-Pacific
- China
- Japan
- India
- Australia
- South Korea
- Rest of Asia-Pacific
- LAMEA
- Brazil
- Saudi Arabia
- South Africa
- Rest of LAMEA
TABLE OF CONTENTS
CHAPTER 1: INTRODUCTION
- 1.1. Report description
- 1.2. Key market segments
- 1.3. Key benefits to the stakeholders
- 1.4. Research Methodology
- 1.4.1. Primary research
- 1.4.2. Secondary research
- 1.4.3. Analyst tools and models
CHAPTER 2: EXECUTIVE SUMMARY
- 2.1. CXO Perspective
CHAPTER 3: MARKET OVERVIEW
- 3.1. Market definition and scope
- 3.2. Key findings
- 3.2.1. Top impacting factors
- 3.2.2. Top investment pockets
- 3.3. Porter's five forces analysis
- 3.4. Market dynamics
- 3.4.1. Drivers
- 3.4.2. Restraints
- 3.4.3. Opportunities
- 3.5. COVID-19 Impact Analysis on the market
- 3.6. Market Share Analysis
- 3.7. Pricing Analysis
CHAPTER 4: FLY TRAPS MARKET, BY TYPE
- 4.1. Overview
- 4.1.1. Market size and forecast
- 4.2. Container
- 4.2.1. Key market trends, growth factors and opportunities
- 4.2.2. Market size and forecast, by region
- 4.2.3. Market share analysis by country
- 4.2.4. Container Fly Traps Market by Sub Type
- 4.2.4.1. Fly Light Traps Market size and forecast, by region
- 4.2.4.2. Fly Baits Market size and forecast, by region
- 4.2.4.3. Delta Traps Market size and forecast, by region
- 4.2.4.4. Others Market size and forecast, by region
- 4.3. Sticky
- 4.3.1. Key market trends, growth factors and opportunities
- 4.3.2. Market size and forecast, by region
- 4.3.3. Market share analysis by country
- 4.4. Electric
- 4.4.1. Key market trends, growth factors and opportunities
- 4.4.2. Market size and forecast, by region
- 4.4.3. Market share analysis by country
CHAPTER 5: FLY TRAPS MARKET, BY APPLICATION
- 5.1. Overview
- 5.1.1. Market size and forecast
- 5.2. Residential
- 5.2.1. Key market trends, growth factors and opportunities
- 5.2.2. Market size and forecast, by region
- 5.2.3. Market share analysis by country
- 5.3. Commercial
- 5.3.1. Key market trends, growth factors and opportunities
- 5.3.2. Market size and forecast, by region
- 5.3.3. Market share analysis by country
- 5.3.4. Commercial Fly Traps Market by Sub Type
- 5.3.4.1. HoReCa Market size and forecast, by region
- 5.3.4.2. Factories Market size and forecast, by region
- 5.3.4.3. Building Management Market size and forecast, by region
- 5.3.4.4. Others Market size and forecast, by region
CHAPTER 6: FLY TRAPS MARKET, BY PRICE RANGE
- 6.1. Overview
- 6.1.1. Market size and forecast
- 6.2. Low
- 6.2.1. Key market trends, growth factors and opportunities
- 6.2.2. Market size and forecast, by region
- 6.2.3. Market share analysis by country
- 6.3. Medium
- 6.3.1. Key market trends, growth factors and opportunities
- 6.3.2. Market size and forecast, by region
- 6.3.3. Market share analysis by country
- 6.4. High
- 6.4.1. Key market trends, growth factors and opportunities
- 6.4.2. Market size and forecast, by region
- 6.4.3. Market share analysis by country
CHAPTER 7: FLY TRAPS MARKET, BY DISTRIBUTION CHANNEL
- 7.1. Overview
- 7.1.1. Market size and forecast
- 7.2. Supermarkets and hypermarkets
- 7.2.1. Key market trends, growth factors and opportunities
- 7.2.2. Market size and forecast, by region
- 7.2.3. Market share analysis by country
- 7.3. Independent Retail Stores
- 7.3.1. Key market trends, growth factors and opportunities
- 7.3.2. Market size and forecast, by region
- 7.3.3. Market share analysis by country
- 7.4. E Commerce
- 7.4.1. Key market trends, growth factors and opportunities
- 7.4.2. Market size and forecast, by region
- 7.4.3. Market share analysis by country
- 7.5. Others
- 7.5.1. Key market trends, growth factors and opportunities
- 7.5.2. Market size and forecast, by region
- 7.5.3. Market share analysis by country
CHAPTER 8: FLY TRAPS MARKET, BY REGION
- 8.1. Overview
- 8.1.1. Market size and forecast By Region
- 8.2. North America
- 8.2.1. Key trends and opportunities
- 8.2.2. Market size and forecast, by Type
- 8.2.2.1. North America Container Fly Traps Market by Sub Type
- 8.2.3. Market size and forecast, by Application
- 8.2.3.1. North America Commercial Fly Traps Market by Sub Type
- 8.2.4. Market size and forecast, by Price Range
- 8.2.5. Market size and forecast, by Distribution Channel
- 8.2.6. Market size and forecast, by country
- 8.2.6.1. U.S.
- 8.2.6.1.1. Key market trends, growth factors and opportunities
- 8.2.6.1.2. Market size and forecast, by Type
- 8.2.6.1.3. Market size and forecast, by Application
- 8.2.6.1.4. Market size and forecast, by Price Range
- 8.2.6.1.5. Market size and forecast, by Distribution Channel
- 8.2.6.2. Canada
- 8.2.6.2.1. Key market trends, growth factors and opportunities
- 8.2.6.2.2. Market size and forecast, by Type
- 8.2.6.2.3. Market size and forecast, by Application
- 8.2.6.2.4. Market size and forecast, by Price Range
- 8.2.6.2.5. Market size and forecast, by Distribution Channel
- 8.2.6.3. Mexico
- 8.2.6.3.1. Key market trends, growth factors and opportunities
- 8.2.6.3.2. Market size and forecast, by Type
- 8.2.6.3.3. Market size and forecast, by Application
- 8.2.6.3.4. Market size and forecast, by Price Range
- 8.2.6.3.5. Market size and forecast, by Distribution Channel
- 8.3. Europe
- 8.3.1. Key trends and opportunities
- 8.3.2. Market size and forecast, by Type
- 8.3.2.1. Europe Container Fly Traps Market by Sub Type
- 8.3.3. Market size and forecast, by Application
- 8.3.3.1. Europe Commercial Fly Traps Market by Sub Type
- 8.3.4. Market size and forecast, by Price Range
- 8.3.5. Market size and forecast, by Distribution Channel
- 8.3.6. Market size and forecast, by country
- 8.3.6.1. Germany
- 8.3.6.1.1. Key market trends, growth factors and opportunities
- 8.3.6.1.2. Market size and forecast, by Type
- 8.3.6.1.3. Market size and forecast, by Application
- 8.3.6.1.4. Market size and forecast, by Price Range
- 8.3.6.1.5. Market size and forecast, by Distribution Channel
- 8.3.6.2. UK
- 8.3.6.2.1. Key market trends, growth factors and opportunities
- 8.3.6.2.2. Market size and forecast, by Type
- 8.3.6.2.3. Market size and forecast, by Application
- 8.3.6.2.4. Market size and forecast, by Price Range
- 8.3.6.2.5. Market size and forecast, by Distribution Channel
- 8.3.6.3. France
- 8.3.6.3.1. Key market trends, growth factors and opportunities
- 8.3.6.3.2. Market size and forecast, by Type
- 8.3.6.3.3. Market size and forecast, by Application
- 8.3.6.3.4. Market size and forecast, by Price Range
- 8.3.6.3.5. Market size and forecast, by Distribution Channel
- 8.3.6.4. Italy
- 8.3.6.4.1. Key market trends, growth factors and opportunities
- 8.3.6.4.2. Market size and forecast, by Type
- 8.3.6.4.3. Market size and forecast, by Application
- 8.3.6.4.4. Market size and forecast, by Price Range
- 8.3.6.4.5. Market size and forecast, by Distribution Channel
- 8.3.6.5. Spain
- 8.3.6.5.1. Key market trends, growth factors and opportunities
- 8.3.6.5.2. Market size and forecast, by Type
- 8.3.6.5.3. Market size and forecast, by Application
- 8.3.6.5.4. Market size and forecast, by Price Range
- 8.3.6.5.5. Market size and forecast, by Distribution Channel
- 8.3.6.6. Rest of Europe
- 8.3.6.6.1. Key market trends, growth factors and opportunities
- 8.3.6.6.2. Market size and forecast, by Type
- 8.3.6.6.3. Market size and forecast, by Application
- 8.3.6.6.4. Market size and forecast, by Price Range
- 8.3.6.6.5. Market size and forecast, by Distribution Channel
- 8.4. Asia-Pacific
- 8.4.1. Key trends and opportunities
- 8.4.2. Market size and forecast, by Type
- 8.4.2.1. Asia-Pacific Container Fly Traps Market by Sub Type
- 8.4.3. Market size and forecast, by Application
- 8.4.3.1. Asia-Pacific Commercial Fly Traps Market by Sub Type
- 8.4.4. Market size and forecast, by Price Range
- 8.4.5. Market size and forecast, by Distribution Channel
- 8.4.6. Market size and forecast, by country
- 8.4.6.1. China
- 8.4.6.1.1. Key market trends, growth factors and opportunities
- 8.4.6.1.2. Market size and forecast, by Type
- 8.4.6.1.3. Market size and forecast, by Application
- 8.4.6.1.4. Market size and forecast, by Price Range
- 8.4.6.1.5. Market size and forecast, by Distribution Channel
- 8.4.6.2. Japan
- 8.4.6.2.1. Key market trends, growth factors and opportunities
- 8.4.6.2.2. Market size and forecast, by Type
- 8.4.6.2.3. Market size and forecast, by Application
- 8.4.6.2.4. Market size and forecast, by Price Range
- 8.4.6.2.5. Market size and forecast, by Distribution Channel
- 8.4.6.3. India
- 8.4.6.3.1. Key market trends, growth factors and opportunities
- 8.4.6.3.2. Market size and forecast, by Type
- 8.4.6.3.3. Market size and forecast, by Application
- 8.4.6.3.4. Market size and forecast, by Price Range
- 8.4.6.3.5. Market size and forecast, by Distribution Channel
- 8.4.6.4. Australia
- 8.4.6.4.1. Key market trends, growth factors and opportunities
- 8.4.6.4.2. Market size and forecast, by Type
- 8.4.6.4.3. Market size and forecast, by Application
- 8.4.6.4.4. Market size and forecast, by Price Range
- 8.4.6.4.5. Market size and forecast, by Distribution Channel
- 8.4.6.5. South Korea
- 8.4.6.5.1. Key market trends, growth factors and opportunities
- 8.4.6.5.2. Market size and forecast, by Type
- 8.4.6.5.3. Market size and forecast, by Application
- 8.4.6.5.4. Market size and forecast, by Price Range
- 8.4.6.5.5. Market size and forecast, by Distribution Channel
- 8.4.6.6. Rest of Asia-Pacific
- 8.4.6.6.1. Key market trends, growth factors and opportunities
- 8.4.6.6.2. Market size and forecast, by Type
- 8.4.6.6.3. Market size and forecast, by Application
- 8.4.6.6.4. Market size and forecast, by Price Range
- 8.4.6.6.5. Market size and forecast, by Distribution Channel
- 8.5. LAMEA
- 8.5.1. Key trends and opportunities
- 8.5.2. Market size and forecast, by Type
- 8.5.2.1. LAMEA Container Fly Traps Market by Sub Type
- 8.5.3. Market size and forecast, by Application
- 8.5.3.1. LAMEA Commercial Fly Traps Market by Sub Type
- 8.5.4. Market size and forecast, by Price Range
- 8.5.5. Market size and forecast, by Distribution Channel
- 8.5.6. Market size and forecast, by country
- 8.5.6.1. Brazil
- 8.5.6.1.1. Key market trends, growth factors and opportunities
- 8.5.6.1.2. Market size and forecast, by Type
- 8.5.6.1.3. Market size and forecast, by Application
- 8.5.6.1.4. Market size and forecast, by Price Range
- 8.5.6.1.5. Market size and forecast, by Distribution Channel
- 8.5.6.2. Saudi Arabia
- 8.5.6.2.1. Key market trends, growth factors and opportunities
- 8.5.6.2.2. Market size and forecast, by Type
- 8.5.6.2.3. Market size and forecast, by Application
- 8.5.6.2.4. Market size and forecast, by Price Range
- 8.5.6.2.5. Market size and forecast, by Distribution Channel
- 8.5.6.3. South Africa
- 8.5.6.3.1. Key market trends, growth factors and opportunities
- 8.5.6.3.2. Market size and forecast, by Type
- 8.5.6.3.3. Market size and forecast, by Application
- 8.5.6.3.4. Market size and forecast, by Price Range
- 8.5.6.3.5. Market size and forecast, by Distribution Channel
- 8.5.6.4. Rest of LAMEA
- 8.5.6.4.1. Key market trends, growth factors and opportunities
- 8.5.6.4.2. Market size and forecast, by Type
- 8.5.6.4.3. Market size and forecast, by Application
- 8.5.6.4.4. Market size and forecast, by Price Range
- 8.5.6.4.5. Market size and forecast, by Distribution Channel
CHAPTER 9: COMPETITIVE LANDSCAPE
- 9.1. Introduction
- 9.2. Top winning strategies
- 9.3. Product Mapping of Top 10 Player
- 9.4. Competitive Dashboard
- 9.5. Competitive Heatmap
- 9.6. Top player positioning, 2021
CHAPTER 10: COMPANY PROFILES
- 10.1. Agri Phero Solutionz
- 10.1.1. Company overview
- 10.1.2. Key Executives
- 10.1.3. Company snapshot
- 10.2. Cleanrth
- 10.2.1. Company overview
- 10.2.2. Key Executives
- 10.2.3. Company snapshot
- 10.3. Eco Trap Guard
- 10.3.1. Company overview
- 10.3.2. Key Executives
- 10.3.3. Company snapshot
- 10.4. Ecoman Biotech
- 10.4.1. Company overview
- 10.4.2. Key Executives
- 10.4.3. Company snapshot
- 10.5. Flies Be Gone
- 10.5.1. Company overview
- 10.5.2. Key Executives
- 10.5.3. Company snapshot
- 10.6. Godwill Energy Products Private Limited
- 10.6.1. Company overview
- 10.6.2. Key Executives
- 10.6.3. Company snapshot
- 10.7. Arbico Organics
- 10.7.1. Company overview
- 10.7.2. Key Executives
- 10.7.3. Company snapshot
- 10.8. Katchy Bug
- 10.8.1. Company overview
- 10.8.2. Key Executives
- 10.8.3. Company snapshot
- 10.9. McQwin Industries
- 10.9.1. Company overview
- 10.9.2. Key Executives
- 10.9.3. Company snapshot
- 10.10. Pestronics
- 10.10.1. Company overview
- 10.10.2. Key Executives
- 10.10.3. Company snapshot
- 10.11. Rescue Company
- 10.11.1. Company overview
- 10.11.2. Key Executives
- 10.11.3. Company snapshot
- 10.12. reza hygiene
- 10.12.1. Company overview
- 10.12.2. Key Executives
- 10.12.3. Company snapshot
- 10.13. RSVP International
- 10.13.1. Company overview
- 10.13.2. Key Executives
- 10.13.3. Company snapshot
- 10.14. sterling international, inc./rescue!A® pest control products
- 10.14.1. Company overview
- 10.14.2. Key Executives
- 10.14.3. Company snapshot
- 10.15. woodstream corporation
- 10.15.1. Company overview
- 10.15.2. Key Executives
- 10.15.3. Company snapshot
LIST OF TABLES
- TABLE 01. GLOBAL FLY TRAPS MARKET, BY TYPE, 2021-2031 ($MILLION)
- TABLE 02. FLY TRAPS MARKET FOR CONTAINER, BY REGION, 2021-2031 ($MILLION)
- TABLE 03. GLOBAL CONTAINER FLY TRAPS MARKET, BY SUB TYPE, 2021-2031 ($MILLION)
- TABLE 04. FLY TRAPS MARKET FOR FLY LIGHT TRAPS, BY REGION, 2021-2031 ($MILLION)
- TABLE 05. FLY TRAPS MARKET FOR FLY BAITS, BY REGION, 2021-2031 ($MILLION)
- TABLE 06. FLY TRAPS MARKET FOR DELTA TRAPS, BY REGION, 2021-2031 ($MILLION)
- TABLE 07. FLY TRAPS MARKET FOR OTHERS, BY REGION, 2021-2031 ($MILLION)
- TABLE 08. FLY TRAPS MARKET FOR STICKY, BY REGION, 2021-2031 ($MILLION)
- TABLE 09. FLY TRAPS MARKET FOR ELECTRIC, BY REGION, 2021-2031 ($MILLION)
- TABLE 10. GLOBAL FLY TRAPS MARKET, BY APPLICATION, 2021-2031 ($MILLION)
- TABLE 11. FLY TRAPS MARKET FOR RESIDENTIAL, BY REGION, 2021-2031 ($MILLION)
- TABLE 12. FLY TRAPS MARKET FOR COMMERCIAL, BY REGION, 2021-2031 ($MILLION)
- TABLE 13. GLOBAL COMMERCIAL FLY TRAPS MARKET, BY SUB TYPE, 2021-2031 ($MILLION)
- TABLE 14. FLY TRAPS MARKET FOR HORECA, BY REGION, 2021-2031 ($MILLION)
- TABLE 15. FLY TRAPS MARKET FOR FACTORIES, BY REGION, 2021-2031 ($MILLION)
- TABLE 16. FLY TRAPS MARKET FOR BUILDING MANAGEMENT, BY REGION, 2021-2031 ($MILLION)
- TABLE 17. FLY TRAPS MARKET FOR OTHERS, BY REGION, 2021-2031 ($MILLION)
- TABLE 18. GLOBAL FLY TRAPS MARKET, BY PRICE RANGE, 2021-2031 ($MILLION)
- TABLE 19. FLY TRAPS MARKET FOR LOW, BY REGION, 2021-2031 ($MILLION)
- TABLE 20. FLY TRAPS MARKET FOR MEDIUM, BY REGION, 2021-2031 ($MILLION)
- TABLE 21. FLY TRAPS MARKET FOR HIGH, BY REGION, 2021-2031 ($MILLION)
- TABLE 22. GLOBAL FLY TRAPS MARKET, BY DISTRIBUTION CHANNEL, 2021-2031 ($MILLION)
- TABLE 23. FLY TRAPS MARKET FOR SUPERMARKETS AND HYPERMARKETS, BY REGION, 2021-2031 ($MILLION)
- TABLE 24. FLY TRAPS MARKET FOR INDEPENDENT RETAIL STORES, BY REGION, 2021-2031 ($MILLION)
- TABLE 25. FLY TRAPS MARKET FOR E COMMERCE, BY REGION, 2021-2031 ($MILLION)
- TABLE 26. FLY TRAPS MARKET FOR OTHERS, BY REGION, 2021-2031 ($MILLION)
- TABLE 27. FLY TRAPS MARKET, BY REGION, 2021-2031 ($MILLION)
- TABLE 28. NORTH AMERICA FLY TRAPS MARKET, BY TYPE, 2021-2031 ($MILLION)
- TABLE 29. NORTH AMERICA CONTAINER FLY TRAPS MARKET, BY SUB TYPE, 2021-2031 ($MILLION)
- TABLE 30. NORTH AMERICA FLY TRAPS MARKET, BY APPLICATION, 2021-2031 ($MILLION)
- TABLE 31. NORTH AMERICA COMMERCIAL FLY TRAPS MARKET, BY SUB TYPE, 2021-2031 ($MILLION)
- TABLE 32. NORTH AMERICA FLY TRAPS MARKET, BY PRICE RANGE, 2021-2031 ($MILLION)
- TABLE 33. NORTH AMERICA FLY TRAPS MARKET, BY DISTRIBUTION CHANNEL, 2021-2031 ($MILLION)
- TABLE 34. NORTH AMERICA FLY TRAPS MARKET, BY COUNTRY, 2021-2031 ($MILLION)
- TABLE 35. U.S. FLY TRAPS MARKET, BY TYPE, 2021-2031 ($MILLION)
- TABLE 36. U.S. FLY TRAPS MARKET, BY APPLICATION, 2021-2031 ($MILLION)
- TABLE 37. U.S. FLY TRAPS MARKET, BY PRICE RANGE, 2021-2031 ($MILLION)
- TABLE 38. U.S. FLY TRAPS MARKET, BY DISTRIBUTION CHANNEL, 2021-2031 ($MILLION)
- TABLE 39. CANADA FLY TRAPS MARKET, BY TYPE, 2021-2031 ($MILLION)
- TABLE 40. CANADA FLY TRAPS MARKET, BY APPLICATION, 2021-2031 ($MILLION)
- TABLE 41. CANADA FLY TRAPS MARKET, BY PRICE RANGE, 2021-2031 ($MILLION)
- TABLE 42. CANADA FLY TRAPS MARKET, BY DISTRIBUTION CHANNEL, 2021-2031 ($MILLION)
- TABLE 43. MEXICO FLY TRAPS MARKET, BY TYPE, 2021-2031 ($MILLION)
- TABLE 44. MEXICO FLY TRAPS MARKET, BY APPLICATION, 2021-2031 ($MILLION)
- TABLE 45. MEXICO FLY TRAPS MARKET, BY PRICE RANGE, 2021-2031 ($MILLION)
- TABLE 46. MEXICO FLY TRAPS MARKET, BY DISTRIBUTION CHANNEL, 2021-2031 ($MILLION)
- TABLE 47. EUROPE FLY TRAPS MARKET, BY TYPE, 2021-2031 ($MILLION)
- TABLE 48. EUROPE CONTAINER FLY TRAPS MARKET, BY SUB TYPE, 2021-2031 ($MILLION)
- TABLE 49. EUROPE FLY TRAPS MARKET, BY APPLICATION, 2021-2031 ($MILLION)
- TABLE 50. EUROPE COMMERCIAL FLY TRAPS MARKET, BY SUB TYPE, 2021-2031 ($MILLION)
- TABLE 51. EUROPE FLY TRAPS MARKET, BY PRICE RANGE, 2021-2031 ($MILLION)
- TABLE 52. EUROPE FLY TRAPS MARKET, BY DISTRIBUTION CHANNEL, 2021-2031 ($MILLION)
- TABLE 53. EUROPE FLY TRAPS MARKET, BY COUNTRY, 2021-2031 ($MILLION)
- TABLE 54. GERMANY FLY TRAPS MARKET, BY TYPE, 2021-2031 ($MILLION)
- TABLE 55. GERMANY FLY TRAPS MARKET, BY APPLICATION, 2021-2031 ($MILLION)
- TABLE 56. GERMANY FLY TRAPS MARKET, BY PRICE RANGE, 2021-2031 ($MILLION)
- TABLE 57. GERMANY FLY TRAPS MARKET, BY DISTRIBUTION CHANNEL, 2021-2031 ($MILLION)
- TABLE 58. UK FLY TRAPS MARKET, BY TYPE, 2021-2031 ($MILLION)
- TABLE 59. UK FLY TRAPS MARKET, BY APPLICATION, 2021-2031 ($MILLION)
- TABLE 60. UK FLY TRAPS MARKET, BY PRICE RANGE, 2021-2031 ($MILLION)
- TABLE 61. UK FLY TRAPS MARKET, BY DISTRIBUTION CHANNEL, 2021-2031 ($MILLION)
- TABLE 62. FRANCE FLY TRAPS MARKET, BY TYPE, 2021-2031 ($MILLION)
- TABLE 63. FRANCE FLY TRAPS MARKET, BY APPLICATION, 2021-2031 ($MILLION)
- TABLE 64. FRANCE FLY TRAPS MARKET, BY PRICE RANGE, 2021-2031 ($MILLION)
- TABLE 65. FRANCE FLY TRAPS MARKET, BY DISTRIBUTION CHANNEL, 2021-2031 ($MILLION)
- TABLE 66. ITALY FLY TRAPS MARKET, BY TYPE, 2021-2031 ($MILLION)
- TABLE 67. ITALY FLY TRAPS MARKET, BY APPLICATION, 2021-2031 ($MILLION)
- TABLE 68. ITALY FLY TRAPS MARKET, BY PRICE RANGE, 2021-2031 ($MILLION)
- TABLE 69. ITALY FLY TRAPS MARKET, BY DISTRIBUTION CHANNEL, 2021-2031 ($MILLION)
- TABLE 70. SPAIN FLY TRAPS MARKET, BY TYPE, 2021-2031 ($MILLION)
- TABLE 71. SPAIN FLY TRAPS MARKET, BY APPLICATION, 2021-2031 ($MILLION)
- TABLE 72. SPAIN FLY TRAPS MARKET, BY PRICE RANGE, 2021-2031 ($MILLION)
- TABLE 73. SPAIN FLY TRAPS MARKET, BY DISTRIBUTION CHANNEL, 2021-2031 ($MILLION)
- TABLE 74. REST OF EUROPE FLY TRAPS MARKET, BY TYPE, 2021-2031 ($MILLION)
- TABLE 75. REST OF EUROPE FLY TRAPS MARKET, BY APPLICATION, 2021-2031 ($MILLION)
- TABLE 76. REST OF EUROPE FLY TRAPS MARKET, BY PRICE RANGE, 2021-2031 ($MILLION)
- TABLE 77. REST OF EUROPE FLY TRAPS MARKET, BY DISTRIBUTION CHANNEL, 2021-2031 ($MILLION)
- TABLE 78. ASIA-PACIFIC FLY TRAPS MARKET, BY TYPE, 2021-2031 ($MILLION)
- TABLE 79. ASIA-PACIFIC CONTAINER FLY TRAPS MARKET, BY SUB TYPE, 2021-2031 ($MILLION)
- TABLE 80. ASIA-PACIFIC FLY TRAPS MARKET, BY APPLICATION, 2021-2031 ($MILLION)
- TABLE 81. ASIA-PACIFIC COMMERCIAL FLY TRAPS MARKET, BY SUB TYPE, 2021-2031 ($MILLION)
- TABLE 82. ASIA-PACIFIC FLY TRAPS MARKET, BY PRICE RANGE, 2021-2031 ($MILLION)
- TABLE 83. ASIA-PACIFIC FLY TRAPS MARKET, BY DISTRIBUTION CHANNEL, 2021-2031 ($MILLION)
- TABLE 84. ASIA-PACIFIC FLY TRAPS MARKET, BY COUNTRY, 2021-2031 ($MILLION)
- TABLE 85. CHINA FLY TRAPS MARKET, BY TYPE, 2021-2031 ($MILLION)
- TABLE 86. CHINA FLY TRAPS MARKET, BY APPLICATION, 2021-2031 ($MILLION)
- TABLE 87. CHINA FLY TRAPS MARKET, BY PRICE RANGE, 2021-2031 ($MILLION)
- TABLE 88. CHINA FLY TRAPS MARKET, BY DISTRIBUTION CHANNEL, 2021-2031 ($MILLION)
- TABLE 89. JAPAN FLY TRAPS MARKET, BY TYPE, 2021-2031 ($MILLION)
- TABLE 90. JAPAN FLY TRAPS MARKET, BY APPLICATION, 2021-2031 ($MILLION)
- TABLE 91. JAPAN FLY TRAPS MARKET, BY PRICE RANGE, 2021-2031 ($MILLION)
- TABLE 92. JAPAN FLY TRAPS MARKET, BY DISTRIBUTION CHANNEL, 2021-2031 ($MILLION)
- TABLE 93. INDIA FLY TRAPS MARKET, BY TYPE, 2021-2031 ($MILLION)
- TABLE 94. INDIA FLY TRAPS MARKET, BY APPLICATION, 2021-2031 ($MILLION)
- TABLE 95. INDIA FLY TRAPS MARKET, BY PRICE RANGE, 2021-2031 ($MILLION)
- TABLE 96. INDIA FLY TRAPS MARKET, BY DISTRIBUTION CHANNEL, 2021-2031 ($MILLION)
- TABLE 97. AUSTRALIA FLY TRAPS MARKET, BY TYPE, 2021-2031 ($MILLION)
- TABLE 98. AUSTRALIA FLY TRAPS MARKET, BY APPLICATION, 2021-2031 ($MILLION)
- TABLE 99. AUSTRALIA FLY TRAPS MARKET, BY PRICE RANGE, 2021-2031 ($MILLION)
- TABLE 100. AUSTRALIA FLY TRAPS MARKET, BY DISTRIBUTION CHANNEL, 2021-2031 ($MILLION)
- TABLE 101. SOUTH KOREA FLY TRAPS MARKET, BY TYPE, 2021-2031 ($MILLION)
- TABLE 102. SOUTH KOREA FLY TRAPS MARKET, BY APPLICATION, 2021-2031 ($MILLION)
- TABLE 103. SOUTH KOREA FLY TRAPS MARKET, BY PRICE RANGE, 2021-2031 ($MILLION)
- TABLE 104. SOUTH KOREA FLY TRAPS MARKET, BY DISTRIBUTION CHANNEL, 2021-2031 ($MILLION)
- TABLE 105. REST OF ASIA-PACIFIC FLY TRAPS MARKET, BY TYPE, 2021-2031 ($MILLION)
- TABLE 106. REST OF ASIA-PACIFIC FLY TRAPS MARKET, BY APPLICATION, 2021-2031 ($MILLION)
- TABLE 107. REST OF ASIA-PACIFIC FLY TRAPS MARKET, BY PRICE RANGE, 2021-2031 ($MILLION)
- TABLE 108. REST OF ASIA-PACIFIC FLY TRAPS MARKET, BY DISTRIBUTION CHANNEL, 2021-2031 ($MILLION)
- TABLE 109. LAMEA FLY TRAPS MARKET, BY TYPE, 2021-2031 ($MILLION)
- TABLE 110. LAMEA CONTAINER FLY TRAPS MARKET, BY SUB TYPE, 2021-2031 ($MILLION)
- TABLE 111. LAMEA FLY TRAPS MARKET, BY APPLICATION, 2021-2031 ($MILLION)
- TABLE 112. LAMEA COMMERCIAL FLY TRAPS MARKET, BY SUB TYPE, 2021-2031 ($MILLION)
- TABLE 113. LAMEA FLY TRAPS MARKET, BY PRICE RANGE, 2021-2031 ($MILLION)
- TABLE 114. LAMEA FLY TRAPS MARKET, BY DISTRIBUTION CHANNEL, 2021-2031 ($MILLION)
- TABLE 115. LAMEA FLY TRAPS MARKET, BY COUNTRY, 2021-2031 ($MILLION)
- TABLE 116. BRAZIL FLY TRAPS MARKET, BY TYPE, 2021-2031 ($MILLION)
- TABLE 117. BRAZIL FLY TRAPS MARKET, BY APPLICATION, 2021-2031 ($MILLION)
- TABLE 118. BRAZIL FLY TRAPS MARKET, BY PRICE RANGE, 2021-2031 ($MILLION)
- TABLE 119. BRAZIL FLY TRAPS MARKET, BY DISTRIBUTION CHANNEL, 2021-2031 ($MILLION)
- TABLE 120. SAUDI ARABIA FLY TRAPS MARKET, BY TYPE, 2021-2031 ($MILLION)
- TABLE 121. SAUDI ARABIA FLY TRAPS MARKET, BY APPLICATION, 2021-2031 ($MILLION)
- TABLE 122. SAUDI ARABIA FLY TRAPS MARKET, BY PRICE RANGE, 2021-2031 ($MILLION)
- TABLE 123. SAUDI ARABIA FLY TRAPS MARKET, BY DISTRIBUTION CHANNEL, 2021-2031 ($MILLION)
- TABLE 124. SOUTH AFRICA FLY TRAPS MARKET, BY TYPE, 2021-2031 ($MILLION)
- TABLE 125. SOUTH AFRICA FLY TRAPS MARKET, BY APPLICATION, 2021-2031 ($MILLION)
- TABLE 126. SOUTH AFRICA FLY TRAPS MARKET, BY PRICE RANGE, 2021-2031 ($MILLION)
- TABLE 127. SOUTH AFRICA FLY TRAPS MARKET, BY DISTRIBUTION CHANNEL, 2021-2031 ($MILLION)
- TABLE 128. REST OF LAMEA FLY TRAPS MARKET, BY TYPE, 2021-2031 ($MILLION)
- TABLE 129. REST OF LAMEA FLY TRAPS MARKET, BY APPLICATION, 2021-2031 ($MILLION)
- TABLE 130. REST OF LAMEA FLY TRAPS MARKET, BY PRICE RANGE, 2021-2031 ($MILLION)
- TABLE 131. REST OF LAMEA FLY TRAPS MARKET, BY DISTRIBUTION CHANNEL, 2021-2031 ($MILLION)
- TABLE 132. AGRI PHERO SOLUTIONZ: KEY EXECUTIVES
- TABLE 133. AGRI PHERO SOLUTIONZ: COMPANY SNAPSHOT
- TABLE 134. CLEANRTH: KEY EXECUTIVES
- TABLE 135. CLEANRTH: COMPANY SNAPSHOT
- TABLE 136. ECO TRAP GUARD: KEY EXECUTIVES
- TABLE 137. ECO TRAP GUARD: COMPANY SNAPSHOT
- TABLE 138. ECOMAN BIOTECH: KEY EXECUTIVES
- TABLE 139. ECOMAN BIOTECH: COMPANY SNAPSHOT
- TABLE 140. FLIES BE GONE: KEY EXECUTIVES
- TABLE 141. FLIES BE GONE: COMPANY SNAPSHOT
- TABLE 142. GODWILL ENERGY PRODUCTS PRIVATE LIMITED: KEY EXECUTIVES
- TABLE 143. GODWILL ENERGY PRODUCTS PRIVATE LIMITED: COMPANY SNAPSHOT
- TABLE 144. ARBICO ORGANICS: KEY EXECUTIVES
- TABLE 145. ARBICO ORGANICS: COMPANY SNAPSHOT
- TABLE 146. KATCHY BUG: KEY EXECUTIVES
- TABLE 147. KATCHY BUG: COMPANY SNAPSHOT
- TABLE 148. MCQWIN INDUSTRIES: KEY EXECUTIVES
- TABLE 149. MCQWIN INDUSTRIES: COMPANY SNAPSHOT
- TABLE 150. PESTRONICS: KEY EXECUTIVES
- TABLE 151. PESTRONICS: COMPANY SNAPSHOT
- TABLE 152. RESCUE COMPANY: KEY EXECUTIVES
- TABLE 153. RESCUE COMPANY: COMPANY SNAPSHOT
- TABLE 154. REZA HYGIENE: KEY EXECUTIVES
- TABLE 155. REZA HYGIENE: COMPANY SNAPSHOT
- TABLE 156. RSVP INTERNATIONAL: KEY EXECUTIVES
- TABLE 157. RSVP INTERNATIONAL: COMPANY SNAPSHOT
- TABLE 158. STERLING INTERNATIONAL, INC./RESCUE!A® PEST CONTROL PRODUCTS: KEY EXECUTIVES
- TABLE 159. STERLING INTERNATIONAL, INC./RESCUE!A® PEST CONTROL PRODUCTS: COMPANY SNAPSHOT
- TABLE 160. WOODSTREAM CORPORATION: KEY EXECUTIVES
- TABLE 161. WOODSTREAM CORPORATION: COMPANY SNAPSHOT
LIST OF FIGURES
- FIGURE 01. FLY TRAPS MARKET, 2021-2031
- FIGURE 02. SEGMENTATION OF FLY TRAPS MARKET, 2021-2031
- FIGURE 03. TOP INVESTMENT POCKETS IN FLY TRAPS MARKET (2022-2031)
- FIGURE 04. PORTER FIVE-1
- FIGURE 05. PORTER FIVE-2
- FIGURE 06. PORTER FIVE-3
- FIGURE 07. PORTER FIVE-4
- FIGURE 08. PORTER FIVE-5
- FIGURE 09. DRIVERS, RESTRAINTS AND OPPORTUNITIES: GLOBALFLY TRAPS MARKET
- FIGURE 10. MARKET SHARE ANALYSIS: FLY TRAPS MARKET
- FIGURE 11. PRICING ANALYSIS: FLY TRAPS MARKET 2021 AND 2031
- FIGURE 12. FLY TRAPS MARKET, BY TYPE, 2021(%)
- FIGURE 13. COMPARATIVE SHARE ANALYSIS OF FLY TRAPS MARKET FOR CONTAINER, BY COUNTRY 2021 AND 2031(%)
- FIGURE 14. COMPARATIVE SHARE ANALYSIS OF FLY TRAPS MARKET FOR STICKY, BY COUNTRY 2021 AND 2031(%)
- FIGURE 15. COMPARATIVE SHARE ANALYSIS OF FLY TRAPS MARKET FOR ELECTRIC, BY COUNTRY 2021 AND 2031(%)
- FIGURE 16. FLY TRAPS MARKET, BY APPLICATION, 2021(%)
- FIGURE 17. COMPARATIVE SHARE ANALYSIS OF FLY TRAPS MARKET FOR RESIDENTIAL, BY COUNTRY 2021 AND 2031(%)
- FIGURE 18. COMPARATIVE SHARE ANALYSIS OF FLY TRAPS MARKET FOR COMMERCIAL, BY COUNTRY 2021 AND 2031(%)
- FIGURE 19. FLY TRAPS MARKET, BY PRICE RANGE, 2021(%)
- FIGURE 20. COMPARATIVE SHARE ANALYSIS OF FLY TRAPS MARKET FOR LOW, BY COUNTRY 2021 AND 2031(%)
- FIGURE 21. COMPARATIVE SHARE ANALYSIS OF FLY TRAPS MARKET FOR MEDIUM, BY COUNTRY 2021 AND 2031(%)
- FIGURE 22. COMPARATIVE SHARE ANALYSIS OF FLY TRAPS MARKET FOR HIGH, BY COUNTRY 2021 AND 2031(%)
- FIGURE 23. FLY TRAPS MARKET, BY DISTRIBUTION CHANNEL, 2021(%)
- FIGURE 24. COMPARATIVE SHARE ANALYSIS OF FLY TRAPS MARKET FOR SUPERMARKETS AND HYPERMARKETS, BY COUNTRY 2021 AND 2031(%)
- FIGURE 25. COMPARATIVE SHARE ANALYSIS OF FLY TRAPS MARKET FOR INDEPENDENT RETAIL STORES, BY COUNTRY 2021 AND 2031(%)
- FIGURE 26. COMPARATIVE SHARE ANALYSIS OF FLY TRAPS MARKET FOR E COMMERCE, BY COUNTRY 2021 AND 2031(%)
- FIGURE 27. COMPARATIVE SHARE ANALYSIS OF FLY TRAPS MARKET FOR OTHERS, BY COUNTRY 2021 AND 2031(%)
- FIGURE 28. FLY TRAPS MARKET BY REGION, 2021
- FIGURE 29. U.S. FLY TRAPS MARKET, 2021-2031 ($MILLION)
- FIGURE 30. CANADA FLY TRAPS MARKET, 2021-2031 ($MILLION)
- FIGURE 31. MEXICO FLY TRAPS MARKET, 2021-2031 ($MILLION)
- FIGURE 32. GERMANY FLY TRAPS MARKET, 2021-2031 ($MILLION)
- FIGURE 33. UK FLY TRAPS MARKET, 2021-2031 ($MILLION)
- FIGURE 34. FRANCE FLY TRAPS MARKET, 2021-2031 ($MILLION)
- FIGURE 35. ITALY FLY TRAPS MARKET, 2021-2031 ($MILLION)
- FIGURE 36. SPAIN FLY TRAPS MARKET, 2021-2031 ($MILLION)
- FIGURE 37. REST OF EUROPE FLY TRAPS MARKET, 2021-2031 ($MILLION)
- FIGURE 38. CHINA FLY TRAPS MARKET, 2021-2031 ($MILLION)
- FIGURE 39. JAPAN FLY TRAPS MARKET, 2021-2031 ($MILLION)
- FIGURE 40. INDIA FLY TRAPS MARKET, 2021-2031 ($MILLION)
- FIGURE 41. AUSTRALIA FLY TRAPS MARKET, 2021-2031 ($MILLION)
- FIGURE 42. SOUTH KOREA FLY TRAPS MARKET, 2021-2031 ($MILLION)
- FIGURE 43. REST OF ASIA-PACIFIC FLY TRAPS MARKET, 2021-2031 ($MILLION)
- FIGURE 44. BRAZIL FLY TRAPS MARKET, 2021-2031 ($MILLION)
- FIGURE 45. SAUDI ARABIA FLY TRAPS MARKET, 2021-2031 ($MILLION)
- FIGURE 46. SOUTH AFRICA FLY TRAPS MARKET, 2021-2031 ($MILLION)
- FIGURE 47. REST OF LAMEA FLY TRAPS MARKET, 2021-2031 ($MILLION)
- FIGURE 48. TOP WINNING STRATEGIES, BY YEAR
- FIGURE 49. TOP WINNING STRATEGIES, BY DEVELOPMENT
- FIGURE 50. TOP WINNING STRATEGIES, BY COMPANY
- FIGURE 51. PRODUCT MAPPING OF TOP 10 PLAYERS
- FIGURE 52. COMPETITIVE DASHBOARD
- FIGURE 53. COMPETITIVE HEATMAP: FLY TRAPS MARKET
- FIGURE 54. TOP PLAYER POSITIONING, 2021

