
PUBLISHER: Allied Market Research | PRODUCT CODE: 1344509

PUBLISHER: Allied Market Research | PRODUCT CODE: 1344509
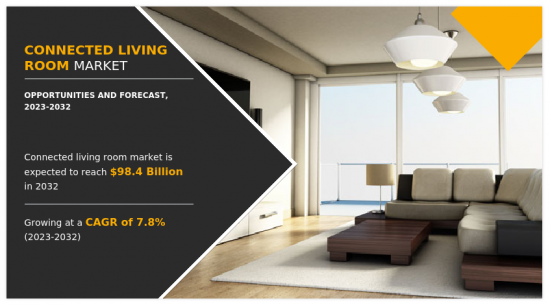
Connected Living Room Market By Product Type, By Application, By Component: Global Opportunity Analysis and Industry Forecast, 2023-2032
According to a new report published by Allied Market Research, titled, "Connected Living Room Market," The connected living room market was valued at $47.26 billion in 2022, and is estimated to reach $98.4 billion by 2032, growing at a CAGR of 7.8% from 2023 to 2032.
A connected living room is a living environment that is outfitted with interconnected devices, technologies, and services that improve the entertainment and connectivity experience for users. It involves connecting and interacting with numerous smart gadgets such as smart TVs, video streaming devices, gaming consoles, audio systems, and smart home automation systems.
The growth of the global connected living room market is driven by an increase in consumer demand for seamless and integrated entertainment experiences. This demand is fueled by the popularity of streaming services, the proliferation of smart home devices, and advancements in technology, driving the growth of connected living room solutions. Furthermore, the integration of artificial intelligence (AI) technologies, such as machine learning and natural language processing, can enhance user experiences, provide personalized content recommendations, and make the living room ecosystem more intelligent and intuitive. However, the issue of interoperability and compatibility between different devices and platforms can hinder seamless integration and limit the overall user experience.
The main aim is to improve convenience, entertainment alternatives, and interconnection in the living room, offering users a more pleasurable and customized entertainment experience. These devices are designed to provide easy access to a variety of content such as streaming services, movies, TV shows, and music. Users can utilize them to remotely control their entertainment systems and devices, personalize their preferences, and enjoy interactive and connected experiences. Furthermore, connected living room devices frequently combine with other smart home technologies, allowing users to automate and control many aspects of their living environment, such as lighting, temperature, and security.
The connected living room market is segmented into product type, application, component, and region. On the basis of product type, the market is divided into smart TVs, gaming console, computer and laptop, smart speaker, smartphones and tablets, security systems, and lighting systems. On the basis of application, the market is categorized into video streaming, audio streaming, gaming, and security. On the basis of components, the market is segmented into sensors, thermostats, cameras, communication devices, and others.
On the basis of region, it is analyzed across North America (the U.S., Canada, and Mexico), Europe (UK, Germany, France, and Rest of Europe), Asia-Pacific (China, Japan, India, South Korea, and rest of Asia-Pacific), and LAMEA (Latin America, the Middle East, and Africa).
The key players profiled in the connected living room market, such as LG Electronics Inc., Roku Inc., Google Inc., Apple Inc., Amazon Inc, Samsung Corporation, Honeywell International Inc., Panasonic Corporation, Toshiba Corporation, and Signify Holding are provided in this report. Market players have adopted various strategies such as product launches, and acquisitions, to expand their foothold in the connected living room market.
KEY MARKET SEGMENTS
By Product Type
- Smart TVs
- Gaming Consoles
- Computer and Laptop
- Smart Speakers
- Smartphones and Tablets
- Security system
- Lighting system
By Application
- Video Streaming
- Audio Streaming
- Gaming
- Security
By Component
- Sensors
- Thermostats
- Cameras
- Communication Device
- Others
By Region
- North America
- U.S.
- Canada
- Mexico
- Europe
- Germany
- France
- UK
- Rest of Europe
- Asia-Pacific
- China
- Japan
- India
- South Korea
- Rest of Asia-Pacific
- LAMEA
- Latin America
- Middle East
- Africa
KEY PLAYERS
- LG Electronics Inc.
- Roku Inc.
- Google Inc.
- Apple Inc.,
- Amazon Inc
- Samsung corporation
- Honeywell
- Panasonic Corporation,
- Signify Holding
- Toshiba Corporation
Key Benefits For Stakeholders
- This report provides a quantitative analysis of the market segments, current trends, estimations, and dynamics of the connected living room market analysis from 2022 to 2032 to identify the prevailing connected living room market opportunities.
- The market research is offered along with information related to key drivers, restraints, and opportunities.
- Porter's five forces analysis highlights the potency of buyers and suppliers to enable stakeholders make profit-oriented business decisions and strengthen their supplier-buyer network.
- In-depth analysis of the connected living room market segmentation assists to determine the prevailing market opportunities.
- Major countries in each region are mapped according to their revenue contribution to the global market.
- Market player positioning facilitates benchmarking and provides a clear understanding of the present position of the market players.
- The report includes the analysis of the regional as well as global connected living room market trends, key players, market segments, application areas, and market growth strategies.
Key Market Segments
By Product Type
- Smart TVs
- Gaming Consoles
- Computer and Laptop
- Smart Speakers
- Smartphones and Tablets
- Security system
- Lighting system
By Application
- Video Streaming
- Audio Streaming
- Gaming
- Security
By Component
- Sensors
- Thermostats
- Cameras
- Communication Device
- Others
By Region
- North America
- U.S.
- Canada
- Mexico
- Europe
- Germany
- France
- UK
- Rest of Europe
- Asia-Pacific
- China
- Japan
- India
- South Korea
- Rest of Asia-Pacific
- LAMEA
- Latin America
- Middle East
- Africa
Key Market Players:
- Amazon.com, Inc.
- Apple Inc.
- Google LLC
- Honeywell International Inc.
- LG Electronics Inc.
- Panasonic Holdings Corporation
- Roku, Inc.
- SAMSUNG ELECTRONICS CO., LTD.
- Signify Holding
- Toshiba Corporation
TABLE OF CONTENTS
CHAPTER 1: INTRODUCTION
- 1.1. Report description
- 1.2. Key market segments
- 1.3. Key benefits to the stakeholders
- 1.4. Research Methodology
- 1.4.1. Primary research
- 1.4.2. Secondary research
- 1.4.3. Analyst tools and models
CHAPTER 2: EXECUTIVE SUMMARY
- 2.1. CXO Perspective
CHAPTER 3: MARKET OVERVIEW
- 3.1. Market definition and scope
- 3.2. Key findings
- 3.2.1. Top impacting factors
- 3.2.2. Top investment pockets
- 3.3. Porter's five forces analysis
- 3.3.1. Bargaining power of suppliers
- 3.3.2. Bargaining power of buyers
- 3.3.3. Threat of substitutes
- 3.3.4. Threat of new entrants
- 3.3.5. Intensity of rivalry
- 3.4. Market dynamics
- 3.4.1. Drivers
- 3.4.1.1. The rise in popularity of online media streaming
- 3.4.1.2. The rise of voice-controlled devices and virtual assistants
- 3.4.1. Drivers
- 3.4.2. Restraints
- 3.4.2.1. High deployment costs
- 3.4.3. Opportunities
- 3.4.3.1. Increasing adoption of smart TVs
- 3.5. COVID-19 Impact Analysis on the market
CHAPTER 4: CONNECTED LIVING ROOM MARKET, BY PRODUCT TYPE
- 4.1. Overview
- 4.1.1. Market size and forecast
- 4.2. Smart TVs
- 4.2.1. Key market trends, growth factors and opportunities
- 4.2.2. Market size and forecast, by region
- 4.2.3. Market share analysis by country
- 4.3. Gaming Consoles
- 4.3.1. Key market trends, growth factors and opportunities
- 4.3.2. Market size and forecast, by region
- 4.3.3. Market share analysis by country
- 4.4. Computer and Laptop
- 4.4.1. Key market trends, growth factors and opportunities
- 4.4.2. Market size and forecast, by region
- 4.4.3. Market share analysis by country
- 4.5. Smart Speakers
- 4.5.1. Key market trends, growth factors and opportunities
- 4.5.2. Market size and forecast, by region
- 4.5.3. Market share analysis by country
- 4.6. Smartphones and Tablets
- 4.6.1. Key market trends, growth factors and opportunities
- 4.6.2. Market size and forecast, by region
- 4.6.3. Market share analysis by country
- 4.7. Security system
- 4.7.1. Key market trends, growth factors and opportunities
- 4.7.2. Market size and forecast, by region
- 4.7.3. Market share analysis by country
- 4.8. Lighting system
- 4.8.1. Key market trends, growth factors and opportunities
- 4.8.2. Market size and forecast, by region
- 4.8.3. Market share analysis by country
CHAPTER 5: CONNECTED LIVING ROOM MARKET, BY APPLICATION
- 5.1. Overview
- 5.1.1. Market size and forecast
- 5.2. Video Streaming
- 5.2.1. Key market trends, growth factors and opportunities
- 5.2.2. Market size and forecast, by region
- 5.2.3. Market share analysis by country
- 5.3. Audio Streaming
- 5.3.1. Key market trends, growth factors and opportunities
- 5.3.2. Market size and forecast, by region
- 5.3.3. Market share analysis by country
- 5.4. Gaming
- 5.4.1. Key market trends, growth factors and opportunities
- 5.4.2. Market size and forecast, by region
- 5.4.3. Market share analysis by country
- 5.5. Security
- 5.5.1. Key market trends, growth factors and opportunities
- 5.5.2. Market size and forecast, by region
- 5.5.3. Market share analysis by country
CHAPTER 6: CONNECTED LIVING ROOM MARKET, BY COMPONENT
- 6.1. Overview
- 6.1.1. Market size and forecast
- 6.2. Sensors
- 6.2.1. Key market trends, growth factors and opportunities
- 6.2.2. Market size and forecast, by region
- 6.2.3. Market share analysis by country
- 6.3. Thermostats
- 6.3.1. Key market trends, growth factors and opportunities
- 6.3.2. Market size and forecast, by region
- 6.3.3. Market share analysis by country
- 6.4. Cameras
- 6.4.1. Key market trends, growth factors and opportunities
- 6.4.2. Market size and forecast, by region
- 6.4.3. Market share analysis by country
- 6.5. Communication Device
- 6.5.1. Key market trends, growth factors and opportunities
- 6.5.2. Market size and forecast, by region
- 6.5.3. Market share analysis by country
- 6.6. Others
- 6.6.1. Key market trends, growth factors and opportunities
- 6.6.2. Market size and forecast, by region
- 6.6.3. Market share analysis by country
CHAPTER 7: CONNECTED LIVING ROOM MARKET, BY REGION
- 7.1. Overview
- 7.1.1. Market size and forecast By Region
- 7.2. North America
- 7.2.1. Key trends and opportunities
- 7.2.2. Market size and forecast, by Product Type
- 7.2.3. Market size and forecast, by Application
- 7.2.4. Market size and forecast, by Component
- 7.2.5. Market size and forecast, by country
- 7.2.5.1. U.S.
- 7.2.5.1.1. Key market trends, growth factors and opportunities
- 7.2.5.1.2. Market size and forecast, by Product Type
- 7.2.5.1.3. Market size and forecast, by Application
- 7.2.5.1.4. Market size and forecast, by Component
- 7.2.5.2. Canada
- 7.2.5.2.1. Key market trends, growth factors and opportunities
- 7.2.5.2.2. Market size and forecast, by Product Type
- 7.2.5.2.3. Market size and forecast, by Application
- 7.2.5.2.4. Market size and forecast, by Component
- 7.2.5.3. Mexico
- 7.2.5.3.1. Key market trends, growth factors and opportunities
- 7.2.5.3.2. Market size and forecast, by Product Type
- 7.2.5.3.3. Market size and forecast, by Application
- 7.2.5.3.4. Market size and forecast, by Component
- 7.3. Europe
- 7.3.1. Key trends and opportunities
- 7.3.2. Market size and forecast, by Product Type
- 7.3.3. Market size and forecast, by Application
- 7.3.4. Market size and forecast, by Component
- 7.3.5. Market size and forecast, by country
- 7.3.5.1. Germany
- 7.3.5.1.1. Key market trends, growth factors and opportunities
- 7.3.5.1.2. Market size and forecast, by Product Type
- 7.3.5.1.3. Market size and forecast, by Application
- 7.3.5.1.4. Market size and forecast, by Component
- 7.3.5.2. France
- 7.3.5.2.1. Key market trends, growth factors and opportunities
- 7.3.5.2.2. Market size and forecast, by Product Type
- 7.3.5.2.3. Market size and forecast, by Application
- 7.3.5.2.4. Market size and forecast, by Component
- 7.3.5.3. UK
- 7.3.5.3.1. Key market trends, growth factors and opportunities
- 7.3.5.3.2. Market size and forecast, by Product Type
- 7.3.5.3.3. Market size and forecast, by Application
- 7.3.5.3.4. Market size and forecast, by Component
- 7.3.5.4. Rest of Europe
- 7.3.5.4.1. Key market trends, growth factors and opportunities
- 7.3.5.4.2. Market size and forecast, by Product Type
- 7.3.5.4.3. Market size and forecast, by Application
- 7.3.5.4.4. Market size and forecast, by Component
- 7.4. Asia-Pacific
- 7.4.1. Key trends and opportunities
- 7.4.2. Market size and forecast, by Product Type
- 7.4.3. Market size and forecast, by Application
- 7.4.4. Market size and forecast, by Component
- 7.4.5. Market size and forecast, by country
- 7.4.5.1. China
- 7.4.5.1.1. Key market trends, growth factors and opportunities
- 7.4.5.1.2. Market size and forecast, by Product Type
- 7.4.5.1.3. Market size and forecast, by Application
- 7.4.5.1.4. Market size and forecast, by Component
- 7.4.5.2. Japan
- 7.4.5.2.1. Key market trends, growth factors and opportunities
- 7.4.5.2.2. Market size and forecast, by Product Type
- 7.4.5.2.3. Market size and forecast, by Application
- 7.4.5.2.4. Market size and forecast, by Component
- 7.4.5.3. India
- 7.4.5.3.1. Key market trends, growth factors and opportunities
- 7.4.5.3.2. Market size and forecast, by Product Type
- 7.4.5.3.3. Market size and forecast, by Application
- 7.4.5.3.4. Market size and forecast, by Component
- 7.4.5.4. South Korea
- 7.4.5.4.1. Key market trends, growth factors and opportunities
- 7.4.5.4.2. Market size and forecast, by Product Type
- 7.4.5.4.3. Market size and forecast, by Application
- 7.4.5.4.4. Market size and forecast, by Component
- 7.4.5.5. Rest of Asia-Pacific
- 7.4.5.5.1. Key market trends, growth factors and opportunities
- 7.4.5.5.2. Market size and forecast, by Product Type
- 7.4.5.5.3. Market size and forecast, by Application
- 7.4.5.5.4. Market size and forecast, by Component
- 7.5. LAMEA
- 7.5.1. Key trends and opportunities
- 7.5.2. Market size and forecast, by Product Type
- 7.5.3. Market size and forecast, by Application
- 7.5.4. Market size and forecast, by Component
- 7.5.5. Market size and forecast, by country
- 7.5.5.1. Latin America
- 7.5.5.1.1. Key market trends, growth factors and opportunities
- 7.5.5.1.2. Market size and forecast, by Product Type
- 7.5.5.1.3. Market size and forecast, by Application
- 7.5.5.1.4. Market size and forecast, by Component
- 7.5.5.2. Middle East
- 7.5.5.2.1. Key market trends, growth factors and opportunities
- 7.5.5.2.2. Market size and forecast, by Product Type
- 7.5.5.2.3. Market size and forecast, by Application
- 7.5.5.2.4. Market size and forecast, by Component
- 7.5.5.3. Africa
- 7.5.5.3.1. Key market trends, growth factors and opportunities
- 7.5.5.3.2. Market size and forecast, by Product Type
- 7.5.5.3.3. Market size and forecast, by Application
- 7.5.5.3.4. Market size and forecast, by Component
CHAPTER 8: COMPETITIVE LANDSCAPE
- 8.1. Introduction
- 8.2. Top winning strategies
- 8.3. Product Mapping of Top 10 Player
- 8.4. Competitive Dashboard
- 8.5. Competitive Heatmap
- 8.6. Top player positioning, 2022
CHAPTER 9: COMPANY PROFILES
- 9.1. LG Electronics Inc.
- 9.1.1. Company overview
- 9.1.2. Key Executives
- 9.1.3. Company snapshot
- 9.1.4. Operating business segments
- 9.1.5. Product portfolio
- 9.1.6. Business performance
- 9.2. Roku, Inc.
- 9.2.1. Company overview
- 9.2.2. Key Executives
- 9.2.3. Company snapshot
- 9.2.4. Operating business segments
- 9.2.5. Product portfolio
- 9.2.6. Business performance
- 9.2.7. Key strategic moves and developments
- 9.3. Apple Inc.
- 9.3.1. Company overview
- 9.3.2. Key Executives
- 9.3.3. Company snapshot
- 9.3.4. Operating business segments
- 9.3.5. Product portfolio
- 9.3.6. Business performance
- 9.3.7. Key strategic moves and developments
- 9.4. Amazon.com, Inc.
- 9.4.1. Company overview
- 9.4.2. Key Executives
- 9.4.3. Company snapshot
- 9.4.4. Operating business segments
- 9.4.5. Product portfolio
- 9.4.6. Business performance
- 9.5. SAMSUNG ELECTRONICS CO., LTD.
- 9.5.1. Company overview
- 9.5.2. Key Executives
- 9.5.3. Company snapshot
- 9.5.4. Operating business segments
- 9.5.5. Product portfolio
- 9.5.6. Business performance
- 9.6. Honeywell International Inc.
- 9.6.1. Company overview
- 9.6.2. Key Executives
- 9.6.3. Company snapshot
- 9.6.4. Operating business segments
- 9.6.5. Product portfolio
- 9.6.6. Business performance
- 9.7. Panasonic Holdings Corporation
- 9.7.1. Company overview
- 9.7.2. Key Executives
- 9.7.3. Company snapshot
- 9.7.4. Operating business segments
- 9.7.5. Product portfolio
- 9.7.6. Business performance
- 9.7.7. Key strategic moves and developments
- 9.8. Toshiba Corporation
- 9.8.1. Company overview
- 9.8.2. Key Executives
- 9.8.3. Company snapshot
- 9.8.4. Operating business segments
- 9.8.5. Product portfolio
- 9.8.6. Business performance
- 9.9. Signify Holding
- 9.9.1. Company overview
- 9.9.2. Key Executives
- 9.9.3. Company snapshot
- 9.9.4. Operating business segments
- 9.9.5. Product portfolio
- 9.9.6. Business performance
- 9.10. Google LLC
- 9.10.1. Company overview
- 9.10.2. Key Executives
- 9.10.3. Company snapshot
- 9.10.4. Operating business segments
- 9.10.5. Product portfolio
- 9.10.6. Business performance
- 9.10.7. Key strategic moves and developments
LIST OF TABLES
- TABLE 01. GLOBAL CONNECTED LIVING ROOM MARKET, BY PRODUCT TYPE, 2022-2032 ($BILLION)
- TABLE 02. CONNECTED LIVING ROOM MARKET FOR SMART TVS, BY REGION, 2022-2032 ($BILLION)
- TABLE 03. CONNECTED LIVING ROOM MARKET FOR GAMING CONSOLES, BY REGION, 2022-2032 ($BILLION)
- TABLE 04. CONNECTED LIVING ROOM MARKET FOR COMPUTER AND LAPTOP, BY REGION, 2022-2032 ($BILLION)
- TABLE 05. CONNECTED LIVING ROOM MARKET FOR SMART SPEAKERS, BY REGION, 2022-2032 ($BILLION)
- TABLE 06. CONNECTED LIVING ROOM MARKET FOR SMARTPHONES AND TABLETS, BY REGION, 2022-2032 ($BILLION)
- TABLE 07. CONNECTED LIVING ROOM MARKET FOR SECURITY SYSTEM, BY REGION, 2022-2032 ($BILLION)
- TABLE 08. CONNECTED LIVING ROOM MARKET FOR LIGHTING SYSTEM, BY REGION, 2022-2032 ($BILLION)
- TABLE 09. GLOBAL CONNECTED LIVING ROOM MARKET, BY APPLICATION, 2022-2032 ($BILLION)
- TABLE 10. CONNECTED LIVING ROOM MARKET FOR VIDEO STREAMING, BY REGION, 2022-2032 ($BILLION)
- TABLE 11. CONNECTED LIVING ROOM MARKET FOR AUDIO STREAMING, BY REGION, 2022-2032 ($BILLION)
- TABLE 12. CONNECTED LIVING ROOM MARKET FOR GAMING, BY REGION, 2022-2032 ($BILLION)
- TABLE 13. CONNECTED LIVING ROOM MARKET FOR SECURITY, BY REGION, 2022-2032 ($BILLION)
- TABLE 14. GLOBAL CONNECTED LIVING ROOM MARKET, BY COMPONENT, 2022-2032 ($BILLION)
- TABLE 15. CONNECTED LIVING ROOM MARKET FOR SENSORS, BY REGION, 2022-2032 ($BILLION)
- TABLE 16. CONNECTED LIVING ROOM MARKET FOR THERMOSTATS, BY REGION, 2022-2032 ($BILLION)
- TABLE 17. CONNECTED LIVING ROOM MARKET FOR CAMERAS, BY REGION, 2022-2032 ($BILLION)
- TABLE 18. CONNECTED LIVING ROOM MARKET FOR COMMUNICATION DEVICE, BY REGION, 2022-2032 ($BILLION)
- TABLE 19. CONNECTED LIVING ROOM MARKET FOR OTHERS, BY REGION, 2022-2032 ($BILLION)
- TABLE 20. CONNECTED LIVING ROOM MARKET, BY REGION, 2022-2032 ($BILLION)
- TABLE 21. NORTH AMERICA CONNECTED LIVING ROOM MARKET, BY PRODUCT TYPE, 2022-2032 ($BILLION)
- TABLE 22. NORTH AMERICA CONNECTED LIVING ROOM MARKET, BY APPLICATION, 2022-2032 ($BILLION)
- TABLE 23. NORTH AMERICA CONNECTED LIVING ROOM MARKET, BY COMPONENT, 2022-2032 ($BILLION)
- TABLE 24. NORTH AMERICA CONNECTED LIVING ROOM MARKET, BY COUNTRY, 2022-2032 ($BILLION)
- TABLE 25. U.S. CONNECTED LIVING ROOM MARKET, BY PRODUCT TYPE, 2022-2032 ($BILLION)
- TABLE 26. U.S. CONNECTED LIVING ROOM MARKET, BY APPLICATION, 2022-2032 ($BILLION)
- TABLE 27. U.S. CONNECTED LIVING ROOM MARKET, BY COMPONENT, 2022-2032 ($BILLION)
- TABLE 28. CANADA CONNECTED LIVING ROOM MARKET, BY PRODUCT TYPE, 2022-2032 ($BILLION)
- TABLE 29. CANADA CONNECTED LIVING ROOM MARKET, BY APPLICATION, 2022-2032 ($BILLION)
- TABLE 30. CANADA CONNECTED LIVING ROOM MARKET, BY COMPONENT, 2022-2032 ($BILLION)
- TABLE 31. MEXICO CONNECTED LIVING ROOM MARKET, BY PRODUCT TYPE, 2022-2032 ($BILLION)
- TABLE 32. MEXICO CONNECTED LIVING ROOM MARKET, BY APPLICATION, 2022-2032 ($BILLION)
- TABLE 33. MEXICO CONNECTED LIVING ROOM MARKET, BY COMPONENT, 2022-2032 ($BILLION)
- TABLE 34. EUROPE CONNECTED LIVING ROOM MARKET, BY PRODUCT TYPE, 2022-2032 ($BILLION)
- TABLE 35. EUROPE CONNECTED LIVING ROOM MARKET, BY APPLICATION, 2022-2032 ($BILLION)
- TABLE 36. EUROPE CONNECTED LIVING ROOM MARKET, BY COMPONENT, 2022-2032 ($BILLION)
- TABLE 37. EUROPE CONNECTED LIVING ROOM MARKET, BY COUNTRY, 2022-2032 ($BILLION)
- TABLE 38. GERMANY CONNECTED LIVING ROOM MARKET, BY PRODUCT TYPE, 2022-2032 ($BILLION)
- TABLE 39. GERMANY CONNECTED LIVING ROOM MARKET, BY APPLICATION, 2022-2032 ($BILLION)
- TABLE 40. GERMANY CONNECTED LIVING ROOM MARKET, BY COMPONENT, 2022-2032 ($BILLION)
- TABLE 41. FRANCE CONNECTED LIVING ROOM MARKET, BY PRODUCT TYPE, 2022-2032 ($BILLION)
- TABLE 42. FRANCE CONNECTED LIVING ROOM MARKET, BY APPLICATION, 2022-2032 ($BILLION)
- TABLE 43. FRANCE CONNECTED LIVING ROOM MARKET, BY COMPONENT, 2022-2032 ($BILLION)
- TABLE 44. UK CONNECTED LIVING ROOM MARKET, BY PRODUCT TYPE, 2022-2032 ($BILLION)
- TABLE 45. UK CONNECTED LIVING ROOM MARKET, BY APPLICATION, 2022-2032 ($BILLION)
- TABLE 46. UK CONNECTED LIVING ROOM MARKET, BY COMPONENT, 2022-2032 ($BILLION)
- TABLE 47. REST OF EUROPE CONNECTED LIVING ROOM MARKET, BY PRODUCT TYPE, 2022-2032 ($BILLION)
- TABLE 48. REST OF EUROPE CONNECTED LIVING ROOM MARKET, BY APPLICATION, 2022-2032 ($BILLION)
- TABLE 49. REST OF EUROPE CONNECTED LIVING ROOM MARKET, BY COMPONENT, 2022-2032 ($BILLION)
- TABLE 50. ASIA-PACIFIC CONNECTED LIVING ROOM MARKET, BY PRODUCT TYPE, 2022-2032 ($BILLION)
- TABLE 51. ASIA-PACIFIC CONNECTED LIVING ROOM MARKET, BY APPLICATION, 2022-2032 ($BILLION)
- TABLE 52. ASIA-PACIFIC CONNECTED LIVING ROOM MARKET, BY COMPONENT, 2022-2032 ($BILLION)
- TABLE 53. ASIA-PACIFIC CONNECTED LIVING ROOM MARKET, BY COUNTRY, 2022-2032 ($BILLION)
- TABLE 54. CHINA CONNECTED LIVING ROOM MARKET, BY PRODUCT TYPE, 2022-2032 ($BILLION)
- TABLE 55. CHINA CONNECTED LIVING ROOM MARKET, BY APPLICATION, 2022-2032 ($BILLION)
- TABLE 56. CHINA CONNECTED LIVING ROOM MARKET, BY COMPONENT, 2022-2032 ($BILLION)
- TABLE 57. JAPAN CONNECTED LIVING ROOM MARKET, BY PRODUCT TYPE, 2022-2032 ($BILLION)
- TABLE 58. JAPAN CONNECTED LIVING ROOM MARKET, BY APPLICATION, 2022-2032 ($BILLION)
- TABLE 59. JAPAN CONNECTED LIVING ROOM MARKET, BY COMPONENT, 2022-2032 ($BILLION)
- TABLE 60. INDIA CONNECTED LIVING ROOM MARKET, BY PRODUCT TYPE, 2022-2032 ($BILLION)
- TABLE 61. INDIA CONNECTED LIVING ROOM MARKET, BY APPLICATION, 2022-2032 ($BILLION)
- TABLE 62. INDIA CONNECTED LIVING ROOM MARKET, BY COMPONENT, 2022-2032 ($BILLION)
- TABLE 63. SOUTH KOREA CONNECTED LIVING ROOM MARKET, BY PRODUCT TYPE, 2022-2032 ($BILLION)
- TABLE 64. SOUTH KOREA CONNECTED LIVING ROOM MARKET, BY APPLICATION, 2022-2032 ($BILLION)
- TABLE 65. SOUTH KOREA CONNECTED LIVING ROOM MARKET, BY COMPONENT, 2022-2032 ($BILLION)
- TABLE 66. REST OF ASIA-PACIFIC CONNECTED LIVING ROOM MARKET, BY PRODUCT TYPE, 2022-2032 ($BILLION)
- TABLE 67. REST OF ASIA-PACIFIC CONNECTED LIVING ROOM MARKET, BY APPLICATION, 2022-2032 ($BILLION)
- TABLE 68. REST OF ASIA-PACIFIC CONNECTED LIVING ROOM MARKET, BY COMPONENT, 2022-2032 ($BILLION)
- TABLE 69. LAMEA CONNECTED LIVING ROOM MARKET, BY PRODUCT TYPE, 2022-2032 ($BILLION)
- TABLE 70. LAMEA CONNECTED LIVING ROOM MARKET, BY APPLICATION, 2022-2032 ($BILLION)
- TABLE 71. LAMEA CONNECTED LIVING ROOM MARKET, BY COMPONENT, 2022-2032 ($BILLION)
- TABLE 72. LAMEA CONNECTED LIVING ROOM MARKET, BY COUNTRY, 2022-2032 ($BILLION)
- TABLE 73. LATIN AMERICA CONNECTED LIVING ROOM MARKET, BY PRODUCT TYPE, 2022-2032 ($BILLION)
- TABLE 74. LATIN AMERICA CONNECTED LIVING ROOM MARKET, BY APPLICATION, 2022-2032 ($BILLION)
- TABLE 75. LATIN AMERICA CONNECTED LIVING ROOM MARKET, BY COMPONENT, 2022-2032 ($BILLION)
- TABLE 76. MIDDLE EAST CONNECTED LIVING ROOM MARKET, BY PRODUCT TYPE, 2022-2032 ($BILLION)
- TABLE 77. MIDDLE EAST CONNECTED LIVING ROOM MARKET, BY APPLICATION, 2022-2032 ($BILLION)
- TABLE 78. MIDDLE EAST CONNECTED LIVING ROOM MARKET, BY COMPONENT, 2022-2032 ($BILLION)
- TABLE 79. AFRICA CONNECTED LIVING ROOM MARKET, BY PRODUCT TYPE, 2022-2032 ($BILLION)
- TABLE 80. AFRICA CONNECTED LIVING ROOM MARKET, BY APPLICATION, 2022-2032 ($BILLION)
- TABLE 81. AFRICA CONNECTED LIVING ROOM MARKET, BY COMPONENT, 2022-2032 ($BILLION)
- TABLE 82. LG ELECTRONICS INC.: KEY EXECUTIVES
- TABLE 83. LG ELECTRONICS INC.: COMPANY SNAPSHOT
- TABLE 84. LG ELECTRONICS INC.: PRODUCT SEGMENTS
- TABLE 85. LG ELECTRONICS INC.: PRODUCT PORTFOLIO
- TABLE 86. ROKU, INC.: KEY EXECUTIVES
- TABLE 87. ROKU, INC.: COMPANY SNAPSHOT
- TABLE 88. ROKU, INC.: PRODUCT SEGMENTS
- TABLE 89. ROKU, INC.: SERVICE SEGMENTS
- TABLE 90. ROKU, INC.: PRODUCT PORTFOLIO
- TABLE 91. ROKU, INC.: KEY STRATERGIES
- TABLE 92. APPLE INC.: KEY EXECUTIVES
- TABLE 93. APPLE INC.: COMPANY SNAPSHOT
- TABLE 94. APPLE INC.: PRODUCT SEGMENTS
- TABLE 95. APPLE INC.: PRODUCT PORTFOLIO
- TABLE 96. APPLE INC.: KEY STRATERGIES
- TABLE 97. AMAZON.COM, INC.: KEY EXECUTIVES
- TABLE 98. AMAZON.COM, INC.: COMPANY SNAPSHOT
- TABLE 99. AMAZON.COM, INC.: SERVICE SEGMENTS
- TABLE 100. AMAZON.COM, INC.: PRODUCT PORTFOLIO
- TABLE 101. SAMSUNG ELECTRONICS CO., LTD.: KEY EXECUTIVES
- TABLE 102. SAMSUNG ELECTRONICS CO., LTD.: COMPANY SNAPSHOT
- TABLE 103. SAMSUNG ELECTRONICS CO., LTD.: PRODUCT SEGMENTS
- TABLE 104. SAMSUNG ELECTRONICS CO., LTD.: PRODUCT PORTFOLIO
- TABLE 105. HONEYWELL INTERNATIONAL INC.: KEY EXECUTIVES
- TABLE 106. HONEYWELL INTERNATIONAL INC.: COMPANY SNAPSHOT
- TABLE 107. HONEYWELL INTERNATIONAL INC.: PRODUCT SEGMENTS
- TABLE 108. HONEYWELL INTERNATIONAL INC.: PRODUCT PORTFOLIO
- TABLE 109. PANASONIC HOLDINGS CORPORATION: KEY EXECUTIVES
- TABLE 110. PANASONIC HOLDINGS CORPORATION: COMPANY SNAPSHOT
- TABLE 111. PANASONIC HOLDINGS CORPORATION: PRODUCT SEGMENTS
- TABLE 112. PANASONIC HOLDINGS CORPORATION: PRODUCT PORTFOLIO
- TABLE 113. PANASONIC HOLDINGS CORPORATION: KEY STRATERGIES
- TABLE 114. TOSHIBA CORPORATION: KEY EXECUTIVES
- TABLE 115. TOSHIBA CORPORATION: COMPANY SNAPSHOT
- TABLE 116. TOSHIBA CORPORATION: PRODUCT SEGMENTS
- TABLE 117. TOSHIBA CORPORATION: PRODUCT PORTFOLIO
- TABLE 118. SIGNIFY HOLDING: KEY EXECUTIVES
- TABLE 119. SIGNIFY HOLDING: COMPANY SNAPSHOT
- TABLE 120. SIGNIFY HOLDING: PRODUCT SEGMENTS
- TABLE 121. SIGNIFY HOLDING: PRODUCT PORTFOLIO
- TABLE 122. GOOGLE LLC: KEY EXECUTIVES
- TABLE 123. GOOGLE LLC: COMPANY SNAPSHOT
- TABLE 124. GOOGLE LLC: SERVICE SEGMENTS
- TABLE 125. GOOGLE LLC: PRODUCT PORTFOLIO
- TABLE 126. GOOGLE LLC: KEY STRATERGIES
LIST OF FIGURES
- FIGURE 01. CONNECTED LIVING ROOM MARKET, 2022-2032
- FIGURE 02. SEGMENTATION OF CONNECTED LIVING ROOM MARKET, 2022-2032
- FIGURE 03. TOP INVESTMENT POCKETS IN CONNECTED LIVING ROOM MARKET (2023-2032)
- FIGURE 04. MODERATE BARGAINING POWER OF SUPPLIERS
- FIGURE 05. MODERATE BARGAINING POWER OF BUYERS
- FIGURE 06. MODERATE THREAT OF SUBSTITUTES
- FIGURE 07. MODERATE TO HIGH THREAT OF NEW ENTRANTS
- FIGURE 08. LOW TO HIGH INTENSITY OF RIVALRY
- FIGURE 09. DRIVERS, RESTRAINTS AND OPPORTUNITIES: GLOBALCONNECTED LIVING ROOM MARKET
- FIGURE 10. CONNECTED LIVING ROOM MARKET, BY PRODUCT TYPE, 2022(%)
- FIGURE 11. COMPARATIVE SHARE ANALYSIS OF CONNECTED LIVING ROOM MARKET FOR SMART TVS, BY COUNTRY 2022 AND 2032(%)
- FIGURE 12. COMPARATIVE SHARE ANALYSIS OF CONNECTED LIVING ROOM MARKET FOR GAMING CONSOLES, BY COUNTRY 2022 AND 2032(%)
- FIGURE 13. COMPARATIVE SHARE ANALYSIS OF CONNECTED LIVING ROOM MARKET FOR COMPUTER AND LAPTOP, BY COUNTRY 2022 AND 2032(%)
- FIGURE 14. COMPARATIVE SHARE ANALYSIS OF CONNECTED LIVING ROOM MARKET FOR SMART SPEAKERS, BY COUNTRY 2022 AND 2032(%)
- FIGURE 15. COMPARATIVE SHARE ANALYSIS OF CONNECTED LIVING ROOM MARKET FOR SMARTPHONES AND TABLETS, BY COUNTRY 2022 AND 2032(%)
- FIGURE 16. COMPARATIVE SHARE ANALYSIS OF CONNECTED LIVING ROOM MARKET FOR SECURITY SYSTEM, BY COUNTRY 2022 AND 2032(%)
- FIGURE 17. COMPARATIVE SHARE ANALYSIS OF CONNECTED LIVING ROOM MARKET FOR LIGHTING SYSTEM, BY COUNTRY 2022 AND 2032(%)
- FIGURE 18. CONNECTED LIVING ROOM MARKET, BY APPLICATION, 2022(%)
- FIGURE 19. COMPARATIVE SHARE ANALYSIS OF CONNECTED LIVING ROOM MARKET FOR VIDEO STREAMING, BY COUNTRY 2022 AND 2032(%)
- FIGURE 20. COMPARATIVE SHARE ANALYSIS OF CONNECTED LIVING ROOM MARKET FOR AUDIO STREAMING, BY COUNTRY 2022 AND 2032(%)
- FIGURE 21. COMPARATIVE SHARE ANALYSIS OF CONNECTED LIVING ROOM MARKET FOR GAMING, BY COUNTRY 2022 AND 2032(%)
- FIGURE 22. COMPARATIVE SHARE ANALYSIS OF CONNECTED LIVING ROOM MARKET FOR SECURITY, BY COUNTRY 2022 AND 2032(%)
- FIGURE 23. CONNECTED LIVING ROOM MARKET, BY COMPONENT, 2022(%)
- FIGURE 24. COMPARATIVE SHARE ANALYSIS OF CONNECTED LIVING ROOM MARKET FOR SENSORS, BY COUNTRY 2022 AND 2032(%)
- FIGURE 25. COMPARATIVE SHARE ANALYSIS OF CONNECTED LIVING ROOM MARKET FOR THERMOSTATS, BY COUNTRY 2022 AND 2032(%)
- FIGURE 26. COMPARATIVE SHARE ANALYSIS OF CONNECTED LIVING ROOM MARKET FOR CAMERAS, BY COUNTRY 2022 AND 2032(%)
- FIGURE 27. COMPARATIVE SHARE ANALYSIS OF CONNECTED LIVING ROOM MARKET FOR COMMUNICATION DEVICE, BY COUNTRY 2022 AND 2032(%)
- FIGURE 28. COMPARATIVE SHARE ANALYSIS OF CONNECTED LIVING ROOM MARKET FOR OTHERS, BY COUNTRY 2022 AND 2032(%)
- FIGURE 29. CONNECTED LIVING ROOM MARKET BY REGION, 2022
- FIGURE 30. U.S. CONNECTED LIVING ROOM MARKET, 2022-2032 ($BILLION)
- FIGURE 31. CANADA CONNECTED LIVING ROOM MARKET, 2022-2032 ($BILLION)
- FIGURE 32. MEXICO CONNECTED LIVING ROOM MARKET, 2022-2032 ($BILLION)
- FIGURE 33. GERMANY CONNECTED LIVING ROOM MARKET, 2022-2032 ($BILLION)
- FIGURE 34. FRANCE CONNECTED LIVING ROOM MARKET, 2022-2032 ($BILLION)
- FIGURE 35. UK CONNECTED LIVING ROOM MARKET, 2022-2032 ($BILLION)
- FIGURE 36. REST OF EUROPE CONNECTED LIVING ROOM MARKET, 2022-2032 ($BILLION)
- FIGURE 37. CHINA CONNECTED LIVING ROOM MARKET, 2022-2032 ($BILLION)
- FIGURE 38. JAPAN CONNECTED LIVING ROOM MARKET, 2022-2032 ($BILLION)
- FIGURE 39. INDIA CONNECTED LIVING ROOM MARKET, 2022-2032 ($BILLION)
- FIGURE 40. SOUTH KOREA CONNECTED LIVING ROOM MARKET, 2022-2032 ($BILLION)
- FIGURE 41. REST OF ASIA-PACIFIC CONNECTED LIVING ROOM MARKET, 2022-2032 ($BILLION)
- FIGURE 42. LATIN AMERICA CONNECTED LIVING ROOM MARKET, 2022-2032 ($BILLION)
- FIGURE 43. MIDDLE EAST CONNECTED LIVING ROOM MARKET, 2022-2032 ($BILLION)
- FIGURE 44. AFRICA CONNECTED LIVING ROOM MARKET, 2022-2032 ($BILLION)
- FIGURE 45. TOP WINNING STRATEGIES, BY YEAR
- FIGURE 46. TOP WINNING STRATEGIES, BY DEVELOPMENT
- FIGURE 47. TOP WINNING STRATEGIES, BY COMPANY
- FIGURE 48. PRODUCT MAPPING OF TOP 10 PLAYERS
- FIGURE 49. COMPETITIVE DASHBOARD
- FIGURE 50. COMPETITIVE HEATMAP: CONNECTED LIVING ROOM MARKET
- FIGURE 51. TOP PLAYER POSITIONING, 2022
- FIGURE 52. LG ELECTRONICS INC.: NET SALES, 2020-2022 ($MILLION)
- FIGURE 53. LG ELECTRONICS INC.: RESEARCH & DEVELOPMENT EXPENDITURE, 2020-2022 ($MILLION)
- FIGURE 54. LG ELECTRONICS INC.: REVENUE SHARE BY SEGMENT, 2022 (%)
- FIGURE 55. ROKU, INC.: NET REVENUE, 2020-2022 ($MILLION)
- FIGURE 56. ROKU, INC.: RESEARCH & DEVELOPMENT EXPENDITURE, 2020-2022 ($MILLION)
- FIGURE 57. APPLE INC.: RESEARCH & DEVELOPMENT EXPENDITURE, 2020-2022 ($MILLION)
- FIGURE 58. APPLE INC.: NET REVENUE, 2020-2022 ($MILLION)
- FIGURE 59. APPLE INC.: REVENUE SHARE BY SEGMENT, 2022 (%)
- FIGURE 60. APPLE INC.: REVENUE SHARE BY REGION, 2022 (%)
- FIGURE 61. AMAZON.COM, INC.: NET SALES, 2020-2022 ($MILLION)
- FIGURE 62. AMAZON.COM, INC.: REVENUE SHARE BY SEGMENT, 2022 (%)
- FIGURE 63. AMAZON.COM, INC.: REVENUE SHARE BY REGION, 2022 (%)
- FIGURE 64. SAMSUNG ELECTRONICS CO. LTD.: NET REVENUE, 2020-2022 ($MILLION)
- FIGURE 65. SAMSUNG ELECTRONICS CO. LTD.: REVENUE SHARE BY SEGMENT, 2021 (%)
- FIGURE 66. SAMSUNG ELECTRONICS CO. LTD.: REVENUE SHARE BY REGION, 2022 (%)
- FIGURE 67. HONEYWELL INTERNATIONAL INC.: NET REVENUE, 2020-2022 ($MILLION)
- FIGURE 68. HONEYWELL INTERNATIONAL INC.: RESEARCH & DEVELOPMENT EXPENDITURE, 2020-2022 ($MILLION)
- FIGURE 69. HONEYWELL INTERNATIONAL INC.: REVENUE SHARE BY SEGMENT, 2022 (%)
- FIGURE 70. HONEYWELL INTERNATIONAL INC.: REVENUE SHARE BY REGION, 2022 (%)
- FIGURE 71. PANASONIC HOLDINGS CORPORATION: NET SALES, 2020-2022 ($MILLION)
- FIGURE 72. PANASONIC HOLDINGS CORPORATION: REVENUE SHARE BY SEGMENT, 2022 (%)
- FIGURE 73. PANASONIC HOLDINGS CORPORATION: REVENUE SHARE BY REGION, 2022 (%)
- FIGURE 74. TOSHIBA CORPORATION: NET SALES, 2020-2022 ($MILLION)
- FIGURE 75. TOSHIBA CORPORATION: REVENUE SHARE BY REGION, 2022 (%)
- FIGURE 76. TOSHIBA CORPORATION: REVENUE SHARE BY SEGMENT, 2021 (%)
- FIGURE 77. SIGNIFY HOLDING: NET REVENUE, 2020-2022 ($MILLION)
- FIGURE 78. SIGNIFY HOLDING: REVENUE SHARE BY REGION, 2022 (%)
- FIGURE 79. SIGNIFY HOLDING: REVENUE SHARE BY SEGMENT, 2022 (%)
- FIGURE 80. GOOGLE LLC: NET REVENUE, 2020-2022 ($MILLION)
- FIGURE 81. GOOGLE LLC: RESEARCH & DEVELOPMENT EXPENDITURE, 2020-2022 ($MILLION)
- FIGURE 82. GOOGLE LLC: REVENUE SHARE BY REGION, 2022 (%)
- FIGURE 83. GOOGLE LLC: REVENUE SHARE BY SEGMENT, 2022 (%)

