
PUBLISHER: Allied Market Research | PRODUCT CODE: 1344513

PUBLISHER: Allied Market Research | PRODUCT CODE: 1344513
Battery Swapping Market By Station Type, By Service Type, By Battery Capacity, By Vehicle Type: Global Opportunity Analysis and Industry Forecast, 2023-2032
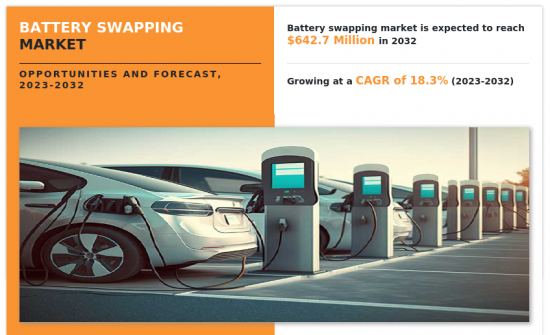
According to a new report published by Allied Market Research, titled, "Battery Swapping Market," The battery swapping market was valued at $120.3 million in 2022, and is estimated to reach $642.7 million by 2032, growing at a CAGR of 18.3% from 2023 to 2032.
Battery swapping is a process in which a drained electric vehicle battery is exchanged for a fully charged battery at a battery swapping station. These stations act as battery aggregators that provide the infrastructure where several batteries are kept in charging and charged batteries are made available to electric vehicle drivers. Customers or drivers may simply exchange the discharged batteries with batteries that are fully charged at these stations, and they do not have to wait a long time and may exchange batteries as often as they desire. Customers may subscribe to monthly or annual battery-swapping plans or may adopt a pay-per-use model as per their needs. Moreover, market players provide innovative solutions that utilize artificial intelligence, the Internet of Things (IoT), GPS tracking, and facial recognition to improve battery-swapping services and customer experience.
The battery-swapping market is influenced by several factors that contribute to the growth and adoption of battery-swapping as a viable charging solution for electric vehicles. One of the primary drivers is the increase in demand for electric vehicles worldwide. The need for efficient charging options becomes crucial as governments and consumers embrace clean and sustainable transportation. Battery swapping offers a convenient and time-saving alternative to traditional charging methods, reducing the concerns of range anxiety and long charging times.However, the market also faces certain restraints. Differentiation in battery technology and design poses challenges for standardization and compatibility in battery swapping stations. Moreover, high initial set-up and operating costs deter potential market entrants and hinder the expansion of the infrastructure network.
In addition, the lack of widespread public charging facilities and the absence of standardized charging infrastructure create an opportunity for battery swapping services to fill the gap. There are significant opportunities for the battery swapping market despite these challenges. The continuous technological advancements in battery technology, automation, and robotics present possibilities for more efficient and cost-effective battery-swapping systems. Collaborations between automakers, battery manufacturers, and infrastructure providers may drive standardization efforts and enhance interoperability. Moreover, the increase in focus on urban mobility and last-mile delivery services provides an opportunity for battery-swapping stations to cater to the specific needs of commercial electric vehicles.
The battery swapping market forecast is segmented on the basis of station type, service type, capacity type, vehicle type, and region. On the basis of station type, it is bifurcated into manual, and automatic. On the basis of service type, it is bifurcated into a subscription model and pay-per-use model. On the basis of capacity type, it is bifurcated into less than 30 kWh, and more than 30 kWh. On the basis of vehicle type, it is categorized into two-wheeler, three-wheeler, and four-wheeler. On the basis of region, it is analyzed across North America, Europe, Asia-Pacific, and LAMEA.
On the basis of region, Asia-Pacific dominates the market at present, followed by Europe, North America, and LAMEA. In Asia-Pacific, China dominated the global battery swapping market in 2022, whereas India is expected to grow at a significant rate during the forecast period.
Impact of Russia-Ukraine War on Global Battery Swapping Market
First, disruptions in the supply chain could lead to shortages or increased prices of batteries for swapping services. This is expected to affect the availability and cost of batteries in regions across the globe.
Secondly, if the conflict persists, companies are expected to consider shifting their battery production facilities away from the affected regions, potentially impacting the global supply of batteries.
Thirdly, market uncertainty caused by geopolitical tensions could influence investor sentiment, potentially affecting funding and expansion plans of battery swapping companies worldwide.
North America is expected to prioritize supporting local battery production. This could lead to the implementation of trade policies and incentives aimed at boosting domestic manufacturing and reducing dependence on foreign suppliers. Battery-swapping companies in North America are expected to benefit from increased government support and investment in the local industry, potentially driving growth and innovation in the market.
Europe is anticipated to focus on bolstering domestic battery production capabilities. The European Union has been actively promoting the development of a sustainable battery industry through initiatives such as the European Battery Alliance. The conflict could further emphasize the need for self-sufficiency in battery supply chains, leading to increased investments in European battery manufacturing.
Asia-Pacific is a major hub for battery production and electric vehicle manufacturing. Countries such as China, Japan, and South Korea have been actively investing in battery technologies and infrastructure while the conflict causes disruptions in the supply chain. These countries are anticipated to work towards securing alternative supply routes or diversifying their sources of raw materials. Battery swapping companies in the Asia-Pacific are expected to experience some short-term disruptions but could benefit from the overall focus on advancing battery technology in Asia-Pacific.
The LAMEA region is expected to face increased import challenges due to disruptions in supply chains caused by the conflict. Reliance on battery imports could result in delays and increased costs for battery swapping services in the region.
Competitive Landscape
Key players operating in the global battery swapping market are Gogoro, Aulton New Energy Automotive Technology Co., Ltd., Numocity, Esmito Solutions Pvt Ltd., NIO Power, BattSwap Future, Kwang Yang Motor Co., Ltd., Ample, Inc., Sun Mobility Private Limited, and Shenzhen Immotor Technology Co., Ltd.
Key Benefits For Stakeholders
- This report provides a quantitative analysis of the market segments, current trends, estimations, and dynamics of the battery swapping market analysis from 2022 to 2032 to identify the prevailing battery swapping market opportunities.
- The market research is offered along with information related to key drivers, restraints, and opportunities.
- Porter's five forces analysis highlights the potency of buyers and suppliers to enable stakeholders make profit-oriented business decisions and strengthen their supplier-buyer network.
- In-depth analysis of the battery swapping market segmentation assists to determine the prevailing market opportunities.
- Major countries in each region are mapped according to their revenue contribution to the global market.
- Market player positioning facilitates benchmarking and provides a clear understanding of the present position of the market players.
- The report includes the analysis of the regional as well as global battery swapping market trends, key players, market segments, application areas, and market growth strategies.
Key Market Segments
By Station Type
- Manual
- Automatic
By Service Type
- Subscription-based
- Pay-Per-Use
By Battery Capacity
- Less than 30kWh
- More than 30kWh
By Vehicle Type
- Two-Wheeler
- Three-Wheeler
- Four-Wheeler
By Region
- North America
- U.S.
- Canada
- Mexico
- Europe
- UK
- Netherlands
- Norway
- Germany
- France
- Rest of Europe
- Asia-Pacific
- China
- Japan
- India
- South Korea
- Rest of Asia-Pacific
- LAMEA
- Latin America
- Middle East
- Africa
Key Market Players:
- Ample, Inc.
- Aulton New Energy Automotive Technology Co., Ltd.
- BattSwap Future
- Esmito Solutions Pvt Ltd
- Gogoro
- KWANG YANG MOTOR CO., LTD.
- NIO
- Numocity
- Shenzhen Immotor Technology Limited
- Sun Mobility Private Limited
TABLE OF CONTENTS
CHAPTER 1: INTRODUCTION
- 1.1. Report description
- 1.2. Key market segments
- 1.3. Key benefits to the stakeholders
- 1.4. Research Methodology
- 1.4.1. Primary research
- 1.4.2. Secondary research
- 1.4.3. Analyst tools and models
CHAPTER 2: EXECUTIVE SUMMARY
- 2.1. CXO Perspective
CHAPTER 3: MARKET OVERVIEW
- 3.1. Market definition and scope
- 3.2. Key findings
- 3.2.1. Top impacting factors
- 3.2.2. Top investment pockets
- 3.3. Porter's five forces analysis
- 3.3.1. Low bargaining power of suppliers
- 3.3.2. Low threat of new entrants
- 3.3.3. Low threat of substitutes
- 3.3.4. Low intensity of rivalry
- 3.3.5. Low bargaining power of buyers
- 3.4. Market dynamics
- 3.4.1. Drivers
- 3.4.1.1. Increase in demand for electric vehicles coupled with a lack of adequate public charging facilities
- 3.4.1.2. Reduced time for electric vehicle charging
- 3.4.1. Drivers
- 3.4.2. Restraints
- 3.4.2.1. Differentiation in battery technology and design
- 3.4.2.2. High initial set-up and operating cost of battery swapping stations
- 3.4.3. Opportunities
- 3.4.3.1. Rapid emergence of shared e-mobility
- 3.4.3.2. Introduction of innovative & advanced battery swapping models and services
- 3.5. COVID-19 Impact Analysis on the market
- 3.6. Value Chain Analysis
- 3.7. Key Regulation Analysis
CHAPTER 4: BATTERY SWAPPING MARKET, BY STATION TYPE
- 4.1. Overview
- 4.1.1. Market size and forecast
- 4.2. Manual
- 4.2.1. Key market trends, growth factors and opportunities
- 4.2.2. Market size and forecast, by region
- 4.2.3. Market share analysis by country
- 4.3. Automatic
- 4.3.1. Key market trends, growth factors and opportunities
- 4.3.2. Market size and forecast, by region
- 4.3.3. Market share analysis by country
CHAPTER 5: BATTERY SWAPPING MARKET, BY SERVICE TYPE
- 5.1. Overview
- 5.1.1. Market size and forecast
- 5.2. Subscription-based
- 5.2.1. Key market trends, growth factors and opportunities
- 5.2.2. Market size and forecast, by region
- 5.2.3. Market share analysis by country
- 5.3. Pay-Per-Use
- 5.3.1. Key market trends, growth factors and opportunities
- 5.3.2. Market size and forecast, by region
- 5.3.3. Market share analysis by country
CHAPTER 6: BATTERY SWAPPING MARKET, BY BATTERY CAPACITY
- 6.1. Overview
- 6.1.1. Market size and forecast
- 6.2. Less than 30kWh
- 6.2.1. Key market trends, growth factors and opportunities
- 6.2.2. Market size and forecast, by region
- 6.2.3. Market share analysis by country
- 6.3. More than 30kWh
- 6.3.1. Key market trends, growth factors and opportunities
- 6.3.2. Market size and forecast, by region
- 6.3.3. Market share analysis by country
CHAPTER 7: BATTERY SWAPPING MARKET, BY VEHICLE TYPE
- 7.1. Overview
- 7.1.1. Market size and forecast
- 7.2. Two-Wheeler
- 7.2.1. Key market trends, growth factors and opportunities
- 7.2.2. Market size and forecast, by region
- 7.2.3. Market share analysis by country
- 7.3. Three-Wheeler
- 7.3.1. Key market trends, growth factors and opportunities
- 7.3.2. Market size and forecast, by region
- 7.3.3. Market share analysis by country
- 7.4. Four-Wheeler
- 7.4.1. Key market trends, growth factors and opportunities
- 7.4.2. Market size and forecast, by region
- 7.4.3. Market share analysis by country
CHAPTER 8: BATTERY SWAPPING MARKET, BY REGION
- 8.1. Overview
- 8.1.1. Market size and forecast By Region
- 8.2. North America
- 8.2.1. Key trends and opportunities
- 8.2.2. Market size and forecast, by Station Type
- 8.2.3. Market size and forecast, by Service Type
- 8.2.4. Market size and forecast, by Battery Capacity
- 8.2.5. Market size and forecast, by Vehicle Type
- 8.2.6. Market size and forecast, by country
- 8.2.6.1. U.S.
- 8.2.6.1.1. Key market trends, growth factors and opportunities
- 8.2.6.1.2. Market size and forecast, by Station Type
- 8.2.6.1.3. Market size and forecast, by Service Type
- 8.2.6.1.4. Market size and forecast, by Battery Capacity
- 8.2.6.1.5. Market size and forecast, by Vehicle Type
- 8.2.6.2. Canada
- 8.2.6.2.1. Key market trends, growth factors and opportunities
- 8.2.6.2.2. Market size and forecast, by Station Type
- 8.2.6.2.3. Market size and forecast, by Service Type
- 8.2.6.2.4. Market size and forecast, by Battery Capacity
- 8.2.6.2.5. Market size and forecast, by Vehicle Type
- 8.2.6.3. Mexico
- 8.2.6.3.1. Key market trends, growth factors and opportunities
- 8.2.6.3.2. Market size and forecast, by Station Type
- 8.2.6.3.3. Market size and forecast, by Service Type
- 8.2.6.3.4. Market size and forecast, by Battery Capacity
- 8.2.6.3.5. Market size and forecast, by Vehicle Type
- 8.3. Europe
- 8.3.1. Key trends and opportunities
- 8.3.2. Market size and forecast, by Station Type
- 8.3.3. Market size and forecast, by Service Type
- 8.3.4. Market size and forecast, by Battery Capacity
- 8.3.5. Market size and forecast, by Vehicle Type
- 8.3.6. Market size and forecast, by country
- 8.3.6.1. UK
- 8.3.6.1.1. Key market trends, growth factors and opportunities
- 8.3.6.1.2. Market size and forecast, by Station Type
- 8.3.6.1.3. Market size and forecast, by Service Type
- 8.3.6.1.4. Market size and forecast, by Battery Capacity
- 8.3.6.1.5. Market size and forecast, by Vehicle Type
- 8.3.6.2. Netherlands
- 8.3.6.2.1. Key market trends, growth factors and opportunities
- 8.3.6.2.2. Market size and forecast, by Station Type
- 8.3.6.2.3. Market size and forecast, by Service Type
- 8.3.6.2.4. Market size and forecast, by Battery Capacity
- 8.3.6.2.5. Market size and forecast, by Vehicle Type
- 8.3.6.3. Norway
- 8.3.6.3.1. Key market trends, growth factors and opportunities
- 8.3.6.3.2. Market size and forecast, by Station Type
- 8.3.6.3.3. Market size and forecast, by Service Type
- 8.3.6.3.4. Market size and forecast, by Battery Capacity
- 8.3.6.3.5. Market size and forecast, by Vehicle Type
- 8.3.6.4. Germany
- 8.3.6.4.1. Key market trends, growth factors and opportunities
- 8.3.6.4.2. Market size and forecast, by Station Type
- 8.3.6.4.3. Market size and forecast, by Service Type
- 8.3.6.4.4. Market size and forecast, by Battery Capacity
- 8.3.6.4.5. Market size and forecast, by Vehicle Type
- 8.3.6.5. France
- 8.3.6.5.1. Key market trends, growth factors and opportunities
- 8.3.6.5.2. Market size and forecast, by Station Type
- 8.3.6.5.3. Market size and forecast, by Service Type
- 8.3.6.5.4. Market size and forecast, by Battery Capacity
- 8.3.6.5.5. Market size and forecast, by Vehicle Type
- 8.3.6.6. Rest of Europe
- 8.3.6.6.1. Key market trends, growth factors and opportunities
- 8.3.6.6.2. Market size and forecast, by Station Type
- 8.3.6.6.3. Market size and forecast, by Service Type
- 8.3.6.6.4. Market size and forecast, by Battery Capacity
- 8.3.6.6.5. Market size and forecast, by Vehicle Type
- 8.4. Asia-Pacific
- 8.4.1. Key trends and opportunities
- 8.4.2. Market size and forecast, by Station Type
- 8.4.3. Market size and forecast, by Service Type
- 8.4.4. Market size and forecast, by Battery Capacity
- 8.4.5. Market size and forecast, by Vehicle Type
- 8.4.6. Market size and forecast, by country
- 8.4.6.1. China
- 8.4.6.1.1. Key market trends, growth factors and opportunities
- 8.4.6.1.2. Market size and forecast, by Station Type
- 8.4.6.1.3. Market size and forecast, by Service Type
- 8.4.6.1.4. Market size and forecast, by Battery Capacity
- 8.4.6.1.5. Market size and forecast, by Vehicle Type
- 8.4.6.2. Japan
- 8.4.6.2.1. Key market trends, growth factors and opportunities
- 8.4.6.2.2. Market size and forecast, by Station Type
- 8.4.6.2.3. Market size and forecast, by Service Type
- 8.4.6.2.4. Market size and forecast, by Battery Capacity
- 8.4.6.2.5. Market size and forecast, by Vehicle Type
- 8.4.6.3. India
- 8.4.6.3.1. Key market trends, growth factors and opportunities
- 8.4.6.3.2. Market size and forecast, by Station Type
- 8.4.6.3.3. Market size and forecast, by Service Type
- 8.4.6.3.4. Market size and forecast, by Battery Capacity
- 8.4.6.3.5. Market size and forecast, by Vehicle Type
- 8.4.6.4. South Korea
- 8.4.6.4.1. Key market trends, growth factors and opportunities
- 8.4.6.4.2. Market size and forecast, by Station Type
- 8.4.6.4.3. Market size and forecast, by Service Type
- 8.4.6.4.4. Market size and forecast, by Battery Capacity
- 8.4.6.4.5. Market size and forecast, by Vehicle Type
- 8.4.6.5. Rest of Asia-Pacific
- 8.4.6.5.1. Key market trends, growth factors and opportunities
- 8.4.6.5.2. Market size and forecast, by Station Type
- 8.4.6.5.3. Market size and forecast, by Service Type
- 8.4.6.5.4. Market size and forecast, by Battery Capacity
- 8.4.6.5.5. Market size and forecast, by Vehicle Type
- 8.5. LAMEA
- 8.5.1. Key trends and opportunities
- 8.5.2. Market size and forecast, by Station Type
- 8.5.3. Market size and forecast, by Service Type
- 8.5.4. Market size and forecast, by Battery Capacity
- 8.5.5. Market size and forecast, by Vehicle Type
- 8.5.6. Market size and forecast, by country
- 8.5.6.1. Latin America
- 8.5.6.1.1. Key market trends, growth factors and opportunities
- 8.5.6.1.2. Market size and forecast, by Station Type
- 8.5.6.1.3. Market size and forecast, by Service Type
- 8.5.6.1.4. Market size and forecast, by Battery Capacity
- 8.5.6.1.5. Market size and forecast, by Vehicle Type
- 8.5.6.2. Middle East
- 8.5.6.2.1. Key market trends, growth factors and opportunities
- 8.5.6.2.2. Market size and forecast, by Station Type
- 8.5.6.2.3. Market size and forecast, by Service Type
- 8.5.6.2.4. Market size and forecast, by Battery Capacity
- 8.5.6.2.5. Market size and forecast, by Vehicle Type
- 8.5.6.3. Africa
- 8.5.6.3.1. Key market trends, growth factors and opportunities
- 8.5.6.3.2. Market size and forecast, by Station Type
- 8.5.6.3.3. Market size and forecast, by Service Type
- 8.5.6.3.4. Market size and forecast, by Battery Capacity
- 8.5.6.3.5. Market size and forecast, by Vehicle Type
CHAPTER 9: COMPETITIVE LANDSCAPE
- 9.1. Introduction
- 9.2. Top winning strategies
- 9.3. Product Mapping of Top 10 Player
- 9.4. Competitive Dashboard
- 9.5. Competitive Heatmap
- 9.6. Top player positioning, 2022
CHAPTER 10: COMPANY PROFILES
- 10.1. NIO
- 10.1.1. Company overview
- 10.1.2. Key Executives
- 10.1.3. Company snapshot
- 10.1.4. Operating business segments
- 10.1.5. Product portfolio
- 10.1.6. Business performance
- 10.1.7. Key strategic moves and developments
- 10.2. Gogoro
- 10.2.1. Company overview
- 10.2.2. Key Executives
- 10.2.3. Company snapshot
- 10.2.4. Operating business segments
- 10.2.5. Product portfolio
- 10.2.6. Business performance
- 10.2.7. Key strategic moves and developments
- 10.3. Aulton New Energy Automotive Technology Co., Ltd.
- 10.3.1. Company overview
- 10.3.2. Key Executives
- 10.3.3. Company snapshot
- 10.3.4. Operating business segments
- 10.3.5. Product portfolio
- 10.4. Sun Mobility Private Limited
- 10.4.1. Company overview
- 10.4.2. Key Executives
- 10.4.3. Company snapshot
- 10.4.4. Operating business segments
- 10.4.5. Product portfolio
- 10.4.6. Key strategic moves and developments
- 10.5. Shenzhen Immotor Technology Limited
- 10.5.1. Company overview
- 10.5.2. Key Executives
- 10.5.3. Company snapshot
- 10.5.4. Operating business segments
- 10.5.5. Product portfolio
- 10.6. Ample, Inc.
- 10.6.1. Company overview
- 10.6.2. Key Executives
- 10.6.3. Company snapshot
- 10.6.4. Operating business segments
- 10.6.5. Product portfolio
- 10.6.6. Key strategic moves and developments
- 10.7. Numocity
- 10.7.1. Company overview
- 10.7.2. Key Executives
- 10.7.3. Company snapshot
- 10.7.4. Operating business segments
- 10.7.5. Product portfolio
- 10.8. BattSwap Future
- 10.8.1. Company overview
- 10.8.2. Key Executives
- 10.8.3. Company snapshot
- 10.8.4. Operating business segments
- 10.8.5. Product portfolio
- 10.9. Esmito Solutions Pvt Ltd
- 10.9.1. Company overview
- 10.9.2. Key Executives
- 10.9.3. Company snapshot
- 10.9.4. Operating business segments
- 10.9.5. Product portfolio
- 10.9.6. Key strategic moves and developments
- 10.10. KWANG YANG MOTOR CO., LTD.
- 10.10.1. Company overview
- 10.10.2. Key Executives
- 10.10.3. Company snapshot
- 10.10.4. Operating business segments
- 10.10.5. Product portfolio
- 10.10.6. Key strategic moves and developments
LIST OF TABLES
- TABLE 01. GLOBAL BATTERY SWAPPING MARKET, BY STATION TYPE, 2022-2032 ($MILLION)
- TABLE 02. BATTERY SWAPPING MARKET FOR MANUAL, BY REGION, 2022-2032 ($MILLION)
- TABLE 03. BATTERY SWAPPING MARKET FOR AUTOMATIC, BY REGION, 2022-2032 ($MILLION)
- TABLE 04. GLOBAL BATTERY SWAPPING MARKET, BY SERVICE TYPE, 2022-2032 ($MILLION)
- TABLE 05. BATTERY SWAPPING MARKET FOR SUBSCRIPTION-BASED, BY REGION, 2022-2032 ($MILLION)
- TABLE 06. BATTERY SWAPPING MARKET FOR PAY-PER-USE, BY REGION, 2022-2032 ($MILLION)
- TABLE 07. GLOBAL BATTERY SWAPPING MARKET, BY BATTERY CAPACITY, 2022-2032 ($MILLION)
- TABLE 08. BATTERY SWAPPING MARKET FOR LESS THAN 30KWH, BY REGION, 2022-2032 ($MILLION)
- TABLE 09. BATTERY SWAPPING MARKET FOR MORE THAN 30KWH, BY REGION, 2022-2032 ($MILLION)
- TABLE 10. GLOBAL BATTERY SWAPPING MARKET, BY VEHICLE TYPE, 2022-2032 ($MILLION)
- TABLE 11. BATTERY SWAPPING MARKET FOR TWO-WHEELER, BY REGION, 2022-2032 ($MILLION)
- TABLE 12. BATTERY SWAPPING MARKET FOR THREE-WHEELER, BY REGION, 2022-2032 ($MILLION)
- TABLE 13. BATTERY SWAPPING MARKET FOR FOUR-WHEELER, BY REGION, 2022-2032 ($MILLION)
- TABLE 14. BATTERY SWAPPING MARKET, BY REGION, 2022-2032 ($MILLION)
- TABLE 15. NORTH AMERICA BATTERY SWAPPING MARKET, BY STATION TYPE, 2022-2032 ($MILLION)
- TABLE 16. NORTH AMERICA BATTERY SWAPPING MARKET, BY SERVICE TYPE, 2022-2032 ($MILLION)
- TABLE 17. NORTH AMERICA BATTERY SWAPPING MARKET, BY BATTERY CAPACITY, 2022-2032 ($MILLION)
- TABLE 18. NORTH AMERICA BATTERY SWAPPING MARKET, BY VEHICLE TYPE, 2022-2032 ($MILLION)
- TABLE 19. NORTH AMERICA BATTERY SWAPPING MARKET, BY COUNTRY, 2022-2032 ($MILLION)
- TABLE 20. U.S. BATTERY SWAPPING MARKET, BY STATION TYPE, 2022-2032 ($MILLION)
- TABLE 21. U.S. BATTERY SWAPPING MARKET, BY SERVICE TYPE, 2022-2032 ($MILLION)
- TABLE 22. U.S. BATTERY SWAPPING MARKET, BY BATTERY CAPACITY, 2022-2032 ($MILLION)
- TABLE 23. U.S. BATTERY SWAPPING MARKET, BY VEHICLE TYPE, 2022-2032 ($MILLION)
- TABLE 24. CANADA BATTERY SWAPPING MARKET, BY STATION TYPE, 2022-2032 ($MILLION)
- TABLE 25. CANADA BATTERY SWAPPING MARKET, BY SERVICE TYPE, 2022-2032 ($MILLION)
- TABLE 26. CANADA BATTERY SWAPPING MARKET, BY BATTERY CAPACITY, 2022-2032 ($MILLION)
- TABLE 27. CANADA BATTERY SWAPPING MARKET, BY VEHICLE TYPE, 2022-2032 ($MILLION)
- TABLE 28. MEXICO BATTERY SWAPPING MARKET, BY STATION TYPE, 2022-2032 ($MILLION)
- TABLE 29. MEXICO BATTERY SWAPPING MARKET, BY SERVICE TYPE, 2022-2032 ($MILLION)
- TABLE 30. MEXICO BATTERY SWAPPING MARKET, BY BATTERY CAPACITY, 2022-2032 ($MILLION)
- TABLE 31. MEXICO BATTERY SWAPPING MARKET, BY VEHICLE TYPE, 2022-2032 ($MILLION)
- TABLE 32. EUROPE BATTERY SWAPPING MARKET, BY STATION TYPE, 2022-2032 ($MILLION)
- TABLE 33. EUROPE BATTERY SWAPPING MARKET, BY SERVICE TYPE, 2022-2032 ($MILLION)
- TABLE 34. EUROPE BATTERY SWAPPING MARKET, BY BATTERY CAPACITY, 2022-2032 ($MILLION)
- TABLE 35. EUROPE BATTERY SWAPPING MARKET, BY VEHICLE TYPE, 2022-2032 ($MILLION)
- TABLE 36. EUROPE BATTERY SWAPPING MARKET, BY COUNTRY, 2022-2032 ($MILLION)
- TABLE 37. UK BATTERY SWAPPING MARKET, BY STATION TYPE, 2022-2032 ($MILLION)
- TABLE 38. UK BATTERY SWAPPING MARKET, BY SERVICE TYPE, 2022-2032 ($MILLION)
- TABLE 39. UK BATTERY SWAPPING MARKET, BY BATTERY CAPACITY, 2022-2032 ($MILLION)
- TABLE 40. UK BATTERY SWAPPING MARKET, BY VEHICLE TYPE, 2022-2032 ($MILLION)
- TABLE 41. NETHERLANDS BATTERY SWAPPING MARKET, BY STATION TYPE, 2022-2032 ($MILLION)
- TABLE 42. NETHERLANDS BATTERY SWAPPING MARKET, BY SERVICE TYPE, 2022-2032 ($MILLION)
- TABLE 43. NETHERLANDS BATTERY SWAPPING MARKET, BY BATTERY CAPACITY, 2022-2032 ($MILLION)
- TABLE 44. NETHERLANDS BATTERY SWAPPING MARKET, BY VEHICLE TYPE, 2022-2032 ($MILLION)
- TABLE 45. NORWAY BATTERY SWAPPING MARKET, BY STATION TYPE, 2022-2032 ($MILLION)
- TABLE 46. NORWAY BATTERY SWAPPING MARKET, BY SERVICE TYPE, 2022-2032 ($MILLION)
- TABLE 47. NORWAY BATTERY SWAPPING MARKET, BY BATTERY CAPACITY, 2022-2032 ($MILLION)
- TABLE 48. NORWAY BATTERY SWAPPING MARKET, BY VEHICLE TYPE, 2022-2032 ($MILLION)
- TABLE 49. GERMANY BATTERY SWAPPING MARKET, BY STATION TYPE, 2022-2032 ($MILLION)
- TABLE 50. GERMANY BATTERY SWAPPING MARKET, BY SERVICE TYPE, 2022-2032 ($MILLION)
- TABLE 51. GERMANY BATTERY SWAPPING MARKET, BY BATTERY CAPACITY, 2022-2032 ($MILLION)
- TABLE 52. GERMANY BATTERY SWAPPING MARKET, BY VEHICLE TYPE, 2022-2032 ($MILLION)
- TABLE 53. FRANCE BATTERY SWAPPING MARKET, BY STATION TYPE, 2022-2032 ($MILLION)
- TABLE 54. FRANCE BATTERY SWAPPING MARKET, BY SERVICE TYPE, 2022-2032 ($MILLION)
- TABLE 55. FRANCE BATTERY SWAPPING MARKET, BY BATTERY CAPACITY, 2022-2032 ($MILLION)
- TABLE 56. FRANCE BATTERY SWAPPING MARKET, BY VEHICLE TYPE, 2022-2032 ($MILLION)
- TABLE 57. REST OF EUROPE BATTERY SWAPPING MARKET, BY STATION TYPE, 2022-2032 ($MILLION)
- TABLE 58. REST OF EUROPE BATTERY SWAPPING MARKET, BY SERVICE TYPE, 2022-2032 ($MILLION)
- TABLE 59. REST OF EUROPE BATTERY SWAPPING MARKET, BY BATTERY CAPACITY, 2022-2032 ($MILLION)
- TABLE 60. REST OF EUROPE BATTERY SWAPPING MARKET, BY VEHICLE TYPE, 2022-2032 ($MILLION)
- TABLE 61. ASIA-PACIFIC BATTERY SWAPPING MARKET, BY STATION TYPE, 2022-2032 ($MILLION)
- TABLE 62. ASIA-PACIFIC BATTERY SWAPPING MARKET, BY SERVICE TYPE, 2022-2032 ($MILLION)
- TABLE 63. ASIA-PACIFIC BATTERY SWAPPING MARKET, BY BATTERY CAPACITY, 2022-2032 ($MILLION)
- TABLE 64. ASIA-PACIFIC BATTERY SWAPPING MARKET, BY VEHICLE TYPE, 2022-2032 ($MILLION)
- TABLE 65. ASIA-PACIFIC BATTERY SWAPPING MARKET, BY COUNTRY, 2022-2032 ($MILLION)
- TABLE 66. CHINA BATTERY SWAPPING MARKET, BY STATION TYPE, 2022-2032 ($MILLION)
- TABLE 67. CHINA BATTERY SWAPPING MARKET, BY SERVICE TYPE, 2022-2032 ($MILLION)
- TABLE 68. CHINA BATTERY SWAPPING MARKET, BY BATTERY CAPACITY, 2022-2032 ($MILLION)
- TABLE 69. CHINA BATTERY SWAPPING MARKET, BY VEHICLE TYPE, 2022-2032 ($MILLION)
- TABLE 70. JAPAN BATTERY SWAPPING MARKET, BY STATION TYPE, 2022-2032 ($MILLION)
- TABLE 71. JAPAN BATTERY SWAPPING MARKET, BY SERVICE TYPE, 2022-2032 ($MILLION)
- TABLE 72. JAPAN BATTERY SWAPPING MARKET, BY BATTERY CAPACITY, 2022-2032 ($MILLION)
- TABLE 73. JAPAN BATTERY SWAPPING MARKET, BY VEHICLE TYPE, 2022-2032 ($MILLION)
- TABLE 74. INDIA BATTERY SWAPPING MARKET, BY STATION TYPE, 2022-2032 ($MILLION)
- TABLE 75. INDIA BATTERY SWAPPING MARKET, BY SERVICE TYPE, 2022-2032 ($MILLION)
- TABLE 76. INDIA BATTERY SWAPPING MARKET, BY BATTERY CAPACITY, 2022-2032 ($MILLION)
- TABLE 77. INDIA BATTERY SWAPPING MARKET, BY VEHICLE TYPE, 2022-2032 ($MILLION)
- TABLE 78. SOUTH KOREA BATTERY SWAPPING MARKET, BY STATION TYPE, 2022-2032 ($MILLION)
- TABLE 79. SOUTH KOREA BATTERY SWAPPING MARKET, BY SERVICE TYPE, 2022-2032 ($MILLION)
- TABLE 80. SOUTH KOREA BATTERY SWAPPING MARKET, BY BATTERY CAPACITY, 2022-2032 ($MILLION)
- TABLE 81. SOUTH KOREA BATTERY SWAPPING MARKET, BY VEHICLE TYPE, 2022-2032 ($MILLION)
- TABLE 82. REST OF ASIA-PACIFIC BATTERY SWAPPING MARKET, BY STATION TYPE, 2022-2032 ($MILLION)
- TABLE 83. REST OF ASIA-PACIFIC BATTERY SWAPPING MARKET, BY SERVICE TYPE, 2022-2032 ($MILLION)
- TABLE 84. REST OF ASIA-PACIFIC BATTERY SWAPPING MARKET, BY BATTERY CAPACITY, 2022-2032 ($MILLION)
- TABLE 85. REST OF ASIA-PACIFIC BATTERY SWAPPING MARKET, BY VEHICLE TYPE, 2022-2032 ($MILLION)
- TABLE 86. LAMEA BATTERY SWAPPING MARKET, BY STATION TYPE, 2022-2032 ($MILLION)
- TABLE 87. LAMEA BATTERY SWAPPING MARKET, BY SERVICE TYPE, 2022-2032 ($MILLION)
- TABLE 88. LAMEA BATTERY SWAPPING MARKET, BY BATTERY CAPACITY, 2022-2032 ($MILLION)
- TABLE 89. LAMEA BATTERY SWAPPING MARKET, BY VEHICLE TYPE, 2022-2032 ($MILLION)
- TABLE 90. LAMEA BATTERY SWAPPING MARKET, BY COUNTRY, 2022-2032 ($MILLION)
- TABLE 91. LATIN AMERICA BATTERY SWAPPING MARKET, BY STATION TYPE, 2022-2032 ($MILLION)
- TABLE 92. LATIN AMERICA BATTERY SWAPPING MARKET, BY SERVICE TYPE, 2022-2032 ($MILLION)
- TABLE 93. LATIN AMERICA BATTERY SWAPPING MARKET, BY BATTERY CAPACITY, 2022-2032 ($MILLION)
- TABLE 94. LATIN AMERICA BATTERY SWAPPING MARKET, BY VEHICLE TYPE, 2022-2032 ($MILLION)
- TABLE 95. MIDDLE EAST BATTERY SWAPPING MARKET, BY STATION TYPE, 2022-2032 ($MILLION)
- TABLE 96. MIDDLE EAST BATTERY SWAPPING MARKET, BY SERVICE TYPE, 2022-2032 ($MILLION)
- TABLE 97. MIDDLE EAST BATTERY SWAPPING MARKET, BY BATTERY CAPACITY, 2022-2032 ($MILLION)
- TABLE 98. MIDDLE EAST BATTERY SWAPPING MARKET, BY VEHICLE TYPE, 2022-2032 ($MILLION)
- TABLE 99. AFRICA BATTERY SWAPPING MARKET, BY STATION TYPE, 2022-2032 ($MILLION)
- TABLE 100. AFRICA BATTERY SWAPPING MARKET, BY SERVICE TYPE, 2022-2032 ($MILLION)
- TABLE 101. AFRICA BATTERY SWAPPING MARKET, BY BATTERY CAPACITY, 2022-2032 ($MILLION)
- TABLE 102. AFRICA BATTERY SWAPPING MARKET, BY VEHICLE TYPE, 2022-2032 ($MILLION)
- TABLE 103. NIO: KEY EXECUTIVES
- TABLE 104. NIO: COMPANY SNAPSHOT
- TABLE 105. NIO: PRODUCT SEGMENTS
- TABLE 106. NIO: PRODUCT PORTFOLIO
- TABLE 107. NIO: KEY STRATERGIES
- TABLE 108. GOGORO: KEY EXECUTIVES
- TABLE 109. GOGORO: COMPANY SNAPSHOT
- TABLE 110. GOGORO: PRODUCT SEGMENTS
- TABLE 111. GOGORO: SERVICE SEGMENTS
- TABLE 112. GOGORO: PRODUCT PORTFOLIO
- TABLE 113. GOGORO: KEY STRATERGIES
- TABLE 114. AULTON NEW ENERGY AUTOMOTIVE TECHNOLOGY CO., LTD.: KEY EXECUTIVES
- TABLE 115. AULTON NEW ENERGY AUTOMOTIVE TECHNOLOGY CO., LTD.: COMPANY SNAPSHOT
- TABLE 116. AULTON NEW ENERGY AUTOMOTIVE TECHNOLOGY CO., LTD.: PRODUCT SEGMENTS
- TABLE 117. AULTON NEW ENERGY AUTOMOTIVE TECHNOLOGY CO., LTD.: PRODUCT PORTFOLIO
- TABLE 118. SUN MOBILITY PRIVATE LIMITED: KEY EXECUTIVES
- TABLE 119. SUN MOBILITY PRIVATE LIMITED: COMPANY SNAPSHOT
- TABLE 120. SUN MOBILITY PRIVATE LIMITED: SERVICE SEGMENTS
- TABLE 121. SUN MOBILITY PRIVATE LIMITED: PRODUCT PORTFOLIO
- TABLE 122. SUN MOBILITY PRIVATE LIMITED: KEY STRATERGIES
- TABLE 123. SHENZHEN IMMOTOR TECHNOLOGY LIMITED: KEY EXECUTIVES
- TABLE 124. SHENZHEN IMMOTOR TECHNOLOGY LIMITED: COMPANY SNAPSHOT
- TABLE 125. SHENZHEN IMMOTOR TECHNOLOGY LIMITED: PRODUCT SEGMENTS
- TABLE 126. SHENZHEN IMMOTOR TECHNOLOGY LIMITED: PRODUCT PORTFOLIO
- TABLE 127. AMPLE, INC.: KEY EXECUTIVES
- TABLE 128. AMPLE, INC.: COMPANY SNAPSHOT
- TABLE 129. AMPLE, INC.: SERVICE SEGMENTS
- TABLE 130. AMPLE, INC.: PRODUCT PORTFOLIO
- TABLE 131. AMPLE, INC.: KEY STRATERGIES
- TABLE 132. NUMOCITY: KEY EXECUTIVES
- TABLE 133. NUMOCITY: COMPANY SNAPSHOT
- TABLE 134. NUMOCITY: SERVICE SEGMENTS
- TABLE 135. NUMOCITY: PRODUCT PORTFOLIO
- TABLE 136. BATTSWAP FUTURE: KEY EXECUTIVES
- TABLE 137. BATTSWAP FUTURE: COMPANY SNAPSHOT
- TABLE 138. BATTSWAP FUTURE: PRODUCT SEGMENTS
- TABLE 139. BATTSWAP FUTURE: PRODUCT PORTFOLIO
- TABLE 140. ESMITO SOLUTIONS PVT LTD: KEY EXECUTIVES
- TABLE 141. ESMITO SOLUTIONS PVT LTD: COMPANY SNAPSHOT
- TABLE 142. ESMITO SOLUTIONS PVT LTD: PRODUCT SEGMENTS
- TABLE 143. ESMITO SOLUTIONS PVT LTD: SERVICE SEGMENTS
- TABLE 144. ESMITO SOLUTIONS PVT LTD: PRODUCT PORTFOLIO
- TABLE 145. ESMITO SOLUTIONS PVT LTD: KEY STRATERGIES
- TABLE 146. KWANG YANG MOTOR CO., LTD.: KEY EXECUTIVES
- TABLE 147. KWANG YANG MOTOR CO., LTD.: COMPANY SNAPSHOT
- TABLE 148. KWANG YANG MOTOR CO., LTD.: SERVICE SEGMENTS
- TABLE 149. KWANG YANG MOTOR CO., LTD.: PRODUCT PORTFOLIO
- TABLE 150. KWANG YANG MOTOR CO., LTD.: KEY STRATERGIES
LIST OF FIGURES
- FIGURE 01. BATTERY SWAPPING MARKET, 2022-2032
- FIGURE 02. SEGMENTATION OF BATTERY SWAPPING MARKET, 2022-2032
- FIGURE 03. TOP INVESTMENT POCKETS IN BATTERY SWAPPING MARKET (2023-2032)
- FIGURE 04. LOW BARGAINING POWER OF SUPPLIERS
- FIGURE 05. LOW THREAT OF NEW ENTRANTS
- FIGURE 06. LOW THREAT OF SUBSTITUTES
- FIGURE 07. LOW INTENSITY OF RIVALRY
- FIGURE 08. LOW BARGAINING POWER OF BUYERS
- FIGURE 09. DRIVERS, RESTRAINTS AND OPPORTUNITIES: GLOBALBATTERY SWAPPING MARKET
- FIGURE 10. IMPACT OF KEY REGULATION: BATTERY SWAPPING MARKET
- FIGURE 10. BATTERY SWAPPING MARKET, BY STATION TYPE, 2022(%)
- FIGURE 11. COMPARATIVE SHARE ANALYSIS OF BATTERY SWAPPING MARKET FOR MANUAL, BY COUNTRY 2022 AND 2032(%)
- FIGURE 12. COMPARATIVE SHARE ANALYSIS OF BATTERY SWAPPING MARKET FOR AUTOMATIC, BY COUNTRY 2022 AND 2032(%)
- FIGURE 13. BATTERY SWAPPING MARKET, BY SERVICE TYPE, 2022(%)
- FIGURE 14. COMPARATIVE SHARE ANALYSIS OF BATTERY SWAPPING MARKET FOR SUBSCRIPTION-BASED, BY COUNTRY 2022 AND 2032(%)
- FIGURE 15. COMPARATIVE SHARE ANALYSIS OF BATTERY SWAPPING MARKET FOR PAY-PER-USE, BY COUNTRY 2022 AND 2032(%)
- FIGURE 16. BATTERY SWAPPING MARKET, BY BATTERY CAPACITY, 2022(%)
- FIGURE 17. COMPARATIVE SHARE ANALYSIS OF BATTERY SWAPPING MARKET FOR LESS THAN 30KWH, BY COUNTRY 2022 AND 2032(%)
- FIGURE 18. COMPARATIVE SHARE ANALYSIS OF BATTERY SWAPPING MARKET FOR MORE THAN 30KWH, BY COUNTRY 2022 AND 2032(%)
- FIGURE 19. BATTERY SWAPPING MARKET, BY VEHICLE TYPE, 2022(%)
- FIGURE 20. COMPARATIVE SHARE ANALYSIS OF BATTERY SWAPPING MARKET FOR TWO-WHEELER, BY COUNTRY 2022 AND 2032(%)
- FIGURE 21. COMPARATIVE SHARE ANALYSIS OF BATTERY SWAPPING MARKET FOR THREE-WHEELER, BY COUNTRY 2022 AND 2032(%)
- FIGURE 22. COMPARATIVE SHARE ANALYSIS OF BATTERY SWAPPING MARKET FOR FOUR-WHEELER, BY COUNTRY 2022 AND 2032(%)
- FIGURE 23. BATTERY SWAPPING MARKET BY REGION, 2022
- FIGURE 24. U.S. BATTERY SWAPPING MARKET, 2022-2032 ($MILLION)
- FIGURE 25. CANADA BATTERY SWAPPING MARKET, 2022-2032 ($MILLION)
- FIGURE 26. MEXICO BATTERY SWAPPING MARKET, 2022-2032 ($MILLION)
- FIGURE 27. UK BATTERY SWAPPING MARKET, 2022-2032 ($MILLION)
- FIGURE 28. NETHERLANDS BATTERY SWAPPING MARKET, 2022-2032 ($MILLION)
- FIGURE 29. NORWAY BATTERY SWAPPING MARKET, 2022-2032 ($MILLION)
- FIGURE 30. GERMANY BATTERY SWAPPING MARKET, 2022-2032 ($MILLION)
- FIGURE 31. FRANCE BATTERY SWAPPING MARKET, 2022-2032 ($MILLION)
- FIGURE 32. REST OF EUROPE BATTERY SWAPPING MARKET, 2022-2032 ($MILLION)
- FIGURE 33. CHINA BATTERY SWAPPING MARKET, 2022-2032 ($MILLION)
- FIGURE 34. JAPAN BATTERY SWAPPING MARKET, 2022-2032 ($MILLION)
- FIGURE 35. INDIA BATTERY SWAPPING MARKET, 2022-2032 ($MILLION)
- FIGURE 36. SOUTH KOREA BATTERY SWAPPING MARKET, 2022-2032 ($MILLION)
- FIGURE 37. REST OF ASIA-PACIFIC BATTERY SWAPPING MARKET, 2022-2032 ($MILLION)
- FIGURE 38. LATIN AMERICA BATTERY SWAPPING MARKET, 2022-2032 ($MILLION)
- FIGURE 39. MIDDLE EAST BATTERY SWAPPING MARKET, 2022-2032 ($MILLION)
- FIGURE 40. AFRICA BATTERY SWAPPING MARKET, 2022-2032 ($MILLION)
- FIGURE 41. TOP WINNING STRATEGIES, BY YEAR
- FIGURE 42. TOP WINNING STRATEGIES, BY DEVELOPMENT
- FIGURE 43. TOP WINNING STRATEGIES, BY COMPANY
- FIGURE 44. PRODUCT MAPPING OF TOP 10 PLAYERS
- FIGURE 45. COMPETITIVE DASHBOARD
- FIGURE 46. COMPETITIVE HEATMAP: BATTERY SWAPPING MARKET
- FIGURE 47. TOP PLAYER POSITIONING, 2022
- FIGURE 48. NIO: NET REVENUE, 2020-2022 ($MILLION)
- FIGURE 49. NIO: REVENUE SHARE BY SEGMENT, 2022 (%)
- FIGURE 50. GOGORO: NET SALES, 2020-2022 ($MILLION)
- FIGURE 51. GOGORO: RESEARCH & DEVELOPMENT EXPENDITURE, 2020-2022 ($MILLION)
- FIGURE 52. GOGORO: REVENUE SHARE BY SEGMENT, 2022 (%)
- FIGURE 53. GOGORO: REVENUE SHARE BY REGION, 2022 (%)

