
PUBLISHER: Allied Market Research | PRODUCT CODE: 1365574

PUBLISHER: Allied Market Research | PRODUCT CODE: 1365574
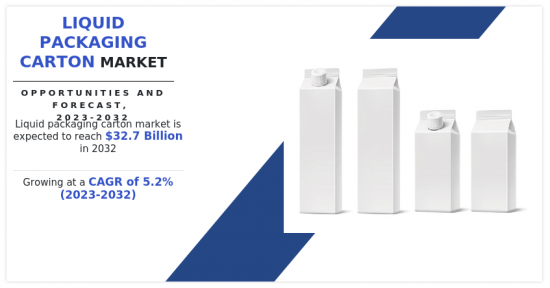
Liquid Packaging Carton Market By Carton Type, By Shelf Life, By End Use : Global Opportunity Analysis and Industry Forecast, 2023-2032
According to a new report published by Allied Market Research, titled, "Liquid Packaging Carton Market," The liquid packaging carton market was valued at $19.8 billion in 2022, and is estimated to reach $32.7 billion by 2032, growing at a CAGR of 5.2% from 2023 to 2032.
A liquid packaging carton is a type of container used to transport and store drinks like milk, fruit juices, and other beverages. It is made from layers of paperboard, polyethylene, and aluminum foil, all of which contribute to its strength, barrier qualities, and resistance to moisture, light, and air. Liquid packaging cartons are made to be aseptic, which means they can preserve the sterility of the liquid contents without refrigeration for a long time. These cartons are available in various volumes and designs, including slim, base, and gable top. They frequently have a plastic cap or spout that can be easily opened and closed and can be resealed.
The wide utilization of liquid packaging cartons for packaging of packed food and beverages drives the growth of the market. The quality, freshness, and flavor of the contents are preserved due to the superior protection that liquid packaging cartons offer against moisture, light, and air. Liquid packaging cartons are often designed for aseptic packaging, meaning the contents are sterilized and the cartons are filled and sealed in a sterile environment. This procedure eliminates the need for refrigeration and lowers the risk of deterioration by ensuring that the packaged foods and beverages remain free of bacteria and other microbes.
Liquid packaging cartons are less harmful to the environment compared to various other packaging materials. Efforts are being made to use more recycled materials in their production, however they are typically made from renewable resources, like paperboard made from trees. In addition, compared to other packaging solutions, they have a lower carbon impact and use less energy and water during manufacturing. Moreover, the cartons used for liquid packaging offer enough space to accommodate branding, product details, and attractive designs. The packaged food and beverages have more visual appeal and greater marketing potential due to the enormous printing surface area that producers can use to display their brand, product attributes, nutritional data, and promotional messaging. Owing to these factors, liquid packaging cartons provide convenience, product protection, sustainability, and marketing potential, making them a popular option for packed foods and beverages, thereby leading to the expansion of the market.
The market's expansion has been significantly fueled by technological developments in liquid packaging cartons. By introducing new features, enhancing functionality, and addressing requests from customers, these developments have expanded the uses for liquid packing cartons and raised their appeal. Better coatings and barrier materials were developed for liquid packaging cartons due to technological advances. These developments have improved the cartons' capacity to protect their contents from light, air, moisture, and outside odors, improving the shelf life of the packed foods and drinks. Liquid packing cartons are now suited for a larger range of products, including those that need higher degrees of protection, due to improved barrier qualities. Technological advancements have introduced various convenience features to liquid packaging cartons, making them more user-friendly and appealing to consumers. These characteristics include resealable spouts, simple-to-open caps, portion control choices, and ergonomic designs for ease handling and pouring. As a result of these developments, liquid packing cartons are now more convenient and useful, better suiting the changing lifestyles and preferences of consumers.
Liquid packing cartons have seen technological developments to raise their sustainability rating due to environmental concerns. The development of more environmentally friendly carton solutions, such as the use of renewable materials, enhanced recyclability, and decreased carbon footprint, is a result of developments in material science and production techniques. Consumers and businesses who care about the environment have responded favorably to these sustainability advances, which have sparked the acceptance of liquid packaging cartons as a more environmentally friendly packaging alternative. Owing to these factors, the market for liquid packaging cartons is expanding because of technological advancements in these products that have improved barrier properties, aseptic packaging innovations, convenience features, sustainability enhancements, and customization options.
Low-cost alternatives like polyethylene and polyethylene terephthalate (PET) are the key restriction preventing the liquid packaging carton market from expanding. For liquid packing, PET and PE materials are typically less expensive than cartons. Production expenses are decreased because they are made in massive quantities and are easily accessible. In addition, manufacturers find PET and PE to be appealing options due to their lower costs, particularly in price-sensitive markets or for products with narrower profit margins.
They can be utilized for many different forms of packaging, such as bottles, containers, and pouches to accommodate various liquid product shapes and sizes. Recycling these materials can reduce trash and their harmful impact on the environment by transforming them into new packaging or other products. Recyclability ideally matches the growing consumer desire for packaging options that are environmentally beneficial. All these factors cause the availability of alternatives to limit market expansion.
The use of eco-friendly and sustainable packaging cartons seems an excellent growth opportunity for the liquid packaging carton market. Paperboard, which is mostly made from trees, is used to make paper-based cartons. Compared to other forms of packaging like glass or plastic, they have a lesser carbon footprint. Cartons made of paper are lightweight, which lowers the cost of shipping and transportation. Their minimal form makes optimum use of available space during storage and transit, reducing waste and enhancing logistical effectiveness. Typically, layers of polyethylene and aluminum foil are applied to paper-based cartons to provide them with outstanding barrier qualities. This prolongs the shelf life of the packaged liquids by protecting the contents from atmospheric odors, moisture, light, and oxygen. These considerations created a fantastic opportunity for expansion as the demand for environmentally friendly and sustainable liquid packaging cartons increased.
The liquid packaging carton market is segmented based on carton type, shelf life, end use, and region. Depending on carton type, the market is categorized into brick liquid cartons, gable top cartons, and shaped liquid cartons. On the basis of shelf life, it is classified into long shelf-life cartons and short shelf-life cartons. By end use, it is classified into liquid dairy products, non-carbonated soft drinks, liquid foods, alcoholic drinks, and others. Region-wise, the liquid packaging carton market is analyzed across North America, Europe, Asia-Pacific, and LAMEA.
Some of the Major players analyzed in this report are: Adam Pack S.A., Atlas Packaging, Elopak, Greatview Aseptic Packaging, ITC Limited, Nippon Paper Industries Co., Ltd., Refresco Group, Stora Enso, Tetra Laval Group, and WestRock Company. These players have adopted various key strategies including expansion, acquisition, product launch, joint venture, and partnership to increase their market share.
Key Benefits For Stakeholders
- This report provides a quantitative analysis of the market segments, current trends, estimations, and dynamics of the liquid packaging carton market analysis from 2022 to 2032 to identify the prevailing liquid packaging carton market opportunities.
- The market research is offered along with information related to key drivers, restraints, and opportunities.
- Porter's five forces analysis highlights the potency of buyers and suppliers to enable stakeholders make profit-oriented business decisions and strengthen their supplier-buyer network.
- In-depth analysis of the liquid packaging carton market segmentation assists to determine the prevailing market opportunities.
- Major countries in each region are mapped according to their revenue contribution to the global market.
- Market player positioning facilitates benchmarking and provides a clear understanding of the present position of the market players.
- The report includes the analysis of the regional as well as global liquid packaging carton market trends, key players, market segments, application areas, and market growth strategies.
Additional benefits you will get with this purchase are:
- Quarterly Update and* (only available with a corporate license, on listed price)
- 5 additional Company Profile of client Choice pre- or Post-purchase, as a free update.
- Free Upcoming Version on the Purchase of Five and Enterprise User License.
- 16 analyst hours of support* (post-purchase, if you find additional data requirements upon review of the report, you may receive support amounting to 16 analyst hours to solve questions, and post-sale queries)
- 15% Free Customization* (in case the scope or segment of the report does not match your requirements, 20% is equivalent to 3 working days of free work, applicable once)
- Free data Pack on the Five and Enterprise User License. (Excel version of the report)
- Free Updated report if the report is 6-12 months old or older.
- 24-hour priority response*
- Free Industry updates and white papers.
Possible Customization with this report (with additional cost and timeline talk to the sales executive to know more)
- Consumer Buying Behavior Analysis
- Product Benchmarking / Product specification and applications
- Supply Chain Analysis & Vendor Margins
- Upcoming/New Entrant by Regions
- Market share analysis of players by products/segments
- New Product Development/ Product Matrix of Key Players
- Regulatory Guidelines
- Strategic Recommedations
- Additional company profiles with specific to client's interest
- Additional country or region analysis- market size and forecast
- Average Selling Price Analysis / Price Point Analysis
- Criss-cross segment analysis- market size and forecast
- Expanded list for Company Profiles
- Historic market data
- Key player details (including location, contact details, supplier/vendor network etc. in excel format)
- Market share analysis of players at global/region/country level
- Volume Market Size and Forecast
Key Market Segments
By Carton Type
- Brick Liquid Cartons
- Shaped Liquid Cartons
- Gable Top Cartons
By Shelf Life
- Long Shelf Life Cartons
- Short Shelf Life Cartons
By End Use
- Liquid Dairy Products
- Non-Carbonated Soft Drinks
- Liquid Foods
- Alcoholic Drinks
By Region
- North America
- U.S.
- Canada
- Mexico
- Europe
- Germany
- UK
- France
- Spain
- Italy
- Rest of Europe
- Asia-Pacific
- China
- India
- Japan
- South Korea
- Rest of Asia-Pacific
- LAMEA
- Brazil
- Saudi Arabia
- South Africa
- Rest of LAMEA
Key Market Players:
- NIPPON PAPER INDUSTRIES CO., LTD.
- Adam Pack S.A.
- Greatview Aseptic Packaging
- Tetra Laval Group
- ITC Limited
- Refresco Group
- Stora Enso
- Elopak
- Atlas Packaging
- WestRock Company
TABLE OF CONTENTS
CHAPTER 1: INTRODUCTION
- 1.1. Report description
- 1.2. Key market segments
- 1.3. Key benefits to the stakeholders
- 1.4. Research Methodology
- 1.4.1. Primary research
- 1.4.2. Secondary research
- 1.4.3. Analyst tools and models
CHAPTER 2: EXECUTIVE SUMMARY
- 2.1. CXO Perspective
CHAPTER 3: MARKET OVERVIEW
- 3.1. Market definition and scope
- 3.2. Key findings
- 3.2.1. Top impacting factors
- 3.2.2. Top investment pockets
- 3.3. Porter's five forces analysis
- 3.3.1. Low bargaining power of suppliers
- 3.3.2. Low threat of new entrants
- 3.3.3. Low threat of substitutes
- 3.3.4. Low intensity of rivalry
- 3.3.5. Low bargaining power of buyers
- 3.4. Market dynamics
- 3.4.1. Drivers
- 3.4.1.1. Rise in demand for packed food and beverages
- 3.4.1.2. Technological advancements in the liquid packaging cartons
- 3.4.1. Drivers
- 3.4.2. Restraints
- 3.4.2.1. Availability of substitutes
- 3.4.2.2. Surge in usage of glass packaging
- 3.4.3. Opportunities
- 3.4.3.1. Growth in demand for sustainable and eco-friendly packaging solutions
- 3.5. COVID-19 Impact Analysis on the market
- 3.6. Pricing Analysis
- 3.7. Patent Landscape
- 3.8. Regulatory Guidelines
CHAPTER 4: LIQUID PACKAGING CARTON MARKET, BY CARTON TYPE
- 4.1. Overview
- 4.1.1. Market size and forecast
- 4.2. Brick Liquid Cartons
- 4.2.1. Key market trends, growth factors and opportunities
- 4.2.2. Market size and forecast, by region
- 4.2.3. Market share analysis by country
- 4.3. Shaped Liquid Cartons
- 4.3.1. Key market trends, growth factors and opportunities
- 4.3.2. Market size and forecast, by region
- 4.3.3. Market share analysis by country
- 4.4. Gable Top Cartons
- 4.4.1. Key market trends, growth factors and opportunities
- 4.4.2. Market size and forecast, by region
- 4.4.3. Market share analysis by country
CHAPTER 5: LIQUID PACKAGING CARTON MARKET, BY SHELF LIFE
- 5.1. Overview
- 5.1.1. Market size and forecast
- 5.2. Long Shelf Life Cartons
- 5.2.1. Key market trends, growth factors and opportunities
- 5.2.2. Market size and forecast, by region
- 5.2.3. Market share analysis by country
- 5.3. Short Shelf Life Cartons
- 5.3.1. Key market trends, growth factors and opportunities
- 5.3.2. Market size and forecast, by region
- 5.3.3. Market share analysis by country
CHAPTER 6: LIQUID PACKAGING CARTON MARKET, BY END USE
- 6.1. Overview
- 6.1.1. Market size and forecast
- 6.2. Liquid Dairy Products
- 6.2.1. Key market trends, growth factors and opportunities
- 6.2.2. Market size and forecast, by region
- 6.2.3. Market share analysis by country
- 6.3. Non-Carbonated Soft Drinks
- 6.3.1. Key market trends, growth factors and opportunities
- 6.3.2. Market size and forecast, by region
- 6.3.3. Market share analysis by country
- 6.4. Liquid Foods
- 6.4.1. Key market trends, growth factors and opportunities
- 6.4.2. Market size and forecast, by region
- 6.4.3. Market share analysis by country
- 6.5. Alcoholic Drinks
- 6.5.1. Key market trends, growth factors and opportunities
- 6.5.2. Market size and forecast, by region
- 6.5.3. Market share analysis by country
CHAPTER 7: LIQUID PACKAGING CARTON MARKET, BY REGION
- 7.1. Overview
- 7.1.1. Market size and forecast By Region
- 7.2. North America
- 7.2.1. Key trends and opportunities
- 7.2.2. Market size and forecast, by Carton Type
- 7.2.3. Market size and forecast, by Shelf Life
- 7.2.4. Market size and forecast, by End Use
- 7.2.5. Market size and forecast, by country
- 7.2.5.1. U.S.
- 7.2.5.1.1. Key market trends, growth factors and opportunities
- 7.2.5.1.2. Market size and forecast, by Carton Type
- 7.2.5.1.3. Market size and forecast, by Shelf Life
- 7.2.5.1.4. Market size and forecast, by End Use
- 7.2.5.2. Canada
- 7.2.5.2.1. Key market trends, growth factors and opportunities
- 7.2.5.2.2. Market size and forecast, by Carton Type
- 7.2.5.2.3. Market size and forecast, by Shelf Life
- 7.2.5.2.4. Market size and forecast, by End Use
- 7.2.5.3. Mexico
- 7.2.5.3.1. Key market trends, growth factors and opportunities
- 7.2.5.3.2. Market size and forecast, by Carton Type
- 7.2.5.3.3. Market size and forecast, by Shelf Life
- 7.2.5.3.4. Market size and forecast, by End Use
- 7.3. Europe
- 7.3.1. Key trends and opportunities
- 7.3.2. Market size and forecast, by Carton Type
- 7.3.3. Market size and forecast, by Shelf Life
- 7.3.4. Market size and forecast, by End Use
- 7.3.5. Market size and forecast, by country
- 7.3.5.1. Germany
- 7.3.5.1.1. Key market trends, growth factors and opportunities
- 7.3.5.1.2. Market size and forecast, by Carton Type
- 7.3.5.1.3. Market size and forecast, by Shelf Life
- 7.3.5.1.4. Market size and forecast, by End Use
- 7.3.5.2. UK
- 7.3.5.2.1. Key market trends, growth factors and opportunities
- 7.3.5.2.2. Market size and forecast, by Carton Type
- 7.3.5.2.3. Market size and forecast, by Shelf Life
- 7.3.5.2.4. Market size and forecast, by End Use
- 7.3.5.3. France
- 7.3.5.3.1. Key market trends, growth factors and opportunities
- 7.3.5.3.2. Market size and forecast, by Carton Type
- 7.3.5.3.3. Market size and forecast, by Shelf Life
- 7.3.5.3.4. Market size and forecast, by End Use
- 7.3.5.4. Spain
- 7.3.5.4.1. Key market trends, growth factors and opportunities
- 7.3.5.4.2. Market size and forecast, by Carton Type
- 7.3.5.4.3. Market size and forecast, by Shelf Life
- 7.3.5.4.4. Market size and forecast, by End Use
- 7.3.5.5. Italy
- 7.3.5.5.1. Key market trends, growth factors and opportunities
- 7.3.5.5.2. Market size and forecast, by Carton Type
- 7.3.5.5.3. Market size and forecast, by Shelf Life
- 7.3.5.5.4. Market size and forecast, by End Use
- 7.3.5.6. Rest of Europe
- 7.3.5.6.1. Key market trends, growth factors and opportunities
- 7.3.5.6.2. Market size and forecast, by Carton Type
- 7.3.5.6.3. Market size and forecast, by Shelf Life
- 7.3.5.6.4. Market size and forecast, by End Use
- 7.4. Asia-Pacific
- 7.4.1. Key trends and opportunities
- 7.4.2. Market size and forecast, by Carton Type
- 7.4.3. Market size and forecast, by Shelf Life
- 7.4.4. Market size and forecast, by End Use
- 7.4.5. Market size and forecast, by country
- 7.4.5.1. China
- 7.4.5.1.1. Key market trends, growth factors and opportunities
- 7.4.5.1.2. Market size and forecast, by Carton Type
- 7.4.5.1.3. Market size and forecast, by Shelf Life
- 7.4.5.1.4. Market size and forecast, by End Use
- 7.4.5.2. India
- 7.4.5.2.1. Key market trends, growth factors and opportunities
- 7.4.5.2.2. Market size and forecast, by Carton Type
- 7.4.5.2.3. Market size and forecast, by Shelf Life
- 7.4.5.2.4. Market size and forecast, by End Use
- 7.4.5.3. Japan
- 7.4.5.3.1. Key market trends, growth factors and opportunities
- 7.4.5.3.2. Market size and forecast, by Carton Type
- 7.4.5.3.3. Market size and forecast, by Shelf Life
- 7.4.5.3.4. Market size and forecast, by End Use
- 7.4.5.4. South Korea
- 7.4.5.4.1. Key market trends, growth factors and opportunities
- 7.4.5.4.2. Market size and forecast, by Carton Type
- 7.4.5.4.3. Market size and forecast, by Shelf Life
- 7.4.5.4.4. Market size and forecast, by End Use
- 7.4.5.5. Rest of Asia-Pacific
- 7.4.5.5.1. Key market trends, growth factors and opportunities
- 7.4.5.5.2. Market size and forecast, by Carton Type
- 7.4.5.5.3. Market size and forecast, by Shelf Life
- 7.4.5.5.4. Market size and forecast, by End Use
- 7.5. LAMEA
- 7.5.1. Key trends and opportunities
- 7.5.2. Market size and forecast, by Carton Type
- 7.5.3. Market size and forecast, by Shelf Life
- 7.5.4. Market size and forecast, by End Use
- 7.5.5. Market size and forecast, by country
- 7.5.5.1. Brazil
- 7.5.5.1.1. Key market trends, growth factors and opportunities
- 7.5.5.1.2. Market size and forecast, by Carton Type
- 7.5.5.1.3. Market size and forecast, by Shelf Life
- 7.5.5.1.4. Market size and forecast, by End Use
- 7.5.5.2. Saudi Arabia
- 7.5.5.2.1. Key market trends, growth factors and opportunities
- 7.5.5.2.2. Market size and forecast, by Carton Type
- 7.5.5.2.3. Market size and forecast, by Shelf Life
- 7.5.5.2.4. Market size and forecast, by End Use
- 7.5.5.3. South Africa
- 7.5.5.3.1. Key market trends, growth factors and opportunities
- 7.5.5.3.2. Market size and forecast, by Carton Type
- 7.5.5.3.3. Market size and forecast, by Shelf Life
- 7.5.5.3.4. Market size and forecast, by End Use
- 7.5.5.4. Rest of LAMEA
- 7.5.5.4.1. Key market trends, growth factors and opportunities
- 7.5.5.4.2. Market size and forecast, by Carton Type
- 7.5.5.4.3. Market size and forecast, by Shelf Life
- 7.5.5.4.4. Market size and forecast, by End Use
CHAPTER 8: COMPETITIVE LANDSCAPE
- 8.1. Introduction
- 8.2. Top winning strategies
- 8.3. Product Mapping of Top 10 Player
- 8.4. Competitive Dashboard
- 8.5. Competitive Heatmap
- 8.6. Top player positioning, 2022
CHAPTER 9: COMPANY PROFILES
- 9.1. NIPPON PAPER INDUSTRIES CO., LTD.
- 9.1.1. Company overview
- 9.1.2. Key Executives
- 9.1.3. Company snapshot
- 9.1.4. Operating business segments
- 9.1.5. Product portfolio
- 9.1.6. Business performance
- 9.1.7. Key strategic moves and developments
- 9.2. Adam Pack S.A.
- 9.2.1. Company overview
- 9.2.2. Key Executives
- 9.2.3. Company snapshot
- 9.2.4. Operating business segments
- 9.2.5. Product portfolio
- 9.3. Tetra Laval Group
- 9.3.1. Company overview
- 9.3.2. Key Executives
- 9.3.3. Company snapshot
- 9.3.4. Operating business segments
- 9.3.5. Product portfolio
- 9.3.6. Business performance
- 9.3.7. Key strategic moves and developments
- 9.4. Greatview Aseptic Packaging
- 9.4.1. Company overview
- 9.4.2. Key Executives
- 9.4.3. Company snapshot
- 9.4.4. Operating business segments
- 9.4.5. Product portfolio
- 9.4.6. Business performance
- 9.4.7. Key strategic moves and developments
- 9.5. Elopak
- 9.5.1. Company overview
- 9.5.2. Key Executives
- 9.5.3. Company snapshot
- 9.5.4. Operating business segments
- 9.5.5. Product portfolio
- 9.5.6. Business performance
- 9.5.7. Key strategic moves and developments
- 9.6. WestRock Company
- 9.6.1. Company overview
- 9.6.2. Key Executives
- 9.6.3. Company snapshot
- 9.6.4. Operating business segments
- 9.6.5. Product portfolio
- 9.6.6. Business performance
- 9.7. Stora Enso
- 9.7.1. Company overview
- 9.7.2. Key Executives
- 9.7.3. Company snapshot
- 9.7.4. Operating business segments
- 9.7.5. Product portfolio
- 9.7.6. Business performance
- 9.7.7. Key strategic moves and developments
- 9.8. Atlas Packaging
- 9.8.1. Company overview
- 9.8.2. Key Executives
- 9.8.3. Company snapshot
- 9.8.4. Operating business segments
- 9.8.5. Product portfolio
- 9.9. ITC Limited
- 9.9.1. Company overview
- 9.9.2. Key Executives
- 9.9.3. Company snapshot
- 9.9.4. Operating business segments
- 9.9.5. Product portfolio
- 9.9.6. Business performance
- 9.10. Refresco Group
- 9.10.1. Company overview
- 9.10.2. Key Executives
- 9.10.3. Company snapshot
- 9.10.4. Operating business segments
- 9.10.5. Product portfolio
- 9.10.6. Key strategic moves and developments
LIST OF TABLES
- TABLE 01. GLOBAL LIQUID PACKAGING CARTON MARKET, BY CARTON TYPE, 2022-2032 ($MILLION)
- TABLE 02. GLOBAL LIQUID PACKAGING CARTON MARKET, BY CARTON TYPE, 2022-2032 (KILOTON)
- TABLE 03. LIQUID PACKAGING CARTON MARKET FOR BRICK LIQUID CARTONS, BY REGION, 2022-2032 ($MILLION)
- TABLE 04. LIQUID PACKAGING CARTON MARKET FOR BRICK LIQUID CARTONS, BY REGION, 2022-2032 (KILOTON)
- TABLE 05. LIQUID PACKAGING CARTON MARKET FOR SHAPED LIQUID CARTONS, BY REGION, 2022-2032 ($MILLION)
- TABLE 06. LIQUID PACKAGING CARTON MARKET FOR SHAPED LIQUID CARTONS, BY REGION, 2022-2032 (KILOTON)
- TABLE 07. LIQUID PACKAGING CARTON MARKET FOR GABLE TOP CARTONS, BY REGION, 2022-2032 ($MILLION)
- TABLE 08. LIQUID PACKAGING CARTON MARKET FOR GABLE TOP CARTONS, BY REGION, 2022-2032 (KILOTON)
- TABLE 09. GLOBAL LIQUID PACKAGING CARTON MARKET, BY SHELF LIFE, 2022-2032 ($MILLION)
- TABLE 10. GLOBAL LIQUID PACKAGING CARTON MARKET, BY SHELF LIFE, 2022-2032 (KILOTON)
- TABLE 11. LIQUID PACKAGING CARTON MARKET FOR LONG SHELF LIFE CARTONS, BY REGION, 2022-2032 ($MILLION)
- TABLE 12. LIQUID PACKAGING CARTON MARKET FOR LONG SHELF LIFE CARTONS, BY REGION, 2022-2032 (KILOTON)
- TABLE 13. LIQUID PACKAGING CARTON MARKET FOR SHORT SHELF LIFE CARTONS, BY REGION, 2022-2032 ($MILLION)
- TABLE 14. LIQUID PACKAGING CARTON MARKET FOR SHORT SHELF LIFE CARTONS, BY REGION, 2022-2032 (KILOTON)
- TABLE 15. GLOBAL LIQUID PACKAGING CARTON MARKET, BY END USE, 2022-2032 ($MILLION)
- TABLE 16. GLOBAL LIQUID PACKAGING CARTON MARKET, BY END USE, 2022-2032 (KILOTON)
- TABLE 17. LIQUID PACKAGING CARTON MARKET FOR LIQUID DAIRY PRODUCTS, BY REGION, 2022-2032 ($MILLION)
- TABLE 18. LIQUID PACKAGING CARTON MARKET FOR LIQUID DAIRY PRODUCTS, BY REGION, 2022-2032 (KILOTON)
- TABLE 19. LIQUID PACKAGING CARTON MARKET FOR NON-CARBONATED SOFT DRINKS, BY REGION, 2022-2032 ($MILLION)
- TABLE 20. LIQUID PACKAGING CARTON MARKET FOR NON-CARBONATED SOFT DRINKS, BY REGION, 2022-2032 (KILOTON)
- TABLE 21. LIQUID PACKAGING CARTON MARKET FOR LIQUID FOODS, BY REGION, 2022-2032 ($MILLION)
- TABLE 22. LIQUID PACKAGING CARTON MARKET FOR LIQUID FOODS, BY REGION, 2022-2032 (KILOTON)
- TABLE 23. LIQUID PACKAGING CARTON MARKET FOR ALCOHOLIC DRINKS, BY REGION, 2022-2032 ($MILLION)
- TABLE 24. LIQUID PACKAGING CARTON MARKET FOR ALCOHOLIC DRINKS, BY REGION, 2022-2032 (KILOTON)
- TABLE 25. LIQUID PACKAGING CARTON MARKET, BY REGION, 2022-2032 ($MILLION)
- TABLE 26. LIQUID PACKAGING CARTON MARKET, BY REGION, 2022-2032 (KILOTON)
- TABLE 27. NORTH AMERICA LIQUID PACKAGING CARTON MARKET, BY CARTON TYPE, 2022-2032 ($MILLION)
- TABLE 28. NORTH AMERICA LIQUID PACKAGING CARTON MARKET, BY CARTON TYPE, 2022-2032 (KILOTON)
- TABLE 29. NORTH AMERICA LIQUID PACKAGING CARTON MARKET, BY SHELF LIFE, 2022-2032 ($MILLION)
- TABLE 30. NORTH AMERICA LIQUID PACKAGING CARTON MARKET, BY SHELF LIFE, 2022-2032 (KILOTON)
- TABLE 31. NORTH AMERICA LIQUID PACKAGING CARTON MARKET, BY END USE, 2022-2032 ($MILLION)
- TABLE 32. NORTH AMERICA LIQUID PACKAGING CARTON MARKET, BY END USE, 2022-2032 (KILOTON)
- TABLE 33. NORTH AMERICA LIQUID PACKAGING CARTON MARKET, BY COUNTRY, 2022-2032 ($MILLION)
- TABLE 34. NORTH AMERICA LIQUID PACKAGING CARTON MARKET, BY COUNTRY, 2022-2032 (KILOTON)
- TABLE 35. U.S. LIQUID PACKAGING CARTON MARKET, BY CARTON TYPE, 2022-2032 ($MILLION)
- TABLE 36. U.S. LIQUID PACKAGING CARTON MARKET, BY CARTON TYPE, 2022-2032 (KILOTON)
- TABLE 37. U.S. LIQUID PACKAGING CARTON MARKET, BY SHELF LIFE, 2022-2032 ($MILLION)
- TABLE 38. U.S. LIQUID PACKAGING CARTON MARKET, BY SHELF LIFE, 2022-2032 (KILOTON)
- TABLE 39. U.S. LIQUID PACKAGING CARTON MARKET, BY END USE, 2022-2032 ($MILLION)
- TABLE 40. U.S. LIQUID PACKAGING CARTON MARKET, BY END USE, 2022-2032 (KILOTON)
- TABLE 41. CANADA LIQUID PACKAGING CARTON MARKET, BY CARTON TYPE, 2022-2032 ($MILLION)
- TABLE 42. CANADA LIQUID PACKAGING CARTON MARKET, BY CARTON TYPE, 2022-2032 (KILOTON)
- TABLE 43. CANADA LIQUID PACKAGING CARTON MARKET, BY SHELF LIFE, 2022-2032 ($MILLION)
- TABLE 44. CANADA LIQUID PACKAGING CARTON MARKET, BY SHELF LIFE, 2022-2032 (KILOTON)
- TABLE 45. CANADA LIQUID PACKAGING CARTON MARKET, BY END USE, 2022-2032 ($MILLION)
- TABLE 46. CANADA LIQUID PACKAGING CARTON MARKET, BY END USE, 2022-2032 (KILOTON)
- TABLE 47. MEXICO LIQUID PACKAGING CARTON MARKET, BY CARTON TYPE, 2022-2032 ($MILLION)
- TABLE 48. MEXICO LIQUID PACKAGING CARTON MARKET, BY CARTON TYPE, 2022-2032 (KILOTON)
- TABLE 49. MEXICO LIQUID PACKAGING CARTON MARKET, BY SHELF LIFE, 2022-2032 ($MILLION)
- TABLE 50. MEXICO LIQUID PACKAGING CARTON MARKET, BY SHELF LIFE, 2022-2032 (KILOTON)
- TABLE 51. MEXICO LIQUID PACKAGING CARTON MARKET, BY END USE, 2022-2032 ($MILLION)
- TABLE 52. MEXICO LIQUID PACKAGING CARTON MARKET, BY END USE, 2022-2032 (KILOTON)
- TABLE 53. EUROPE LIQUID PACKAGING CARTON MARKET, BY CARTON TYPE, 2022-2032 ($MILLION)
- TABLE 54. EUROPE LIQUID PACKAGING CARTON MARKET, BY CARTON TYPE, 2022-2032 (KILOTON)
- TABLE 55. EUROPE LIQUID PACKAGING CARTON MARKET, BY SHELF LIFE, 2022-2032 ($MILLION)
- TABLE 56. EUROPE LIQUID PACKAGING CARTON MARKET, BY SHELF LIFE, 2022-2032 (KILOTON)
- TABLE 57. EUROPE LIQUID PACKAGING CARTON MARKET, BY END USE, 2022-2032 ($MILLION)
- TABLE 58. EUROPE LIQUID PACKAGING CARTON MARKET, BY END USE, 2022-2032 (KILOTON)
- TABLE 59. EUROPE LIQUID PACKAGING CARTON MARKET, BY COUNTRY, 2022-2032 ($MILLION)
- TABLE 60. EUROPE LIQUID PACKAGING CARTON MARKET, BY COUNTRY, 2022-2032 (KILOTON)
- TABLE 61. GERMANY LIQUID PACKAGING CARTON MARKET, BY CARTON TYPE, 2022-2032 ($MILLION)
- TABLE 62. GERMANY LIQUID PACKAGING CARTON MARKET, BY CARTON TYPE, 2022-2032 (KILOTON)
- TABLE 63. GERMANY LIQUID PACKAGING CARTON MARKET, BY SHELF LIFE, 2022-2032 ($MILLION)
- TABLE 64. GERMANY LIQUID PACKAGING CARTON MARKET, BY SHELF LIFE, 2022-2032 (KILOTON)
- TABLE 65. GERMANY LIQUID PACKAGING CARTON MARKET, BY END USE, 2022-2032 ($MILLION)
- TABLE 66. GERMANY LIQUID PACKAGING CARTON MARKET, BY END USE, 2022-2032 (KILOTON)
- TABLE 67. UK LIQUID PACKAGING CARTON MARKET, BY CARTON TYPE, 2022-2032 ($MILLION)
- TABLE 68. UK LIQUID PACKAGING CARTON MARKET, BY CARTON TYPE, 2022-2032 (KILOTON)
- TABLE 69. UK LIQUID PACKAGING CARTON MARKET, BY SHELF LIFE, 2022-2032 ($MILLION)
- TABLE 70. UK LIQUID PACKAGING CARTON MARKET, BY SHELF LIFE, 2022-2032 (KILOTON)
- TABLE 71. UK LIQUID PACKAGING CARTON MARKET, BY END USE, 2022-2032 ($MILLION)
- TABLE 72. UK LIQUID PACKAGING CARTON MARKET, BY END USE, 2022-2032 (KILOTON)
- TABLE 73. FRANCE LIQUID PACKAGING CARTON MARKET, BY CARTON TYPE, 2022-2032 ($MILLION)
- TABLE 74. FRANCE LIQUID PACKAGING CARTON MARKET, BY CARTON TYPE, 2022-2032 (KILOTON)
- TABLE 75. FRANCE LIQUID PACKAGING CARTON MARKET, BY SHELF LIFE, 2022-2032 ($MILLION)
- TABLE 76. FRANCE LIQUID PACKAGING CARTON MARKET, BY SHELF LIFE, 2022-2032 (KILOTON)
- TABLE 77. FRANCE LIQUID PACKAGING CARTON MARKET, BY END USE, 2022-2032 ($MILLION)
- TABLE 78. FRANCE LIQUID PACKAGING CARTON MARKET, BY END USE, 2022-2032 (KILOTON)
- TABLE 79. SPAIN LIQUID PACKAGING CARTON MARKET, BY CARTON TYPE, 2022-2032 ($MILLION)
- TABLE 80. SPAIN LIQUID PACKAGING CARTON MARKET, BY CARTON TYPE, 2022-2032 (KILOTON)
- TABLE 81. SPAIN LIQUID PACKAGING CARTON MARKET, BY SHELF LIFE, 2022-2032 ($MILLION)
- TABLE 82. SPAIN LIQUID PACKAGING CARTON MARKET, BY SHELF LIFE, 2022-2032 (KILOTON)
- TABLE 83. SPAIN LIQUID PACKAGING CARTON MARKET, BY END USE, 2022-2032 ($MILLION)
- TABLE 84. SPAIN LIQUID PACKAGING CARTON MARKET, BY END USE, 2022-2032 (KILOTON)
- TABLE 85. ITALY LIQUID PACKAGING CARTON MARKET, BY CARTON TYPE, 2022-2032 ($MILLION)
- TABLE 86. ITALY LIQUID PACKAGING CARTON MARKET, BY CARTON TYPE, 2022-2032 (KILOTON)
- TABLE 87. ITALY LIQUID PACKAGING CARTON MARKET, BY SHELF LIFE, 2022-2032 ($MILLION)
- TABLE 88. ITALY LIQUID PACKAGING CARTON MARKET, BY SHELF LIFE, 2022-2032 (KILOTON)
- TABLE 89. ITALY LIQUID PACKAGING CARTON MARKET, BY END USE, 2022-2032 ($MILLION)
- TABLE 90. ITALY LIQUID PACKAGING CARTON MARKET, BY END USE, 2022-2032 (KILOTON)
- TABLE 91. REST OF EUROPE LIQUID PACKAGING CARTON MARKET, BY CARTON TYPE, 2022-2032 ($MILLION)
- TABLE 92. REST OF EUROPE LIQUID PACKAGING CARTON MARKET, BY CARTON TYPE, 2022-2032 (KILOTON)
- TABLE 93. REST OF EUROPE LIQUID PACKAGING CARTON MARKET, BY SHELF LIFE, 2022-2032 ($MILLION)
- TABLE 94. REST OF EUROPE LIQUID PACKAGING CARTON MARKET, BY SHELF LIFE, 2022-2032 (KILOTON)
- TABLE 95. REST OF EUROPE LIQUID PACKAGING CARTON MARKET, BY END USE, 2022-2032 ($MILLION)
- TABLE 96. REST OF EUROPE LIQUID PACKAGING CARTON MARKET, BY END USE, 2022-2032 (KILOTON)
- TABLE 97. ASIA-PACIFIC LIQUID PACKAGING CARTON MARKET, BY CARTON TYPE, 2022-2032 ($MILLION)
- TABLE 98. ASIA-PACIFIC LIQUID PACKAGING CARTON MARKET, BY CARTON TYPE, 2022-2032 (KILOTON)
- TABLE 99. ASIA-PACIFIC LIQUID PACKAGING CARTON MARKET, BY SHELF LIFE, 2022-2032 ($MILLION)
- TABLE 100. ASIA-PACIFIC LIQUID PACKAGING CARTON MARKET, BY SHELF LIFE, 2022-2032 (KILOTON)
- TABLE 101. ASIA-PACIFIC LIQUID PACKAGING CARTON MARKET, BY END USE, 2022-2032 ($MILLION)
- TABLE 102. ASIA-PACIFIC LIQUID PACKAGING CARTON MARKET, BY END USE, 2022-2032 (KILOTON)
- TABLE 103. ASIA-PACIFIC LIQUID PACKAGING CARTON MARKET, BY COUNTRY, 2022-2032 ($MILLION)
- TABLE 104. ASIA-PACIFIC LIQUID PACKAGING CARTON MARKET, BY COUNTRY, 2022-2032 (KILOTON)
- TABLE 105. CHINA LIQUID PACKAGING CARTON MARKET, BY CARTON TYPE, 2022-2032 ($MILLION)
- TABLE 106. CHINA LIQUID PACKAGING CARTON MARKET, BY CARTON TYPE, 2022-2032 (KILOTON)
- TABLE 107. CHINA LIQUID PACKAGING CARTON MARKET, BY SHELF LIFE, 2022-2032 ($MILLION)
- TABLE 108. CHINA LIQUID PACKAGING CARTON MARKET, BY SHELF LIFE, 2022-2032 (KILOTON)
- TABLE 109. CHINA LIQUID PACKAGING CARTON MARKET, BY END USE, 2022-2032 ($MILLION)
- TABLE 110. CHINA LIQUID PACKAGING CARTON MARKET, BY END USE, 2022-2032 (KILOTON)
- TABLE 111. INDIA LIQUID PACKAGING CARTON MARKET, BY CARTON TYPE, 2022-2032 ($MILLION)
- TABLE 112. INDIA LIQUID PACKAGING CARTON MARKET, BY CARTON TYPE, 2022-2032 (KILOTON)
- TABLE 113. INDIA LIQUID PACKAGING CARTON MARKET, BY SHELF LIFE, 2022-2032 ($MILLION)
- TABLE 114. INDIA LIQUID PACKAGING CARTON MARKET, BY SHELF LIFE, 2022-2032 (KILOTON)
- TABLE 115. INDIA LIQUID PACKAGING CARTON MARKET, BY END USE, 2022-2032 ($MILLION)
- TABLE 116. INDIA LIQUID PACKAGING CARTON MARKET, BY END USE, 2022-2032 (KILOTON)
- TABLE 117. JAPAN LIQUID PACKAGING CARTON MARKET, BY CARTON TYPE, 2022-2032 ($MILLION)
- TABLE 118. JAPAN LIQUID PACKAGING CARTON MARKET, BY CARTON TYPE, 2022-2032 (KILOTON)
- TABLE 119. JAPAN LIQUID PACKAGING CARTON MARKET, BY SHELF LIFE, 2022-2032 ($MILLION)
- TABLE 120. JAPAN LIQUID PACKAGING CARTON MARKET, BY SHELF LIFE, 2022-2032 (KILOTON)
- TABLE 121. JAPAN LIQUID PACKAGING CARTON MARKET, BY END USE, 2022-2032 ($MILLION)
- TABLE 122. JAPAN LIQUID PACKAGING CARTON MARKET, BY END USE, 2022-2032 (KILOTON)
- TABLE 123. SOUTH KOREA LIQUID PACKAGING CARTON MARKET, BY CARTON TYPE, 2022-2032 ($MILLION)
- TABLE 124. SOUTH KOREA LIQUID PACKAGING CARTON MARKET, BY CARTON TYPE, 2022-2032 (KILOTON)
- TABLE 125. SOUTH KOREA LIQUID PACKAGING CARTON MARKET, BY SHELF LIFE, 2022-2032 ($MILLION)
- TABLE 126. SOUTH KOREA LIQUID PACKAGING CARTON MARKET, BY SHELF LIFE, 2022-2032 (KILOTON)
- TABLE 127. SOUTH KOREA LIQUID PACKAGING CARTON MARKET, BY END USE, 2022-2032 ($MILLION)
- TABLE 128. SOUTH KOREA LIQUID PACKAGING CARTON MARKET, BY END USE, 2022-2032 (KILOTON)
- TABLE 129. REST OF ASIA-PACIFIC LIQUID PACKAGING CARTON MARKET, BY CARTON TYPE, 2022-2032 ($MILLION)
- TABLE 130. REST OF ASIA-PACIFIC LIQUID PACKAGING CARTON MARKET, BY CARTON TYPE, 2022-2032 (KILOTON)
- TABLE 131. REST OF ASIA-PACIFIC LIQUID PACKAGING CARTON MARKET, BY SHELF LIFE, 2022-2032 ($MILLION)
- TABLE 132. REST OF ASIA-PACIFIC LIQUID PACKAGING CARTON MARKET, BY SHELF LIFE, 2022-2032 (KILOTON)
- TABLE 133. REST OF ASIA-PACIFIC LIQUID PACKAGING CARTON MARKET, BY END USE, 2022-2032 ($MILLION)
- TABLE 134. REST OF ASIA-PACIFIC LIQUID PACKAGING CARTON MARKET, BY END USE, 2022-2032 (KILOTON)
- TABLE 135. LAMEA LIQUID PACKAGING CARTON MARKET, BY CARTON TYPE, 2022-2032 ($MILLION)
- TABLE 136. LAMEA LIQUID PACKAGING CARTON MARKET, BY CARTON TYPE, 2022-2032 (KILOTON)
- TABLE 137. LAMEA LIQUID PACKAGING CARTON MARKET, BY SHELF LIFE, 2022-2032 ($MILLION)
- TABLE 138. LAMEA LIQUID PACKAGING CARTON MARKET, BY SHELF LIFE, 2022-2032 (KILOTON)
- TABLE 139. LAMEA LIQUID PACKAGING CARTON MARKET, BY END USE, 2022-2032 ($MILLION)
- TABLE 140. LAMEA LIQUID PACKAGING CARTON MARKET, BY END USE, 2022-2032 (KILOTON)
- TABLE 141. LAMEA LIQUID PACKAGING CARTON MARKET, BY COUNTRY, 2022-2032 ($MILLION)
- TABLE 142. LAMEA LIQUID PACKAGING CARTON MARKET, BY COUNTRY, 2022-2032 (KILOTON)
- TABLE 143. BRAZIL LIQUID PACKAGING CARTON MARKET, BY CARTON TYPE, 2022-2032 ($MILLION)
- TABLE 144. BRAZIL LIQUID PACKAGING CARTON MARKET, BY CARTON TYPE, 2022-2032 (KILOTON)
- TABLE 145. BRAZIL LIQUID PACKAGING CARTON MARKET, BY SHELF LIFE, 2022-2032 ($MILLION)
- TABLE 146. BRAZIL LIQUID PACKAGING CARTON MARKET, BY SHELF LIFE, 2022-2032 (KILOTON)
- TABLE 147. BRAZIL LIQUID PACKAGING CARTON MARKET, BY END USE, 2022-2032 ($MILLION)
- TABLE 148. BRAZIL LIQUID PACKAGING CARTON MARKET, BY END USE, 2022-2032 (KILOTON)
- TABLE 149. SAUDI ARABIA LIQUID PACKAGING CARTON MARKET, BY CARTON TYPE, 2022-2032 ($MILLION)
- TABLE 150. SAUDI ARABIA LIQUID PACKAGING CARTON MARKET, BY CARTON TYPE, 2022-2032 (KILOTON)
- TABLE 151. SAUDI ARABIA LIQUID PACKAGING CARTON MARKET, BY SHELF LIFE, 2022-2032 ($MILLION)
- TABLE 152. SAUDI ARABIA LIQUID PACKAGING CARTON MARKET, BY SHELF LIFE, 2022-2032 (KILOTON)
- TABLE 153. SAUDI ARABIA LIQUID PACKAGING CARTON MARKET, BY END USE, 2022-2032 ($MILLION)
- TABLE 154. SAUDI ARABIA LIQUID PACKAGING CARTON MARKET, BY END USE, 2022-2032 (KILOTON)
- TABLE 155. SOUTH AFRICA LIQUID PACKAGING CARTON MARKET, BY CARTON TYPE, 2022-2032 ($MILLION)
- TABLE 156. SOUTH AFRICA LIQUID PACKAGING CARTON MARKET, BY CARTON TYPE, 2022-2032 (KILOTON)
- TABLE 157. SOUTH AFRICA LIQUID PACKAGING CARTON MARKET, BY SHELF LIFE, 2022-2032 ($MILLION)
- TABLE 158. SOUTH AFRICA LIQUID PACKAGING CARTON MARKET, BY SHELF LIFE, 2022-2032 (KILOTON)
- TABLE 159. SOUTH AFRICA LIQUID PACKAGING CARTON MARKET, BY END USE, 2022-2032 ($MILLION)
- TABLE 160. SOUTH AFRICA LIQUID PACKAGING CARTON MARKET, BY END USE, 2022-2032 (KILOTON)
- TABLE 161. REST OF LAMEA LIQUID PACKAGING CARTON MARKET, BY CARTON TYPE, 2022-2032 ($MILLION)
- TABLE 162. REST OF LAMEA LIQUID PACKAGING CARTON MARKET, BY CARTON TYPE, 2022-2032 (KILOTON)
- TABLE 163. REST OF LAMEA LIQUID PACKAGING CARTON MARKET, BY SHELF LIFE, 2022-2032 ($MILLION)
- TABLE 164. REST OF LAMEA LIQUID PACKAGING CARTON MARKET, BY SHELF LIFE, 2022-2032 (KILOTON)
- TABLE 165. REST OF LAMEA LIQUID PACKAGING CARTON MARKET, BY END USE, 2022-2032 ($MILLION)
- TABLE 166. REST OF LAMEA LIQUID PACKAGING CARTON MARKET, BY END USE, 2022-2032 (KILOTON)
- TABLE 167. NIPPON PAPER INDUSTRIES CO., LTD.: KEY EXECUTIVES
- TABLE 168. NIPPON PAPER INDUSTRIES CO., LTD.: COMPANY SNAPSHOT
- TABLE 169. NIPPON PAPER INDUSTRIES CO., LTD.: PRODUCT SEGMENTS
- TABLE 170. NIPPON PAPER INDUSTRIES CO., LTD.: PRODUCT PORTFOLIO
- TABLE 171. NIPPON PAPER INDUSTRIES CO., LTD.: KEY STRATERGIES
- TABLE 172. ADAM PACK S.A.: KEY EXECUTIVES
- TABLE 173. ADAM PACK S.A.: COMPANY SNAPSHOT
- TABLE 174. ADAM PACK S.A.: PRODUCT SEGMENTS
- TABLE 175. ADAM PACK S.A.: PRODUCT PORTFOLIO
- TABLE 176. TETRA LAVAL GROUP: KEY EXECUTIVES
- TABLE 177. TETRA LAVAL GROUP: COMPANY SNAPSHOT
- TABLE 178. TETRA LAVAL GROUP: PRODUCT SEGMENTS
- TABLE 179. TETRA LAVAL GROUP: PRODUCT PORTFOLIO
- TABLE 180. TETRA LAVAL GROUP: KEY STRATERGIES
- TABLE 181. GREATVIEW ASEPTIC PACKAGING: KEY EXECUTIVES
- TABLE 182. GREATVIEW ASEPTIC PACKAGING: COMPANY SNAPSHOT
- TABLE 183. GREATVIEW ASEPTIC PACKAGING: PRODUCT SEGMENTS
- TABLE 184. GREATVIEW ASEPTIC PACKAGING: PRODUCT PORTFOLIO
- TABLE 185. GREATVIEW ASEPTIC PACKAGING: KEY STRATERGIES
- TABLE 186. ELOPAK: KEY EXECUTIVES
- TABLE 187. ELOPAK: COMPANY SNAPSHOT
- TABLE 188. ELOPAK: PRODUCT SEGMENTS
- TABLE 189. ELOPAK: PRODUCT PORTFOLIO
- TABLE 190. ELOPAK: KEY STRATERGIES
- TABLE 191. WESTROCK COMPANY: KEY EXECUTIVES
- TABLE 192. WESTROCK COMPANY: COMPANY SNAPSHOT
- TABLE 193. WESTROCK COMPANY: PRODUCT SEGMENTS
- TABLE 194. WESTROCK COMPANY: PRODUCT PORTFOLIO
- TABLE 195. STORA ENSO: KEY EXECUTIVES
- TABLE 196. STORA ENSO: COMPANY SNAPSHOT
- TABLE 197. STORA ENSO: PRODUCT SEGMENTS
- TABLE 198. STORA ENSO: PRODUCT PORTFOLIO
- TABLE 199. STORA ENSO: KEY STRATERGIES
- TABLE 200. ATLAS PACKAGING: KEY EXECUTIVES
- TABLE 201. ATLAS PACKAGING: COMPANY SNAPSHOT
- TABLE 202. ATLAS PACKAGING: PRODUCT SEGMENTS
- TABLE 203. ATLAS PACKAGING: PRODUCT PORTFOLIO
- TABLE 204. ITC LIMITED: KEY EXECUTIVES
- TABLE 205. ITC LIMITED: COMPANY SNAPSHOT
- TABLE 206. ITC LIMITED: PRODUCT SEGMENTS
- TABLE 207. ITC LIMITED: PRODUCT PORTFOLIO
- TABLE 208. REFRESCO GROUP: KEY EXECUTIVES
- TABLE 209. REFRESCO GROUP: COMPANY SNAPSHOT
- TABLE 210. REFRESCO GROUP: PRODUCT SEGMENTS
- TABLE 211. REFRESCO GROUP: PRODUCT PORTFOLIO
- TABLE 212. REFRESCO GROUP: KEY STRATERGIES
LIST OF FIGURES
- FIGURE 01. LIQUID PACKAGING CARTON MARKET, 2022-2032
- FIGURE 02. SEGMENTATION OF LIQUID PACKAGING CARTON MARKET,2022-2032
- FIGURE 03. TOP INVESTMENT POCKETS IN LIQUID PACKAGING CARTON MARKET (2023-2032)
- FIGURE 04. LOW BARGAINING POWER OF SUPPLIERS
- FIGURE 05. LOW THREAT OF NEW ENTRANTS
- FIGURE 06. LOW THREAT OF SUBSTITUTES
- FIGURE 07. LOW INTENSITY OF RIVALRY
- FIGURE 08. LOW BARGAINING POWER OF BUYERS
- FIGURE 09. GLOBAL LIQUID PACKAGING CARTON MARKET:DRIVERS, RESTRAINTS AND OPPORTUNITIES
- FIGURE 10. PRICING ANALYSIS: LIQUID PACKAGING CARTON MARKET 2022 AND 2032
- FIGURE 11. PATENT ANALYSIS BY COMPANY
- FIGURE 12. PATENT ANALYSIS BY COUNTRY
- FIGURE 13. REGULATORY GUIDELINES: LIQUID PACKAGING CARTON MARKET
- FIGURE 14. LIQUID PACKAGING CARTON MARKET, BY CARTON TYPE, 2022(%)
- FIGURE 15. COMPARATIVE SHARE ANALYSIS OF LIQUID PACKAGING CARTON MARKET FOR BRICK LIQUID CARTONS, BY COUNTRY 2022 AND 2032(%)
- FIGURE 16. COMPARATIVE SHARE ANALYSIS OF LIQUID PACKAGING CARTON MARKET FOR SHAPED LIQUID CARTONS, BY COUNTRY 2022 AND 2032(%)
- FIGURE 17. COMPARATIVE SHARE ANALYSIS OF LIQUID PACKAGING CARTON MARKET FOR GABLE TOP CARTONS, BY COUNTRY 2022 AND 2032(%)
- FIGURE 18. LIQUID PACKAGING CARTON MARKET, BY SHELF LIFE, 2022(%)
- FIGURE 19. COMPARATIVE SHARE ANALYSIS OF LIQUID PACKAGING CARTON MARKET FOR LONG SHELF LIFE CARTONS, BY COUNTRY 2022 AND 2032(%)
- FIGURE 20. COMPARATIVE SHARE ANALYSIS OF LIQUID PACKAGING CARTON MARKET FOR SHORT SHELF LIFE CARTONS, BY COUNTRY 2022 AND 2032(%)
- FIGURE 21. LIQUID PACKAGING CARTON MARKET, BY END USE, 2022(%)
- FIGURE 22. COMPARATIVE SHARE ANALYSIS OF LIQUID PACKAGING CARTON MARKET FOR LIQUID DAIRY PRODUCTS, BY COUNTRY 2022 AND 2032(%)
- FIGURE 23. COMPARATIVE SHARE ANALYSIS OF LIQUID PACKAGING CARTON MARKET FOR NON-CARBONATED SOFT DRINKS, BY COUNTRY 2022 AND 2032(%)
- FIGURE 24. COMPARATIVE SHARE ANALYSIS OF LIQUID PACKAGING CARTON MARKET FOR LIQUID FOODS, BY COUNTRY 2022 AND 2032(%)
- FIGURE 25. COMPARATIVE SHARE ANALYSIS OF LIQUID PACKAGING CARTON MARKET FOR ALCOHOLIC DRINKS, BY COUNTRY 2022 AND 2032(%)
- FIGURE 26. LIQUID PACKAGING CARTON MARKET BY REGION, 2022(%)
- FIGURE 27. U.S. LIQUID PACKAGING CARTON MARKET, 2022-2032 ($MILLION)
- FIGURE 28. CANADA LIQUID PACKAGING CARTON MARKET, 2022-2032 ($MILLION)
- FIGURE 29. MEXICO LIQUID PACKAGING CARTON MARKET, 2022-2032 ($MILLION)
- FIGURE 30. GERMANY LIQUID PACKAGING CARTON MARKET, 2022-2032 ($MILLION)
- FIGURE 31. UK LIQUID PACKAGING CARTON MARKET, 2022-2032 ($MILLION)
- FIGURE 32. FRANCE LIQUID PACKAGING CARTON MARKET, 2022-2032 ($MILLION)
- FIGURE 33. SPAIN LIQUID PACKAGING CARTON MARKET, 2022-2032 ($MILLION)
- FIGURE 34. ITALY LIQUID PACKAGING CARTON MARKET, 2022-2032 ($MILLION)
- FIGURE 35. REST OF EUROPE LIQUID PACKAGING CARTON MARKET, 2022-2032 ($MILLION)
- FIGURE 36. CHINA LIQUID PACKAGING CARTON MARKET, 2022-2032 ($MILLION)
- FIGURE 37. INDIA LIQUID PACKAGING CARTON MARKET, 2022-2032 ($MILLION)
- FIGURE 38. JAPAN LIQUID PACKAGING CARTON MARKET, 2022-2032 ($MILLION)
- FIGURE 39. SOUTH KOREA LIQUID PACKAGING CARTON MARKET, 2022-2032 ($MILLION)
- FIGURE 40. REST OF ASIA-PACIFIC LIQUID PACKAGING CARTON MARKET, 2022-2032 ($MILLION)
- FIGURE 41. BRAZIL LIQUID PACKAGING CARTON MARKET, 2022-2032 ($MILLION)
- FIGURE 42. SAUDI ARABIA LIQUID PACKAGING CARTON MARKET, 2022-2032 ($MILLION)
- FIGURE 43. SOUTH AFRICA LIQUID PACKAGING CARTON MARKET, 2022-2032 ($MILLION)
- FIGURE 44. REST OF LAMEA LIQUID PACKAGING CARTON MARKET, 2022-2032 ($MILLION)
- FIGURE 45. TOP WINNING STRATEGIES, BY YEAR
- FIGURE 46. TOP WINNING STRATEGIES, BY DEVELOPMENT
- FIGURE 47. TOP WINNING STRATEGIES, BY COMPANY
- FIGURE 48. PRODUCT MAPPING OF TOP 10 PLAYERS
- FIGURE 49. COMPETITIVE DASHBOARD
- FIGURE 50. COMPETITIVE HEATMAP: LIQUID PACKAGING CARTON MARKET
- FIGURE 51. TOP PLAYER POSITIONING, 2022
- FIGURE 52. NIPPON PAPER INDUSTRIES CO., LTD.: NET SALES, 2020-2022 ($MILLION)
- FIGURE 53. NIPPON PAPER INDUSTRIES CO., LTD.: REVENUE SHARE BY SEGMENT, 2022 (%)
- FIGURE 54. NIPPON PAPER INDUSTRIES CO., LTD.: REVENUE SHARE BY REGION, 2022 (%)
- FIGURE 55. TETRA LAVAL GROUP: NET SALES, 2020-2022 ($MILLION)
- FIGURE 56. TETRA LAVAL GROUP: REVENUE SHARE BY SEGMENT, 2022 (%)
- FIGURE 57. GREATVIEW ASEPTIC PACKAGING: NET REVENUE, 2020-2022 ($MILLION)
- FIGURE 58. GREATVIEW ASEPTIC PACKAGING: REVENUE SHARE BY SEGMENT, 2022 (%)
- FIGURE 59. ELOPAK: NET REVENUE, 2020-2022 ($MILLION)
- FIGURE 60. ELOPAK: RESEARCH & DEVELOPMENT EXPENDITURE, 2020-2022 ($MILLION)
- FIGURE 61. ELOPAK: REVENUE SHARE BY SEGMENT, 2022 (%)
- FIGURE 62. ELOPAK: REVENUE SHARE BY REGION, 2022 (%)
- FIGURE 63. WESTROCK COMPANY: NET SALES, 2020-2022 ($MILLION)
- FIGURE 64. WESTROCK COMPANY: REVENUE SHARE BY SEGMENT, 2022 (%)
- FIGURE 65. WESTROCK COMPANY: REVENUE SHARE BY REGION, 2022 (%)
- FIGURE 66. STORA ENSO: NET SALES, 2020-2022 ($MILLION)
- FIGURE 67. STORA ENSO: RESEARCH & DEVELOPMENT EXPENDITURE, 2020-2022 ($MILLION)
- FIGURE 68. STORA ENSO: REVENUE SHARE BY SEGMENT, 2022 (%)
- FIGURE 69. STORA ENSO: REVENUE SHARE BY REGION, 2022 (%)
- FIGURE 70. ITC LIMITED: NET REVENUE, 2020-2022 ($MILLION)
- FIGURE 71. ITC LIMITED: REVENUE SHARE BY SEGMENT, 2022 (%)
- FIGURE 72. ITC LIMITED: REVENUE SHARE BY REGION, 2022 (%)

