
PUBLISHER: Allied Market Research | PRODUCT CODE: 1365614

PUBLISHER: Allied Market Research | PRODUCT CODE: 1365614
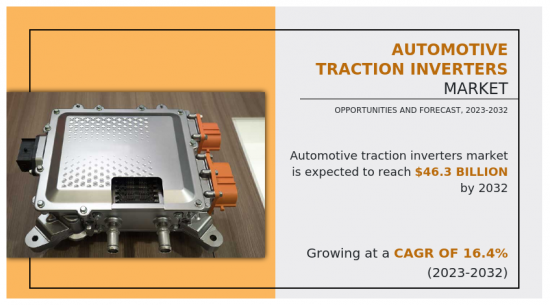
Automotive Traction Inverters Market By Propulsion type, By Output power, By Semiconductor material (Gallium Nitride, Silicon, Silicon Nitride ), By Technology type, By Vehicle type : Global Opportunity Analysis and Industry Forecast, 2023-2032
"The Automotive Traction Inverters Market is expected to experience a significant growth rate of 16.4% from 2023 to 2032 owing to rise in adoption of electrical vehicles"- Allied Market Research.
The precise control and modulation of inverters significantly contribute to seamless and rapid acceleration, regenerative braking, and overall vehicle efficiency. Traction inverter's primary function is to convert the direct current (DC) power obtained from batteries into alternating current (AC) power required for powering electric motors used for propulsion and other purposes. By enabling precise control over motor speed and torque, traction inverters enhance the efficiency and maneuverability of the vehicles.
Moreover, surge in adoption of Evs drives the growth of automotive traction inverters market. In addition, key players operating in the electric vehicle power inverter market are adopting various strategic moves such as partnership to tap the business potential. For instance, July 2022, Renault Group and Vitesco Technologies formed a strategic partnership to collaboratively develop and produce power electronics for electric and hybrid powertrains. The focus of this partnership is to create a "One Box" solution, which integrates multiple components into a single housing. This includes the DC-DC converter, the on-board charger (OBC), and the inverter. By combining these elements into a compact electronic unit, the aim is to enhance efficiency and simplify the integration of power electronics in electric and hybrid vehicles of Renault.
Moreover, the electric vehicles market has grown exponentially due to factors, such as climate change and efforts to achieve net zero emissions. In addition, favorable incentives and policies introduced by governments of different countries to promote electric vehicles boost the growth of the EV industry. For instance, in 2021, in California, the Clean Vehicle Rebate Project (CVRP) promoted clean vehicle adoption in California by offering rebates ranging from $1,000 to $7,000 for purchases or leases of new zero-emission vehicle. Moreover, in 2021, New Zealand proposed clean car discount, in which new car buyers received $8,625 rebate for electric vehicles (Evs) less than $80,000, including GST and road costs.
Furthermore, automotive companies and semiconductor manufacturers collaborated to develop efficient traction inverters. For instance, in February 2023, SEMIKRON, a semiconductor company awarded a billion-dollar contract by a major German car manufacturer for their advance eMPack power module platform. Specifically designed for silicon carbide technology, this platform expected to be utilized in upcoming generation EV inverters of the car. Hence, surge in demand for fuel-efficient vehicles and collaborations between automotive and semiconductor companies drive the growth of the passenger vehicle segment of automotive traction inverters market.
In addition, The adoption of 800V traction inverters offers several advantages. First and foremost, they enable faster charging capabilities, allowing electric vehicles to charge at higher power levels, reducing overall charging time. This addresses one of the key concerns for electric vehicle owners and helps improve the overall convenience and usability of electric vehicles. In addition, 800V traction inverters may enhance the operational efficiency of electric vehicles. Higher voltage systems help reduce energy losses during power conversion, resulting in improved overall system efficiency. This leads to increased driving range, as more energy from the battery pack may be effectively utilized for propulsion, maximizing the vehicle efficiency.
The automotive traction inverters market is segmented into propulsion type, output power, semiconductor material, technology type, vehicle type and region. On the basis of propulsion type, it is segregated into BEV, HEV, and PHEV. On the basis of output power, it is fragmented into less than or equal to 130 KW, more than 130 KW. On the basis of semiconductor material, the market is categorized into gallium nitride (GaN), silicon (Si), and silicon nitride (SiC). On the basis of technology type, it is fragmented into IGBT, and MOSFET. On the basis of vehicle type, it is fragmented into passenger vehicles, light commercial vehicles, and heavy commercial vehicles. On the basis of region, the market is analyzed across North America, Europe, Asia-Pacific, and LAMEA.
Key players profiled in the report include BorgWarner Inc., Denso Corporation, Eaton Corporation, Hitachi, Ltd., Mitsubishi Electric Corporation, Robert Bosch GmbH, Curtiss-Wright Corporation, TDK Electronics, Valeo SA, and Vitesco Technologies Group Aktiengesellschaft.
Key Benefits For Stakeholders
- This report provides a quantitative analysis of the market segments, current trends, estimations, and dynamics of the automotive traction inverters market analysis from 2022 to 2032 to identify the prevailing automotive traction inverters market opportunities.
- The market research is offered along with information related to key drivers, restraints, and opportunities.
- Porter's five forces analysis highlights the potency of buyers and suppliers to enable stakeholders make profit-oriented business decisions and strengthen their supplier-buyer network.
- In-depth analysis of the automotive traction inverters market segmentation assists to determine the prevailing market opportunities.
- Major countries in each region are mapped according to their revenue contribution to the global market.
- Market player positioning facilitates benchmarking and provides a clear understanding of the present position of the market players.
- The report includes the analysis of the regional as well as global automotive traction inverters market trends, key players, market segments, application areas, and market growth strategies.
Additional benefits you will get with this purchase are:
- Quarterly Update and* (only available with a corporate license, on listed price)
- 5 additional Company Profile of client Choice pre- or Post-purchase, as a free update.
- Free Upcoming Version on the Purchase of Five and Enterprise User License.
- 16 analyst hours of support* (post-purchase, if you find additional data requirements upon review of the report, you may receive support amounting to 16 analyst hours to solve questions, and post-sale queries)
- 15% Free Customization* (in case the scope or segment of the report does not match your requirements, 20% is equivalent to 3 working days of free work, applicable once)
- Free data Pack on the Five and Enterprise User License. (Excel version of the report)
- Free Updated report if the report is 6-12 months old or older.
- 24-hour priority response*
- Free Industry updates and white papers.
Possible Customization with this report (with additional cost and timeline talk to the sales executive to know more)
- Additional company profiles with specific to client's interest
- Additional country or region analysis- market size and forecast
- Expanded list for Company Profiles
- SWOT Analysis
Key Market Segments
By Propulsion type
- BEV
- HEV
- PHEV
By Output power
- Less Than or Equal to 130 kW
- More Than 130 kW
By Semiconductor material
- Gallium Nitride (GaN)
- Silicon (Si)
- Silicon Nitride (SiC)
By Technology type
- IGBT
- MOSFET
By Vehicle type
- Passenger Vehicles
- Light Commercial Vehicles
- Heavy Commercial Vehicles
By Region
- North America
- U.S.
- Canada
- Mexico
- Europe
- UK
- Germany
- France
- Spain
- Russia
- Italy
- Netherlands
- Norway
- Rest of Europe
- Asia-Pacific
- China
- Japan
- India
- Australia
- South Korea
- Vietnam
- Indonesia
- Rest of Asia-Pacific
- LAMEA
- Latin America
- Middle East
- Africa
Key Market Players:
- BorgWarner Inc.
- Curtiss-Wright Corporation
- Denso Corporation
- Eaton Corporation
- Hitachi, Ltd.
- Mitsubishi Electric Corporation.
- Robert Bosch GmbH
- TDK Electronics
- Valeo SA
- Vitesco Technologies Group Aktiengesellschaft
TABLE OF CONTENTS
CHAPTER 1: INTRODUCTION
- 1.1. Report description
- 1.2. Key market segments
- 1.3. Key benefits to the stakeholders
- 1.4. Research Methodology
- 1.4.1. Primary research
- 1.4.2. Secondary research
- 1.4.3. Analyst tools and models
CHAPTER 2: EXECUTIVE SUMMARY
- 2.1. CXO Perspective
CHAPTER 3: MARKET OVERVIEW
- 3.1. Market definition and scope
- 3.2. Key findings
- 3.2.1. Top impacting factors
- 3.2.2. Top investment pockets
- 3.3. Porter's five forces analysis
- 3.3.1. Moderate - to - high bargaining power of suppliers
- 3.3.2. Low - to - high threat of new entrants
- 3.3.3. Moderate threat of substitutes
- 3.3.4. Moderate - to - high intensity of rivalry
- 3.3.5. Low - to - high bargaining power of buyers
- 3.4. Market dynamics
- 3.4.1. Drivers
- 3.4.1.1. Adoption of Silicon Carbide (SiC) MOSFETs and High-Voltage Batteries
- 3.4.1.2. Surge in demand for electric vehicles
- 3.4.1.3. Increased demand for enhanced motor performance and operational efficiency
- 3.4.1. Drivers
- 3.4.2. Restraints
- 3.4.2.1. Lack of sufficient infrastructure for electric vehicles
- 3.4.2.2. Impact of global semiconductor shortage on the automotive traction inverters industry
- 3.4.3. Opportunities
- 3.4.3.1. Surge in demand for 800V traction inverters
- 3.4.3.2. Expansion of the EV automotive industry in emerging markets
- 3.5. COVID-19 Impact Analysis on the market
CHAPTER 4: AUTOMOTIVE TRACTION INVERTERS MARKET, BY PROPULSION TYPE
- 4.1. Overview
- 4.1.1. Market size and forecast
- 4.2. BEV
- 4.2.1. Key market trends, growth factors and opportunities
- 4.2.2. Market size and forecast, by region
- 4.2.3. Market share analysis by country
- 4.3. HEV
- 4.3.1. Key market trends, growth factors and opportunities
- 4.3.2. Market size and forecast, by region
- 4.3.3. Market share analysis by country
- 4.4. PHEV
- 4.4.1. Key market trends, growth factors and opportunities
- 4.4.2. Market size and forecast, by region
- 4.4.3. Market share analysis by country
CHAPTER 5: AUTOMOTIVE TRACTION INVERTERS MARKET, BY OUTPUT POWER
- 5.1. Overview
- 5.1.1. Market size and forecast
- 5.2. Less Than or Equal to 130 kW
- 5.2.1. Key market trends, growth factors and opportunities
- 5.2.2. Market size and forecast, by region
- 5.2.3. Market share analysis by country
- 5.3. More Than 130 kW
- 5.3.1. Key market trends, growth factors and opportunities
- 5.3.2. Market size and forecast, by region
- 5.3.3. Market share analysis by country
CHAPTER 6: AUTOMOTIVE TRACTION INVERTERS MARKET, BY SEMICONDUCTOR MATERIAL
- 6.1. Overview
- 6.1.1. Market size and forecast
- 6.2. Gallium Nitride (GaN)
- 6.2.1. Key market trends, growth factors and opportunities
- 6.2.2. Market size and forecast, by region
- 6.2.3. Market share analysis by country
- 6.3. Silicon (Si)
- 6.3.1. Key market trends, growth factors and opportunities
- 6.3.2. Market size and forecast, by region
- 6.3.3. Market share analysis by country
- 6.4. Silicon Nitride (SiC)
- 6.4.1. Key market trends, growth factors and opportunities
- 6.4.2. Market size and forecast, by region
- 6.4.3. Market share analysis by country
CHAPTER 7: AUTOMOTIVE TRACTION INVERTERS MARKET, BY TECHNOLOGY TYPE
- 7.1. Overview
- 7.1.1. Market size and forecast
- 7.2. IGBT
- 7.2.1. Key market trends, growth factors and opportunities
- 7.2.2. Market size and forecast, by region
- 7.2.3. Market share analysis by country
- 7.3. MOSFET
- 7.3.1. Key market trends, growth factors and opportunities
- 7.3.2. Market size and forecast, by region
- 7.3.3. Market share analysis by country
CHAPTER 8: AUTOMOTIVE TRACTION INVERTERS MARKET, BY VEHICLE TYPE
- 8.1. Overview
- 8.1.1. Market size and forecast
- 8.2. Passenger Vehicles
- 8.2.1. Key market trends, growth factors and opportunities
- 8.2.2. Market size and forecast, by region
- 8.2.3. Market share analysis by country
- 8.3. Light Commercial Vehicles
- 8.3.1. Key market trends, growth factors and opportunities
- 8.3.2. Market size and forecast, by region
- 8.3.3. Market share analysis by country
- 8.4. Heavy Commercial Vehicles
- 8.4.1. Key market trends, growth factors and opportunities
- 8.4.2. Market size and forecast, by region
- 8.4.3. Market share analysis by country
CHAPTER 9: AUTOMOTIVE TRACTION INVERTERS MARKET, BY REGION
- 9.1. Overview
- 9.1.1. Market size and forecast By Region
- 9.2. North America
- 9.2.1. Key trends and opportunities
- 9.2.2. Market size and forecast, by Propulsion type
- 9.2.3. Market size and forecast, by Output power
- 9.2.4. Market size and forecast, by Semiconductor material
- 9.2.5. Market size and forecast, by Technology type
- 9.2.6. Market size and forecast, by Vehicle type
- 9.2.7. Market size and forecast, by country
- 9.2.7.1. U.S.
- 9.2.7.1.1. Key market trends, growth factors and opportunities
- 9.2.7.1.2. Market size and forecast, by Propulsion type
- 9.2.7.1.3. Market size and forecast, by Output power
- 9.2.7.1.4. Market size and forecast, by Semiconductor material
- 9.2.7.1.5. Market size and forecast, by Technology type
- 9.2.7.1.6. Market size and forecast, by Vehicle type
- 9.2.7.2. Canada
- 9.2.7.2.1. Key market trends, growth factors and opportunities
- 9.2.7.2.2. Market size and forecast, by Propulsion type
- 9.2.7.2.3. Market size and forecast, by Output power
- 9.2.7.2.4. Market size and forecast, by Semiconductor material
- 9.2.7.2.5. Market size and forecast, by Technology type
- 9.2.7.2.6. Market size and forecast, by Vehicle type
- 9.2.7.3. Mexico
- 9.2.7.3.1. Key market trends, growth factors and opportunities
- 9.2.7.3.2. Market size and forecast, by Propulsion type
- 9.2.7.3.3. Market size and forecast, by Output power
- 9.2.7.3.4. Market size and forecast, by Semiconductor material
- 9.2.7.3.5. Market size and forecast, by Technology type
- 9.2.7.3.6. Market size and forecast, by Vehicle type
- 9.3. Europe
- 9.3.1. Key trends and opportunities
- 9.3.2. Market size and forecast, by Propulsion type
- 9.3.3. Market size and forecast, by Output power
- 9.3.4. Market size and forecast, by Semiconductor material
- 9.3.5. Market size and forecast, by Technology type
- 9.3.6. Market size and forecast, by Vehicle type
- 9.3.7. Market size and forecast, by country
- 9.3.7.1. UK
- 9.3.7.1.1. Key market trends, growth factors and opportunities
- 9.3.7.1.2. Market size and forecast, by Propulsion type
- 9.3.7.1.3. Market size and forecast, by Output power
- 9.3.7.1.4. Market size and forecast, by Semiconductor material
- 9.3.7.1.5. Market size and forecast, by Technology type
- 9.3.7.1.6. Market size and forecast, by Vehicle type
- 9.3.7.2. Germany
- 9.3.7.2.1. Key market trends, growth factors and opportunities
- 9.3.7.2.2. Market size and forecast, by Propulsion type
- 9.3.7.2.3. Market size and forecast, by Output power
- 9.3.7.2.4. Market size and forecast, by Semiconductor material
- 9.3.7.2.5. Market size and forecast, by Technology type
- 9.3.7.2.6. Market size and forecast, by Vehicle type
- 9.3.7.3. France
- 9.3.7.3.1. Key market trends, growth factors and opportunities
- 9.3.7.3.2. Market size and forecast, by Propulsion type
- 9.3.7.3.3. Market size and forecast, by Output power
- 9.3.7.3.4. Market size and forecast, by Semiconductor material
- 9.3.7.3.5. Market size and forecast, by Technology type
- 9.3.7.3.6. Market size and forecast, by Vehicle type
- 9.3.7.4. Spain
- 9.3.7.4.1. Key market trends, growth factors and opportunities
- 9.3.7.4.2. Market size and forecast, by Propulsion type
- 9.3.7.4.3. Market size and forecast, by Output power
- 9.3.7.4.4. Market size and forecast, by Semiconductor material
- 9.3.7.4.5. Market size and forecast, by Technology type
- 9.3.7.4.6. Market size and forecast, by Vehicle type
- 9.3.7.5. Russia
- 9.3.7.5.1. Key market trends, growth factors and opportunities
- 9.3.7.5.2. Market size and forecast, by Propulsion type
- 9.3.7.5.3. Market size and forecast, by Output power
- 9.3.7.5.4. Market size and forecast, by Semiconductor material
- 9.3.7.5.5. Market size and forecast, by Technology type
- 9.3.7.5.6. Market size and forecast, by Vehicle type
- 9.3.7.6. Italy
- 9.3.7.6.1. Key market trends, growth factors and opportunities
- 9.3.7.6.2. Market size and forecast, by Propulsion type
- 9.3.7.6.3. Market size and forecast, by Output power
- 9.3.7.6.4. Market size and forecast, by Semiconductor material
- 9.3.7.6.5. Market size and forecast, by Technology type
- 9.3.7.6.6. Market size and forecast, by Vehicle type
- 9.3.7.7. Netherlands
- 9.3.7.7.1. Key market trends, growth factors and opportunities
- 9.3.7.7.2. Market size and forecast, by Propulsion type
- 9.3.7.7.3. Market size and forecast, by Output power
- 9.3.7.7.4. Market size and forecast, by Semiconductor material
- 9.3.7.7.5. Market size and forecast, by Technology type
- 9.3.7.7.6. Market size and forecast, by Vehicle type
- 9.3.7.8. Norway
- 9.3.7.8.1. Key market trends, growth factors and opportunities
- 9.3.7.8.2. Market size and forecast, by Propulsion type
- 9.3.7.8.3. Market size and forecast, by Output power
- 9.3.7.8.4. Market size and forecast, by Semiconductor material
- 9.3.7.8.5. Market size and forecast, by Technology type
- 9.3.7.8.6. Market size and forecast, by Vehicle type
- 9.3.7.9. Rest of Europe
- 9.3.7.9.1. Key market trends, growth factors and opportunities
- 9.3.7.9.2. Market size and forecast, by Propulsion type
- 9.3.7.9.3. Market size and forecast, by Output power
- 9.3.7.9.4. Market size and forecast, by Semiconductor material
- 9.3.7.9.5. Market size and forecast, by Technology type
- 9.3.7.9.6. Market size and forecast, by Vehicle type
- 9.4. Asia-Pacific
- 9.4.1. Key trends and opportunities
- 9.4.2. Market size and forecast, by Propulsion type
- 9.4.3. Market size and forecast, by Output power
- 9.4.4. Market size and forecast, by Semiconductor material
- 9.4.5. Market size and forecast, by Technology type
- 9.4.6. Market size and forecast, by Vehicle type
- 9.4.7. Market size and forecast, by country
- 9.4.7.1. China
- 9.4.7.1.1. Key market trends, growth factors and opportunities
- 9.4.7.1.2. Market size and forecast, by Propulsion type
- 9.4.7.1.3. Market size and forecast, by Output power
- 9.4.7.1.4. Market size and forecast, by Semiconductor material
- 9.4.7.1.5. Market size and forecast, by Technology type
- 9.4.7.1.6. Market size and forecast, by Vehicle type
- 9.4.7.2. Japan
- 9.4.7.2.1. Key market trends, growth factors and opportunities
- 9.4.7.2.2. Market size and forecast, by Propulsion type
- 9.4.7.2.3. Market size and forecast, by Output power
- 9.4.7.2.4. Market size and forecast, by Semiconductor material
- 9.4.7.2.5. Market size and forecast, by Technology type
- 9.4.7.2.6. Market size and forecast, by Vehicle type
- 9.4.7.3. India
- 9.4.7.3.1. Key market trends, growth factors and opportunities
- 9.4.7.3.2. Market size and forecast, by Propulsion type
- 9.4.7.3.3. Market size and forecast, by Output power
- 9.4.7.3.4. Market size and forecast, by Semiconductor material
- 9.4.7.3.5. Market size and forecast, by Technology type
- 9.4.7.3.6. Market size and forecast, by Vehicle type
- 9.4.7.4. Australia
- 9.4.7.4.1. Key market trends, growth factors and opportunities
- 9.4.7.4.2. Market size and forecast, by Propulsion type
- 9.4.7.4.3. Market size and forecast, by Output power
- 9.4.7.4.4. Market size and forecast, by Semiconductor material
- 9.4.7.4.5. Market size and forecast, by Technology type
- 9.4.7.4.6. Market size and forecast, by Vehicle type
- 9.4.7.5. South Korea
- 9.4.7.5.1. Key market trends, growth factors and opportunities
- 9.4.7.5.2. Market size and forecast, by Propulsion type
- 9.4.7.5.3. Market size and forecast, by Output power
- 9.4.7.5.4. Market size and forecast, by Semiconductor material
- 9.4.7.5.5. Market size and forecast, by Technology type
- 9.4.7.5.6. Market size and forecast, by Vehicle type
- 9.4.7.6. Vietnam
- 9.4.7.6.1. Key market trends, growth factors and opportunities
- 9.4.7.6.2. Market size and forecast, by Propulsion type
- 9.4.7.6.3. Market size and forecast, by Output power
- 9.4.7.6.4. Market size and forecast, by Semiconductor material
- 9.4.7.6.5. Market size and forecast, by Technology type
- 9.4.7.6.6. Market size and forecast, by Vehicle type
- 9.4.7.7. Indonesia
- 9.4.7.7.1. Key market trends, growth factors and opportunities
- 9.4.7.7.2. Market size and forecast, by Propulsion type
- 9.4.7.7.3. Market size and forecast, by Output power
- 9.4.7.7.4. Market size and forecast, by Semiconductor material
- 9.4.7.7.5. Market size and forecast, by Technology type
- 9.4.7.7.6. Market size and forecast, by Vehicle type
- 9.4.7.8. Rest of Asia-Pacific
- 9.4.7.8.1. Key market trends, growth factors and opportunities
- 9.4.7.8.2. Market size and forecast, by Propulsion type
- 9.4.7.8.3. Market size and forecast, by Output power
- 9.4.7.8.4. Market size and forecast, by Semiconductor material
- 9.4.7.8.5. Market size and forecast, by Technology type
- 9.4.7.8.6. Market size and forecast, by Vehicle type
- 9.5. LAMEA
- 9.5.1. Key trends and opportunities
- 9.5.2. Market size and forecast, by Propulsion type
- 9.5.3. Market size and forecast, by Output power
- 9.5.4. Market size and forecast, by Semiconductor material
- 9.5.5. Market size and forecast, by Technology type
- 9.5.6. Market size and forecast, by Vehicle type
- 9.5.7. Market size and forecast, by country
- 9.5.7.1. Latin America
- 9.5.7.1.1. Key market trends, growth factors and opportunities
- 9.5.7.1.2. Market size and forecast, by Propulsion type
- 9.5.7.1.3. Market size and forecast, by Output power
- 9.5.7.1.4. Market size and forecast, by Semiconductor material
- 9.5.7.1.5. Market size and forecast, by Technology type
- 9.5.7.1.6. Market size and forecast, by Vehicle type
- 9.5.7.2. Middle East
- 9.5.7.2.1. Key market trends, growth factors and opportunities
- 9.5.7.2.2. Market size and forecast, by Propulsion type
- 9.5.7.2.3. Market size and forecast, by Output power
- 9.5.7.2.4. Market size and forecast, by Semiconductor material
- 9.5.7.2.5. Market size and forecast, by Technology type
- 9.5.7.2.6. Market size and forecast, by Vehicle type
- 9.5.7.3. Africa
- 9.5.7.3.1. Key market trends, growth factors and opportunities
- 9.5.7.3.2. Market size and forecast, by Propulsion type
- 9.5.7.3.3. Market size and forecast, by Output power
- 9.5.7.3.4. Market size and forecast, by Semiconductor material
- 9.5.7.3.5. Market size and forecast, by Technology type
- 9.5.7.3.6. Market size and forecast, by Vehicle type
CHAPTER 10: COMPETITIVE LANDSCAPE
- 10.1. Introduction
- 10.2. Top winning strategies
- 10.3. Product Mapping of Top 10 Player
- 10.4. Competitive Dashboard
- 10.5. Competitive Heatmap
- 10.6. Top player positioning, 2022
CHAPTER 11: COMPANY PROFILES
- 11.1. BorgWarner Inc.
- 11.1.1. Company overview
- 11.1.2. Key Executives
- 11.1.3. Company snapshot
- 11.1.4. Operating business segments
- 11.1.5. Product portfolio
- 11.1.6. Business performance
- 11.1.7. Key strategic moves and developments
- 11.2. Denso Corporation
- 11.2.1. Company overview
- 11.2.2. Key Executives
- 11.2.3. Company snapshot
- 11.2.4. Operating business segments
- 11.2.5. Product portfolio
- 11.2.6. Business performance
- 11.2.7. Key strategic moves and developments
- 11.3. Eaton Corporation
- 11.3.1. Company overview
- 11.3.2. Key Executives
- 11.3.3. Company snapshot
- 11.3.4. Operating business segments
- 11.3.5. Product portfolio
- 11.3.6. Business performance
- 11.3.7. Key strategic moves and developments
- 11.4. Hitachi, Ltd.
- 11.4.1. Company overview
- 11.4.2. Key Executives
- 11.4.3. Company snapshot
- 11.4.4. Operating business segments
- 11.4.5. Product portfolio
- 11.4.6. Business performance
- 11.4.7. Key strategic moves and developments
- 11.5. Mitsubishi Electric Corporation.
- 11.5.1. Company overview
- 11.5.2. Key Executives
- 11.5.3. Company snapshot
- 11.5.4. Operating business segments
- 11.5.5. Product portfolio
- 11.5.6. Business performance
- 11.6. Robert Bosch GmbH
- 11.6.1. Company overview
- 11.6.2. Key Executives
- 11.6.3. Company snapshot
- 11.6.4. Operating business segments
- 11.6.5. Product portfolio
- 11.6.6. Business performance
- 11.6.7. Key strategic moves and developments
- 11.7. TDK Electronics
- 11.7.1. Company overview
- 11.7.2. Key Executives
- 11.7.3. Company snapshot
- 11.7.4. Operating business segments
- 11.7.5. Product portfolio
- 11.7.6. Business performance
- 11.8. Valeo SA
- 11.8.1. Company overview
- 11.8.2. Key Executives
- 11.8.3. Company snapshot
- 11.8.4. Operating business segments
- 11.8.5. Product portfolio
- 11.8.6. Business performance
- 11.8.7. Key strategic moves and developments
- 11.9. Vitesco Technologies Group Aktiengesellschaft
- 11.9.1. Company overview
- 11.9.2. Key Executives
- 11.9.3. Company snapshot
- 11.9.4. Operating business segments
- 11.9.5. Product portfolio
- 11.9.6. Business performance
- 11.9.7. Key strategic moves and developments
- 11.10. Curtiss-Wright Corporation
- 11.10.1. Company overview
- 11.10.2. Key Executives
- 11.10.3. Company snapshot
- 11.10.4. Operating business segments
- 11.10.5. Product portfolio
- 11.10.6. Business performance
- 11.10.7. Key strategic moves and developments
LIST OF TABLES
- TABLE 01. GLOBAL AUTOMOTIVE TRACTION INVERTERS MARKET, BY PROPULSION TYPE, 2022-2032 ($MILLION)
- TABLE 02. AUTOMOTIVE TRACTION INVERTERS MARKET FOR BEV, BY REGION, 2022-2032 ($MILLION)
- TABLE 03. AUTOMOTIVE TRACTION INVERTERS MARKET FOR HEV, BY REGION, 2022-2032 ($MILLION)
- TABLE 04. AUTOMOTIVE TRACTION INVERTERS MARKET FOR PHEV, BY REGION, 2022-2032 ($MILLION)
- TABLE 05. GLOBAL AUTOMOTIVE TRACTION INVERTERS MARKET, BY OUTPUT POWER, 2022-2032 ($MILLION)
- TABLE 06. AUTOMOTIVE TRACTION INVERTERS MARKET FOR LESS THAN OR EQUAL TO 130 KW, BY REGION, 2022-2032 ($MILLION)
- TABLE 07. AUTOMOTIVE TRACTION INVERTERS MARKET FOR MORE THAN 130 KW, BY REGION, 2022-2032 ($MILLION)
- TABLE 08. GLOBAL AUTOMOTIVE TRACTION INVERTERS MARKET, BY SEMICONDUCTOR MATERIAL, 2022-2032 ($MILLION)
- TABLE 09. AUTOMOTIVE TRACTION INVERTERS MARKET FOR GALLIUM NITRIDE (GAN), BY REGION, 2022-2032 ($MILLION)
- TABLE 10. AUTOMOTIVE TRACTION INVERTERS MARKET FOR SILICON (SI), BY REGION, 2022-2032 ($MILLION)
- TABLE 11. AUTOMOTIVE TRACTION INVERTERS MARKET FOR SILICON NITRIDE (SIC), BY REGION, 2022-2032 ($MILLION)
- TABLE 12. GLOBAL AUTOMOTIVE TRACTION INVERTERS MARKET, BY TECHNOLOGY TYPE, 2022-2032 ($MILLION)
- TABLE 13. AUTOMOTIVE TRACTION INVERTERS MARKET FOR IGBT, BY REGION, 2022-2032 ($MILLION)
- TABLE 14. AUTOMOTIVE TRACTION INVERTERS MARKET FOR MOSFET, BY REGION, 2022-2032 ($MILLION)
- TABLE 15. GLOBAL AUTOMOTIVE TRACTION INVERTERS MARKET, BY VEHICLE TYPE, 2022-2032 ($MILLION)
- TABLE 16. AUTOMOTIVE TRACTION INVERTERS MARKET FOR PASSENGER VEHICLES, BY REGION, 2022-2032 ($MILLION)
- TABLE 17. AUTOMOTIVE TRACTION INVERTERS MARKET FOR LIGHT COMMERCIAL VEHICLES, BY REGION, 2022-2032 ($MILLION)
- TABLE 18. AUTOMOTIVE TRACTION INVERTERS MARKET FOR HEAVY COMMERCIAL VEHICLES, BY REGION, 2022-2032 ($MILLION)
- TABLE 19. AUTOMOTIVE TRACTION INVERTERS MARKET, BY REGION, 2022-2032 ($MILLION)
- TABLE 20. NORTH AMERICA AUTOMOTIVE TRACTION INVERTERS MARKET, BY PROPULSION TYPE, 2022-2032 ($MILLION)
- TABLE 21. NORTH AMERICA AUTOMOTIVE TRACTION INVERTERS MARKET, BY OUTPUT POWER, 2022-2032 ($MILLION)
- TABLE 22. NORTH AMERICA AUTOMOTIVE TRACTION INVERTERS MARKET, BY SEMICONDUCTOR MATERIAL, 2022-2032 ($MILLION)
- TABLE 23. NORTH AMERICA AUTOMOTIVE TRACTION INVERTERS MARKET, BY TECHNOLOGY TYPE, 2022-2032 ($MILLION)
- TABLE 24. NORTH AMERICA AUTOMOTIVE TRACTION INVERTERS MARKET, BY VEHICLE TYPE, 2022-2032 ($MILLION)
- TABLE 25. NORTH AMERICA AUTOMOTIVE TRACTION INVERTERS MARKET, BY COUNTRY, 2022-2032 ($MILLION)
- TABLE 26. U.S. AUTOMOTIVE TRACTION INVERTERS MARKET, BY PROPULSION TYPE, 2022-2032 ($MILLION)
- TABLE 27. U.S. AUTOMOTIVE TRACTION INVERTERS MARKET, BY OUTPUT POWER, 2022-2032 ($MILLION)
- TABLE 28. U.S. AUTOMOTIVE TRACTION INVERTERS MARKET, BY SEMICONDUCTOR MATERIAL, 2022-2032 ($MILLION)
- TABLE 29. U.S. AUTOMOTIVE TRACTION INVERTERS MARKET, BY TECHNOLOGY TYPE, 2022-2032 ($MILLION)
- TABLE 30. U.S. AUTOMOTIVE TRACTION INVERTERS MARKET, BY VEHICLE TYPE, 2022-2032 ($MILLION)
- TABLE 31. CANADA AUTOMOTIVE TRACTION INVERTERS MARKET, BY PROPULSION TYPE, 2022-2032 ($MILLION)
- TABLE 32. CANADA AUTOMOTIVE TRACTION INVERTERS MARKET, BY OUTPUT POWER, 2022-2032 ($MILLION)
- TABLE 33. CANADA AUTOMOTIVE TRACTION INVERTERS MARKET, BY SEMICONDUCTOR MATERIAL, 2022-2032 ($MILLION)
- TABLE 34. CANADA AUTOMOTIVE TRACTION INVERTERS MARKET, BY TECHNOLOGY TYPE, 2022-2032 ($MILLION)
- TABLE 35. CANADA AUTOMOTIVE TRACTION INVERTERS MARKET, BY VEHICLE TYPE, 2022-2032 ($MILLION)
- TABLE 36. MEXICO AUTOMOTIVE TRACTION INVERTERS MARKET, BY PROPULSION TYPE, 2022-2032 ($MILLION)
- TABLE 37. MEXICO AUTOMOTIVE TRACTION INVERTERS MARKET, BY OUTPUT POWER, 2022-2032 ($MILLION)
- TABLE 38. MEXICO AUTOMOTIVE TRACTION INVERTERS MARKET, BY SEMICONDUCTOR MATERIAL, 2022-2032 ($MILLION)
- TABLE 39. MEXICO AUTOMOTIVE TRACTION INVERTERS MARKET, BY TECHNOLOGY TYPE, 2022-2032 ($MILLION)
- TABLE 40. MEXICO AUTOMOTIVE TRACTION INVERTERS MARKET, BY VEHICLE TYPE, 2022-2032 ($MILLION)
- TABLE 41. EUROPE AUTOMOTIVE TRACTION INVERTERS MARKET, BY PROPULSION TYPE, 2022-2032 ($MILLION)
- TABLE 42. EUROPE AUTOMOTIVE TRACTION INVERTERS MARKET, BY OUTPUT POWER, 2022-2032 ($MILLION)
- TABLE 43. EUROPE AUTOMOTIVE TRACTION INVERTERS MARKET, BY SEMICONDUCTOR MATERIAL, 2022-2032 ($MILLION)
- TABLE 44. EUROPE AUTOMOTIVE TRACTION INVERTERS MARKET, BY TECHNOLOGY TYPE, 2022-2032 ($MILLION)
- TABLE 45. EUROPE AUTOMOTIVE TRACTION INVERTERS MARKET, BY VEHICLE TYPE, 2022-2032 ($MILLION)
- TABLE 46. EUROPE AUTOMOTIVE TRACTION INVERTERS MARKET, BY COUNTRY, 2022-2032 ($MILLION)
- TABLE 47. UK AUTOMOTIVE TRACTION INVERTERS MARKET, BY PROPULSION TYPE, 2022-2032 ($MILLION)
- TABLE 48. UK AUTOMOTIVE TRACTION INVERTERS MARKET, BY OUTPUT POWER, 2022-2032 ($MILLION)
- TABLE 49. UK AUTOMOTIVE TRACTION INVERTERS MARKET, BY SEMICONDUCTOR MATERIAL, 2022-2032 ($MILLION)
- TABLE 50. UK AUTOMOTIVE TRACTION INVERTERS MARKET, BY TECHNOLOGY TYPE, 2022-2032 ($MILLION)
- TABLE 51. UK AUTOMOTIVE TRACTION INVERTERS MARKET, BY VEHICLE TYPE, 2022-2032 ($MILLION)
- TABLE 52. GERMANY AUTOMOTIVE TRACTION INVERTERS MARKET, BY PROPULSION TYPE, 2022-2032 ($MILLION)
- TABLE 53. GERMANY AUTOMOTIVE TRACTION INVERTERS MARKET, BY OUTPUT POWER, 2022-2032 ($MILLION)
- TABLE 54. GERMANY AUTOMOTIVE TRACTION INVERTERS MARKET, BY SEMICONDUCTOR MATERIAL, 2022-2032 ($MILLION)
- TABLE 55. GERMANY AUTOMOTIVE TRACTION INVERTERS MARKET, BY TECHNOLOGY TYPE, 2022-2032 ($MILLION)
- TABLE 56. GERMANY AUTOMOTIVE TRACTION INVERTERS MARKET, BY VEHICLE TYPE, 2022-2032 ($MILLION)
- TABLE 57. FRANCE AUTOMOTIVE TRACTION INVERTERS MARKET, BY PROPULSION TYPE, 2022-2032 ($MILLION)
- TABLE 58. FRANCE AUTOMOTIVE TRACTION INVERTERS MARKET, BY OUTPUT POWER, 2022-2032 ($MILLION)
- TABLE 59. FRANCE AUTOMOTIVE TRACTION INVERTERS MARKET, BY SEMICONDUCTOR MATERIAL, 2022-2032 ($MILLION)
- TABLE 60. FRANCE AUTOMOTIVE TRACTION INVERTERS MARKET, BY TECHNOLOGY TYPE, 2022-2032 ($MILLION)
- TABLE 61. FRANCE AUTOMOTIVE TRACTION INVERTERS MARKET, BY VEHICLE TYPE, 2022-2032 ($MILLION)
- TABLE 62. SPAIN AUTOMOTIVE TRACTION INVERTERS MARKET, BY PROPULSION TYPE, 2022-2032 ($MILLION)
- TABLE 63. SPAIN AUTOMOTIVE TRACTION INVERTERS MARKET, BY OUTPUT POWER, 2022-2032 ($MILLION)
- TABLE 64. SPAIN AUTOMOTIVE TRACTION INVERTERS MARKET, BY SEMICONDUCTOR MATERIAL, 2022-2032 ($MILLION)
- TABLE 65. SPAIN AUTOMOTIVE TRACTION INVERTERS MARKET, BY TECHNOLOGY TYPE, 2022-2032 ($MILLION)
- TABLE 66. SPAIN AUTOMOTIVE TRACTION INVERTERS MARKET, BY VEHICLE TYPE, 2022-2032 ($MILLION)
- TABLE 67. RUSSIA AUTOMOTIVE TRACTION INVERTERS MARKET, BY PROPULSION TYPE, 2022-2032 ($MILLION)
- TABLE 68. RUSSIA AUTOMOTIVE TRACTION INVERTERS MARKET, BY OUTPUT POWER, 2022-2032 ($MILLION)
- TABLE 69. RUSSIA AUTOMOTIVE TRACTION INVERTERS MARKET, BY SEMICONDUCTOR MATERIAL, 2022-2032 ($MILLION)
- TABLE 70. RUSSIA AUTOMOTIVE TRACTION INVERTERS MARKET, BY TECHNOLOGY TYPE, 2022-2032 ($MILLION)
- TABLE 71. RUSSIA AUTOMOTIVE TRACTION INVERTERS MARKET, BY VEHICLE TYPE, 2022-2032 ($MILLION)
- TABLE 72. ITALY AUTOMOTIVE TRACTION INVERTERS MARKET, BY PROPULSION TYPE, 2022-2032 ($MILLION)
- TABLE 73. ITALY AUTOMOTIVE TRACTION INVERTERS MARKET, BY OUTPUT POWER, 2022-2032 ($MILLION)
- TABLE 74. ITALY AUTOMOTIVE TRACTION INVERTERS MARKET, BY SEMICONDUCTOR MATERIAL, 2022-2032 ($MILLION)
- TABLE 75. ITALY AUTOMOTIVE TRACTION INVERTERS MARKET, BY TECHNOLOGY TYPE, 2022-2032 ($MILLION)
- TABLE 76. ITALY AUTOMOTIVE TRACTION INVERTERS MARKET, BY VEHICLE TYPE, 2022-2032 ($MILLION)
- TABLE 77. NETHERLANDS AUTOMOTIVE TRACTION INVERTERS MARKET, BY PROPULSION TYPE, 2022-2032 ($MILLION)
- TABLE 78. NETHERLANDS AUTOMOTIVE TRACTION INVERTERS MARKET, BY OUTPUT POWER, 2022-2032 ($MILLION)
- TABLE 79. NETHERLANDS AUTOMOTIVE TRACTION INVERTERS MARKET, BY SEMICONDUCTOR MATERIAL, 2022-2032 ($MILLION)
- TABLE 80. NETHERLANDS AUTOMOTIVE TRACTION INVERTERS MARKET, BY TECHNOLOGY TYPE, 2022-2032 ($MILLION)
- TABLE 81. NETHERLANDS AUTOMOTIVE TRACTION INVERTERS MARKET, BY VEHICLE TYPE, 2022-2032 ($MILLION)
- TABLE 82. NORWAY AUTOMOTIVE TRACTION INVERTERS MARKET, BY PROPULSION TYPE, 2022-2032 ($MILLION)
- TABLE 83. NORWAY AUTOMOTIVE TRACTION INVERTERS MARKET, BY OUTPUT POWER, 2022-2032 ($MILLION)
- TABLE 84. NORWAY AUTOMOTIVE TRACTION INVERTERS MARKET, BY SEMICONDUCTOR MATERIAL, 2022-2032 ($MILLION)
- TABLE 85. NORWAY AUTOMOTIVE TRACTION INVERTERS MARKET, BY TECHNOLOGY TYPE, 2022-2032 ($MILLION)
- TABLE 86. NORWAY AUTOMOTIVE TRACTION INVERTERS MARKET, BY VEHICLE TYPE, 2022-2032 ($MILLION)
- TABLE 87. REST OF EUROPE AUTOMOTIVE TRACTION INVERTERS MARKET, BY PROPULSION TYPE, 2022-2032 ($MILLION)
- TABLE 88. REST OF EUROPE AUTOMOTIVE TRACTION INVERTERS MARKET, BY OUTPUT POWER, 2022-2032 ($MILLION)
- TABLE 89. REST OF EUROPE AUTOMOTIVE TRACTION INVERTERS MARKET, BY SEMICONDUCTOR MATERIAL, 2022-2032 ($MILLION)
- TABLE 90. REST OF EUROPE AUTOMOTIVE TRACTION INVERTERS MARKET, BY TECHNOLOGY TYPE, 2022-2032 ($MILLION)
- TABLE 91. REST OF EUROPE AUTOMOTIVE TRACTION INVERTERS MARKET, BY VEHICLE TYPE, 2022-2032 ($MILLION)
- TABLE 92. ASIA-PACIFIC AUTOMOTIVE TRACTION INVERTERS MARKET, BY PROPULSION TYPE, 2022-2032 ($MILLION)
- TABLE 93. ASIA-PACIFIC AUTOMOTIVE TRACTION INVERTERS MARKET, BY OUTPUT POWER, 2022-2032 ($MILLION)
- TABLE 94. ASIA-PACIFIC AUTOMOTIVE TRACTION INVERTERS MARKET, BY SEMICONDUCTOR MATERIAL, 2022-2032 ($MILLION)
- TABLE 95. ASIA-PACIFIC AUTOMOTIVE TRACTION INVERTERS MARKET, BY TECHNOLOGY TYPE, 2022-2032 ($MILLION)
- TABLE 96. ASIA-PACIFIC AUTOMOTIVE TRACTION INVERTERS MARKET, BY VEHICLE TYPE, 2022-2032 ($MILLION)
- TABLE 97. ASIA-PACIFIC AUTOMOTIVE TRACTION INVERTERS MARKET, BY COUNTRY, 2022-2032 ($MILLION)
- TABLE 98. CHINA AUTOMOTIVE TRACTION INVERTERS MARKET, BY PROPULSION TYPE, 2022-2032 ($MILLION)
- TABLE 99. CHINA AUTOMOTIVE TRACTION INVERTERS MARKET, BY OUTPUT POWER, 2022-2032 ($MILLION)
- TABLE 100. CHINA AUTOMOTIVE TRACTION INVERTERS MARKET, BY SEMICONDUCTOR MATERIAL, 2022-2032 ($MILLION)
- TABLE 101. CHINA AUTOMOTIVE TRACTION INVERTERS MARKET, BY TECHNOLOGY TYPE, 2022-2032 ($MILLION)
- TABLE 102. CHINA AUTOMOTIVE TRACTION INVERTERS MARKET, BY VEHICLE TYPE, 2022-2032 ($MILLION)
- TABLE 103. JAPAN AUTOMOTIVE TRACTION INVERTERS MARKET, BY PROPULSION TYPE, 2022-2032 ($MILLION)
- TABLE 104. JAPAN AUTOMOTIVE TRACTION INVERTERS MARKET, BY OUTPUT POWER, 2022-2032 ($MILLION)
- TABLE 105. JAPAN AUTOMOTIVE TRACTION INVERTERS MARKET, BY SEMICONDUCTOR MATERIAL, 2022-2032 ($MILLION)
- TABLE 106. JAPAN AUTOMOTIVE TRACTION INVERTERS MARKET, BY TECHNOLOGY TYPE, 2022-2032 ($MILLION)
- TABLE 107. JAPAN AUTOMOTIVE TRACTION INVERTERS MARKET, BY VEHICLE TYPE, 2022-2032 ($MILLION)
- TABLE 108. INDIA AUTOMOTIVE TRACTION INVERTERS MARKET, BY PROPULSION TYPE, 2022-2032 ($MILLION)
- TABLE 109. INDIA AUTOMOTIVE TRACTION INVERTERS MARKET, BY OUTPUT POWER, 2022-2032 ($MILLION)
- TABLE 110. INDIA AUTOMOTIVE TRACTION INVERTERS MARKET, BY SEMICONDUCTOR MATERIAL, 2022-2032 ($MILLION)
- TABLE 111. INDIA AUTOMOTIVE TRACTION INVERTERS MARKET, BY TECHNOLOGY TYPE, 2022-2032 ($MILLION)
- TABLE 112. INDIA AUTOMOTIVE TRACTION INVERTERS MARKET, BY VEHICLE TYPE, 2022-2032 ($MILLION)
- TABLE 113. AUSTRALIA AUTOMOTIVE TRACTION INVERTERS MARKET, BY PROPULSION TYPE, 2022-2032 ($MILLION)
- TABLE 114. AUSTRALIA AUTOMOTIVE TRACTION INVERTERS MARKET, BY OUTPUT POWER, 2022-2032 ($MILLION)
- TABLE 115. AUSTRALIA AUTOMOTIVE TRACTION INVERTERS MARKET, BY SEMICONDUCTOR MATERIAL, 2022-2032 ($MILLION)
- TABLE 116. AUSTRALIA AUTOMOTIVE TRACTION INVERTERS MARKET, BY TECHNOLOGY TYPE, 2022-2032 ($MILLION)
- TABLE 117. AUSTRALIA AUTOMOTIVE TRACTION INVERTERS MARKET, BY VEHICLE TYPE, 2022-2032 ($MILLION)
- TABLE 118. SOUTH KOREA AUTOMOTIVE TRACTION INVERTERS MARKET, BY PROPULSION TYPE, 2022-2032 ($MILLION)
- TABLE 119. SOUTH KOREA AUTOMOTIVE TRACTION INVERTERS MARKET, BY OUTPUT POWER, 2022-2032 ($MILLION)
- TABLE 120. SOUTH KOREA AUTOMOTIVE TRACTION INVERTERS MARKET, BY SEMICONDUCTOR MATERIAL, 2022-2032 ($MILLION)
- TABLE 121. SOUTH KOREA AUTOMOTIVE TRACTION INVERTERS MARKET, BY TECHNOLOGY TYPE, 2022-2032 ($MILLION)
- TABLE 122. SOUTH KOREA AUTOMOTIVE TRACTION INVERTERS MARKET, BY VEHICLE TYPE, 2022-2032 ($MILLION)
- TABLE 123. VIETNAM AUTOMOTIVE TRACTION INVERTERS MARKET, BY PROPULSION TYPE, 2022-2032 ($MILLION)
- TABLE 124. VIETNAM AUTOMOTIVE TRACTION INVERTERS MARKET, BY OUTPUT POWER, 2022-2032 ($MILLION)
- TABLE 125. VIETNAM AUTOMOTIVE TRACTION INVERTERS MARKET, BY SEMICONDUCTOR MATERIAL, 2022-2032 ($MILLION)
- TABLE 126. VIETNAM AUTOMOTIVE TRACTION INVERTERS MARKET, BY TECHNOLOGY TYPE, 2022-2032 ($MILLION)
- TABLE 127. VIETNAM AUTOMOTIVE TRACTION INVERTERS MARKET, BY VEHICLE TYPE, 2022-2032 ($MILLION)
- TABLE 128. INDONESIA AUTOMOTIVE TRACTION INVERTERS MARKET, BY PROPULSION TYPE, 2022-2032 ($MILLION)
- TABLE 129. INDONESIA AUTOMOTIVE TRACTION INVERTERS MARKET, BY OUTPUT POWER, 2022-2032 ($MILLION)
- TABLE 130. INDONESIA AUTOMOTIVE TRACTION INVERTERS MARKET, BY SEMICONDUCTOR MATERIAL, 2022-2032 ($MILLION)
- TABLE 131. INDONESIA AUTOMOTIVE TRACTION INVERTERS MARKET, BY TECHNOLOGY TYPE, 2022-2032 ($MILLION)
- TABLE 132. INDONESIA AUTOMOTIVE TRACTION INVERTERS MARKET, BY VEHICLE TYPE, 2022-2032 ($MILLION)
- TABLE 133. REST OF ASIA-PACIFIC AUTOMOTIVE TRACTION INVERTERS MARKET, BY PROPULSION TYPE, 2022-2032 ($MILLION)
- TABLE 134. REST OF ASIA-PACIFIC AUTOMOTIVE TRACTION INVERTERS MARKET, BY OUTPUT POWER, 2022-2032 ($MILLION)
- TABLE 135. REST OF ASIA-PACIFIC AUTOMOTIVE TRACTION INVERTERS MARKET, BY SEMICONDUCTOR MATERIAL, 2022-2032 ($MILLION)
- TABLE 136. REST OF ASIA-PACIFIC AUTOMOTIVE TRACTION INVERTERS MARKET, BY TECHNOLOGY TYPE, 2022-2032 ($MILLION)
- TABLE 137. REST OF ASIA-PACIFIC AUTOMOTIVE TRACTION INVERTERS MARKET, BY VEHICLE TYPE, 2022-2032 ($MILLION)
- TABLE 138. LAMEA AUTOMOTIVE TRACTION INVERTERS MARKET, BY PROPULSION TYPE, 2022-2032 ($MILLION)
- TABLE 139. LAMEA AUTOMOTIVE TRACTION INVERTERS MARKET, BY OUTPUT POWER, 2022-2032 ($MILLION)
- TABLE 140. LAMEA AUTOMOTIVE TRACTION INVERTERS MARKET, BY SEMICONDUCTOR MATERIAL, 2022-2032 ($MILLION)
- TABLE 141. LAMEA AUTOMOTIVE TRACTION INVERTERS MARKET, BY TECHNOLOGY TYPE, 2022-2032 ($MILLION)
- TABLE 142. LAMEA AUTOMOTIVE TRACTION INVERTERS MARKET, BY VEHICLE TYPE, 2022-2032 ($MILLION)
- TABLE 143. LAMEA AUTOMOTIVE TRACTION INVERTERS MARKET, BY COUNTRY, 2022-2032 ($MILLION)
- TABLE 144. LATIN AMERICA AUTOMOTIVE TRACTION INVERTERS MARKET, BY PROPULSION TYPE, 2022-2032 ($MILLION)
- TABLE 145. LATIN AMERICA AUTOMOTIVE TRACTION INVERTERS MARKET, BY OUTPUT POWER, 2022-2032 ($MILLION)
- TABLE 146. LATIN AMERICA AUTOMOTIVE TRACTION INVERTERS MARKET, BY SEMICONDUCTOR MATERIAL, 2022-2032 ($MILLION)
- TABLE 147. LATIN AMERICA AUTOMOTIVE TRACTION INVERTERS MARKET, BY TECHNOLOGY TYPE, 2022-2032 ($MILLION)
- TABLE 148. LATIN AMERICA AUTOMOTIVE TRACTION INVERTERS MARKET, BY VEHICLE TYPE, 2022-2032 ($MILLION)
- TABLE 149. MIDDLE EAST AUTOMOTIVE TRACTION INVERTERS MARKET, BY PROPULSION TYPE, 2022-2032 ($MILLION)
- TABLE 150. MIDDLE EAST AUTOMOTIVE TRACTION INVERTERS MARKET, BY OUTPUT POWER, 2022-2032 ($MILLION)
- TABLE 151. MIDDLE EAST AUTOMOTIVE TRACTION INVERTERS MARKET, BY SEMICONDUCTOR MATERIAL, 2022-2032 ($MILLION)
- TABLE 152. MIDDLE EAST AUTOMOTIVE TRACTION INVERTERS MARKET, BY TECHNOLOGY TYPE, 2022-2032 ($MILLION)
- TABLE 153. MIDDLE EAST AUTOMOTIVE TRACTION INVERTERS MARKET, BY VEHICLE TYPE, 2022-2032 ($MILLION)
- TABLE 154. AFRICA AUTOMOTIVE TRACTION INVERTERS MARKET, BY PROPULSION TYPE, 2022-2032 ($MILLION)
- TABLE 155. AFRICA AUTOMOTIVE TRACTION INVERTERS MARKET, BY OUTPUT POWER, 2022-2032 ($MILLION)
- TABLE 156. AFRICA AUTOMOTIVE TRACTION INVERTERS MARKET, BY SEMICONDUCTOR MATERIAL, 2022-2032 ($MILLION)
- TABLE 157. AFRICA AUTOMOTIVE TRACTION INVERTERS MARKET, BY TECHNOLOGY TYPE, 2022-2032 ($MILLION)
- TABLE 158. AFRICA AUTOMOTIVE TRACTION INVERTERS MARKET, BY VEHICLE TYPE, 2022-2032 ($MILLION)
- TABLE 159. BORGWARNER INC.: KEY EXECUTIVES
- TABLE 160. BORGWARNER INC.: COMPANY SNAPSHOT
- TABLE 161. BORGWARNER INC.: SERVICE SEGMENTS
- TABLE 162. BORGWARNER INC.: PRODUCT PORTFOLIO
- TABLE 163. BORGWARNER INC.: KEY STRATERGIES
- TABLE 164. DENSO CORPORATION: KEY EXECUTIVES
- TABLE 165. DENSO CORPORATION: COMPANY SNAPSHOT
- TABLE 166. DENSO CORPORATION: PRODUCT SEGMENTS
- TABLE 167. DENSO CORPORATION: PRODUCT PORTFOLIO
- TABLE 168. DENSO CORPORATION: KEY STRATERGIES
- TABLE 169. EATON CORPORATION: KEY EXECUTIVES
- TABLE 170. EATON CORPORATION: COMPANY SNAPSHOT
- TABLE 171. EATON CORPORATION: PRODUCT SEGMENTS
- TABLE 172. EATON CORPORATION: PRODUCT PORTFOLIO
- TABLE 173. EATON CORPORATION: KEY STRATERGIES
- TABLE 174. HITACHI, LTD.: KEY EXECUTIVES
- TABLE 175. HITACHI, LTD.: COMPANY SNAPSHOT
- TABLE 176. HITACHI, LTD.: SERVICE SEGMENTS
- TABLE 177. HITACHI, LTD.: PRODUCT PORTFOLIO
- TABLE 178. HITACHI, LTD.: KEY STRATERGIES
- TABLE 179. MITSUBISHI ELECTRIC CORPORATION.: KEY EXECUTIVES
- TABLE 180. MITSUBISHI ELECTRIC CORPORATION.: COMPANY SNAPSHOT
- TABLE 181. MITSUBISHI ELECTRIC CORPORATION.: PRODUCT SEGMENTS
- TABLE 182. MITSUBISHI ELECTRIC CORPORATION.: PRODUCT PORTFOLIO
- TABLE 183. ROBERT BOSCH GMBH: KEY EXECUTIVES
- TABLE 184. ROBERT BOSCH GMBH: COMPANY SNAPSHOT
- TABLE 185. ROBERT BOSCH GMBH: PRODUCT SEGMENTS
- TABLE 186. ROBERT BOSCH GMBH: PRODUCT PORTFOLIO
- TABLE 187. ROBERT BOSCH GMBH: KEY STRATERGIES
- TABLE 188. TDK ELECTRONICS: KEY EXECUTIVES
- TABLE 189. TDK ELECTRONICS: COMPANY SNAPSHOT
- TABLE 190. TDK ELECTRONICS: PRODUCT SEGMENTS
- TABLE 191. TDK ELECTRONICS: PRODUCT PORTFOLIO
- TABLE 192. VALEO SA: KEY EXECUTIVES
- TABLE 193. VALEO SA: COMPANY SNAPSHOT
- TABLE 194. VALEO SA: PRODUCT SEGMENTS
- TABLE 195. VALEO SA: PRODUCT PORTFOLIO
- TABLE 196. VALEO SA: KEY STRATERGIES
- TABLE 197. VITESCO TECHNOLOGIES GROUP AKTIENGESELLSCHAFT: KEY EXECUTIVES
- TABLE 198. VITESCO TECHNOLOGIES GROUP AKTIENGESELLSCHAFT: COMPANY SNAPSHOT
- TABLE 199. VITESCO TECHNOLOGIES GROUP AKTIENGESELLSCHAFT: PRODUCT SEGMENTS
- TABLE 200. VITESCO TECHNOLOGIES GROUP AKTIENGESELLSCHAFT: PRODUCT PORTFOLIO
- TABLE 201. VITESCO TECHNOLOGIES GROUP AKTIENGESELLSCHAFT: KEY STRATERGIES
- TABLE 202. CURTISS-WRIGHT CORPORATION: KEY EXECUTIVES
- TABLE 203. CURTISS-WRIGHT CORPORATION: COMPANY SNAPSHOT
- TABLE 204. CURTISS-WRIGHT CORPORATION: PRODUCT SEGMENTS
- TABLE 205. CURTISS-WRIGHT CORPORATION: PRODUCT PORTFOLIO
- TABLE 206. CURTISS-WRIGHT CORPORATION: KEY STRATERGIES
LIST OF FIGURES
- FIGURE 01. AUTOMOTIVE TRACTION INVERTERS MARKET, 2022-2032
- FIGURE 02. SEGMENTATION OF AUTOMOTIVE TRACTION INVERTERS MARKET, 2022-2032
- FIGURE 03. AUTOMOTIVE TRACTION INVERTERS MARKET,2022-2032
- FIGURE 04. TOP INVESTMENT POCKETS IN AUTOMOTIVE TRACTION INVERTERS MARKET (2023-2032)
- FIGURE 05. MODERATE - TO - HIGH BARGAINING POWER OF SUPPLIERS
- FIGURE 06. LOW - TO - HIGH THREAT OF NEW ENTRANTS
- FIGURE 07. MODERATE THREAT OF SUBSTITUTES
- FIGURE 08. MODERATE - TO - HIGH INTENSITY OF RIVALRY
- FIGURE 09. LOW - TO - HIGH BARGAINING POWER OF BUYERS
- FIGURE 10. GLOBAL AUTOMOTIVE TRACTION INVERTERS MARKET:DRIVERS, RESTRAINTS AND OPPORTUNITIES
- FIGURE 11. AUTOMOTIVE TRACTION INVERTERS MARKET, BY PROPULSION TYPE, 2022(%)
- FIGURE 12. COMPARATIVE SHARE ANALYSIS OF AUTOMOTIVE TRACTION INVERTERS MARKET FOR BEV, BY COUNTRY 2022-2032(%)
- FIGURE 13. COMPARATIVE SHARE ANALYSIS OF AUTOMOTIVE TRACTION INVERTERS MARKET FOR HEV, BY COUNTRY 2022-2032(%)
- FIGURE 14. COMPARATIVE SHARE ANALYSIS OF AUTOMOTIVE TRACTION INVERTERS MARKET FOR PHEV, BY COUNTRY 2022-2032(%)
- FIGURE 15. AUTOMOTIVE TRACTION INVERTERS MARKET, BY OUTPUT POWER, 2022(%)
- FIGURE 16. COMPARATIVE SHARE ANALYSIS OF AUTOMOTIVE TRACTION INVERTERS MARKET FOR LESS THAN OR EQUAL TO 130 KW, BY COUNTRY 2022-2032(%)
- FIGURE 17. COMPARATIVE SHARE ANALYSIS OF AUTOMOTIVE TRACTION INVERTERS MARKET FOR MORE THAN 130 KW, BY COUNTRY 2022-2032(%)
- FIGURE 18. AUTOMOTIVE TRACTION INVERTERS MARKET, BY SEMICONDUCTOR MATERIAL, 2022(%)
- FIGURE 19. COMPARATIVE SHARE ANALYSIS OF AUTOMOTIVE TRACTION INVERTERS MARKET FOR GALLIUM NITRIDE (GAN), BY COUNTRY 2022-2032(%)
- FIGURE 20. COMPARATIVE SHARE ANALYSIS OF AUTOMOTIVE TRACTION INVERTERS MARKET FOR SILICON (SI), BY COUNTRY 2022-2032(%)
- FIGURE 21. COMPARATIVE SHARE ANALYSIS OF AUTOMOTIVE TRACTION INVERTERS MARKET FOR SILICON NITRIDE (SIC), BY COUNTRY 2022-2032(%)
- FIGURE 22. AUTOMOTIVE TRACTION INVERTERS MARKET, BY TECHNOLOGY TYPE, 2022(%)
- FIGURE 23. COMPARATIVE SHARE ANALYSIS OF AUTOMOTIVE TRACTION INVERTERS MARKET FOR IGBT, BY COUNTRY 2022-2032(%)
- FIGURE 24. COMPARATIVE SHARE ANALYSIS OF AUTOMOTIVE TRACTION INVERTERS MARKET FOR MOSFET, BY COUNTRY 2022-2032(%)
- FIGURE 25. AUTOMOTIVE TRACTION INVERTERS MARKET, BY VEHICLE TYPE, 2022(%)
- FIGURE 26. COMPARATIVE SHARE ANALYSIS OF AUTOMOTIVE TRACTION INVERTERS MARKET FOR PASSENGER VEHICLES, BY COUNTRY 2022-2032(%)
- FIGURE 27. COMPARATIVE SHARE ANALYSIS OF AUTOMOTIVE TRACTION INVERTERS MARKET FOR LIGHT COMMERCIAL VEHICLES, BY COUNTRY 2022-2032(%)
- FIGURE 28. COMPARATIVE SHARE ANALYSIS OF AUTOMOTIVE TRACTION INVERTERS MARKET FOR HEAVY COMMERCIAL VEHICLES, BY COUNTRY 2022-2032(%)
- FIGURE 29. AUTOMOTIVE TRACTION INVERTERS MARKET BY REGION, 2022
- FIGURE 30. U.S. AUTOMOTIVE TRACTION INVERTERS MARKET, 2022-2032 ($MILLION)
- FIGURE 31. CANADA AUTOMOTIVE TRACTION INVERTERS MARKET, 2022-2032 ($MILLION)
- FIGURE 32. MEXICO AUTOMOTIVE TRACTION INVERTERS MARKET, 2022-2032 ($MILLION)
- FIGURE 33. UK AUTOMOTIVE TRACTION INVERTERS MARKET, 2022-2032 ($MILLION)
- FIGURE 34. GERMANY AUTOMOTIVE TRACTION INVERTERS MARKET, 2022-2032 ($MILLION)
- FIGURE 35. FRANCE AUTOMOTIVE TRACTION INVERTERS MARKET, 2022-2032 ($MILLION)
- FIGURE 36. SPAIN AUTOMOTIVE TRACTION INVERTERS MARKET, 2022-2032 ($MILLION)
- FIGURE 37. RUSSIA AUTOMOTIVE TRACTION INVERTERS MARKET, 2022-2032 ($MILLION)
- FIGURE 38. ITALY AUTOMOTIVE TRACTION INVERTERS MARKET, 2022-2032 ($MILLION)
- FIGURE 39. NETHERLANDS AUTOMOTIVE TRACTION INVERTERS MARKET, 2022-2032 ($MILLION)
- FIGURE 40. NORWAY AUTOMOTIVE TRACTION INVERTERS MARKET, 2022-2032 ($MILLION)
- FIGURE 41. REST OF EUROPE AUTOMOTIVE TRACTION INVERTERS MARKET, 2022-2032 ($MILLION)
- FIGURE 42. CHINA AUTOMOTIVE TRACTION INVERTERS MARKET, 2022-2032 ($MILLION)
- FIGURE 43. JAPAN AUTOMOTIVE TRACTION INVERTERS MARKET, 2022-2032 ($MILLION)
- FIGURE 44. INDIA AUTOMOTIVE TRACTION INVERTERS MARKET, 2022-2032 ($MILLION)
- FIGURE 45. AUSTRALIA AUTOMOTIVE TRACTION INVERTERS MARKET, 2022-2032 ($MILLION)
- FIGURE 46. SOUTH KOREA AUTOMOTIVE TRACTION INVERTERS MARKET, 2022-2032 ($MILLION)
- FIGURE 47. VIETNAM AUTOMOTIVE TRACTION INVERTERS MARKET, 2022-2032 ($MILLION)
- FIGURE 48. INDONESIA AUTOMOTIVE TRACTION INVERTERS MARKET, 2022-2032 ($MILLION)
- FIGURE 49. REST OF ASIA-PACIFIC AUTOMOTIVE TRACTION INVERTERS MARKET, 2022-2032 ($MILLION)
- FIGURE 50. LATIN AMERICA AUTOMOTIVE TRACTION INVERTERS MARKET, 2022-2032 ($MILLION)
- FIGURE 51. MIDDLE EAST AUTOMOTIVE TRACTION INVERTERS MARKET, 2022-2032 ($MILLION)
- FIGURE 52. AFRICA AUTOMOTIVE TRACTION INVERTERS MARKET, 2022-2032 ($MILLION)
- FIGURE 53. TOP WINNING STRATEGIES, BY YEAR
- FIGURE 54. TOP WINNING STRATEGIES, BY DEVELOPMENT
- FIGURE 55. TOP WINNING STRATEGIES, BY COMPANY
- FIGURE 56. PRODUCT MAPPING OF TOP 10 PLAYERS
- FIGURE 57. COMPETITIVE DASHBOARD
- FIGURE 58. COMPETITIVE HEATMAP: AUTOMOTIVE TRACTION INVERTERS MARKET
- FIGURE 59. TOP PLAYER POSITIONING, 2022
- FIGURE 60. BORGWARNER INC.: NET REVENUE, 2020-2022 ($MILLION)
- FIGURE 61. BORGWARNER INC.: RESEARCH & DEVELOPMENT EXPENDITURE, 2020-2022 ($MILLION)
- FIGURE 62. BORGWARNER INC.: REVENUE SHARE BY SEGMENT, 2022 (%)
- FIGURE 63. BORGWARNER INC.: REVENUE SHARE BY REGION, 2022 (%)
- FIGURE 64. DENSO CORPORATION: NET REVENUE, 2020-2022 ($MILLION)
- FIGURE 65. DENSO CORPORATION: RESEARCH & DEVELOPMENT EXPENDITURE, 2020-2022 ($MILLION)
- FIGURE 66. DENSO CORPORATION: REVENUE SHARE BY REGION, 2022 (%)
- FIGURE 67. DENSO CORPORATION: REVENUE SHARE BY SEGMENT, 2022 (%)
- FIGURE 68. EATON: NET SALES, 2020-2022 ($MILLION)
- FIGURE 69. EATON: RESEARCH & DEVELOPMENT EXPENDITURE, 2020-2022 ($MILLION)
- FIGURE 70. EATON: REVENUE SHARE BY REGION, 2022 (%)
- FIGURE 71. EATON: REVENUE SHARE BY SEGMENT, 2022 (%)
- FIGURE 72. HITACHI, LTD.: NET REVENUE, 2020-2022 ($MILLION)
- FIGURE 73. HITACHI, LTD.: REVENUE SHARE BY SEGMENT, 2022 (%)
- FIGURE 74. HITACHI, LTD.: REVENUE SHARE BY REGION, 2022 (%)
- FIGURE 75. MITSUBISHI ELECTRIC CORPORATION: NET SALES, 2020-2022 ($MILLION)
- FIGURE 76. MITSUBISHI ELECTRIC CORPORATION: RESEARCH & DEVELOPMENT EXPENDITURE, 2020-2022 ($MILLION)
- FIGURE 77. MITSUBISHI ELECTRIC CORPORATION: REVENUE SHARE BY SEGMENT, 2022 (%)
- FIGURE 78. MITSUBISHI ELECTRIC CORPORATION: REVENUE SHARE BY REGION, 2022 (%)
- FIGURE 79. ROBERT BOSCH GMBH: NET REVENUE, 2020-2022 ($MILLION)
- FIGURE 80. ROBERT BOSCH GMBH: RESEARCH & DEVELOPMENT EXPENDITURE, 2020-2022 ($MILLION)
- FIGURE 81. ROBERT BOSCH GMBH: REVENUE SHARE BY REGION, 2022 (%)
- FIGURE 82. ROBERT BOSCH GMBH: REVENUE SHARE BY SEGMENT, 2022 (%)
- FIGURE 83. TDK ELECTRONICS: NET SALES, 2020-2022 ($MILLION)
- FIGURE 84. TDK ELECTRONICS: NET SALES, 2020-2022 ($MILLION)
- FIGURE 85. VALEO SA: NET SALES, 2020-2022 ($MILLION)
- FIGURE 86. VALEO SA: RESEARCH & DEVELOPMENT EXPENDITURE, 2020-2022 ($MILLION)
- FIGURE 87. VALEO SA: REVENUE SHARE BY REGION, 2022 (%)
- FIGURE 88. VALEO SA: REVENUE SHARE BY SEGMENT, 2022 (%)
- FIGURE 89. VITESCO TECHNOLOGIES GROUP AKTIENGESELLSCHAFT: NET REVENUE, 2020-2022 ($MILLION)
- FIGURE 90. VITESCO TECHNOLOGIES GROUP AKTIENGESELLSCHAFT: RESEARCH & DEVELOPMENT EXPENDITURE, 2020-2022 ($MILLI
- FIGURE 91. VITESCO TECHNOLOGIES GROUP AKTIENGESELLSCHAFT: REVENUE SHARE BY SEGMENT, 2022 (%)
- FIGURE 92. VITESCO TECHNOLOGIES GROUP AKTIENGESELLSCHAFT: REVENUE SHARE BY REGION, 2022 (%)
- FIGURE 93. CURTISS-WRIGHT CORPORATION: NET SALES, 2020-2022 ($MILLION)
- FIGURE 94. CURTISS-WRIGHT CORPORATION: REVENUE SHARE BY SEGMENT, 2021 (%)
- FIGURE 95. CURTISS-WRIGHT CORPORATION: REVENUE SHARE BY REGION, 2022 (%)

