
PUBLISHER: Allied Market Research | PRODUCT CODE: 1365642

PUBLISHER: Allied Market Research | PRODUCT CODE: 1365642
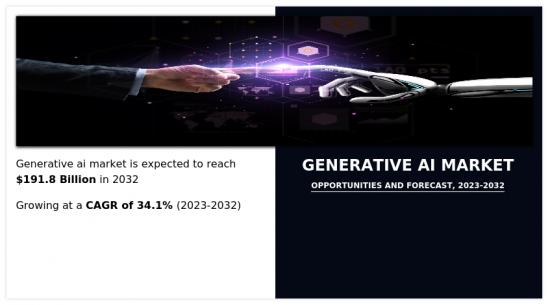
Generative AI Market By Component, By Technology (Generative Adversarial Networks, Transformer, Variational Autoencoder, Diffusion Networks, Retrieval Augmented Generation), By End User : Global Opportunity Analysis and Industry Forecast, 2023-2032
According to a new report published by Allied Market Research, titled, "Generative AI Market," The generative ai market was valued at $8.15 billion in 2021, and is estimated to reach $126.5 billion by 2031, growing at a CAGR of 32% from 2022 to 2031.
The generative AI market has experienced significant growth due to the advancements in deep learning. Generative models are type of machine learning that uses AI, probability, and statistics to produce a computer-generated representation of a targeted variable calculated from prior observations, input, or datasets. These improvements make deep learning models more intelligent and capable, enabling them to perform complex tasks such as image recognition, language translation, and content generation more accurately and effectively. In addition, the rise of generative AI is driven by the desire to provide users and consumers with more personalized, engaging and relevant content and experiences, have further fueled the market growth. However, ethical and privacy concerns pose significant challenges and barriers to the development and adoption of generative AI technologies, with one major concern being the creation of false content. These realistic-looking images or videos can mislead people into believing that things never happened. This can lead to the spread and manipulation of disinformation, which is harmful to individuals and society. On the contrary, the demand for generative AI applications in industries such as entertainment, healthcare, engineering, finance, and defense is driven by the growing use of innovative solutions such as super-resolution, text-to-image conversion, and text-to-video conversion. Moreover, the growing application of artificial intelligence is a result of its increased computing power and ability to solve problems in different industrial sectors. Expanding into these industries will provide major lucrative opportunities for the growth of the generative AI market.
The generative AI market is segmented on the basis of component, technology, end user, and region. On the basis of component, the market is bifurcated into software and services. By technology, it is segmented into generative adversarial networks (GANs), transformer, variational autoencoder (VAE), diffusion networks, and retrieval augmented generation. On the basis of end user, it is classified into media & entertainment, BFSI, IT & telecom, healthcare, automotive & transportation, and others. On the basis of region, it is analyzed across North America, Europe, Asia-Pacific, and LAMEA.
The report analyzes the profiles of key players operating in the generative AI market such as Adobe, Inc., Amazon Web Services, Inc., D-ID, Genie AI Ltd., Google LLC, IBM Corporation, Microsoft Corporation, MOSTLY AI Inc., Rephrase.ai and Synthesia. These players have adopted various strategies to increase their market penetration and strengthen their position in the generative AI market.
Key Benefits for Stakeholders
- The study provides in-depth analysis of the global generative AI market along with the current & future trends to illustrate the imminent investment pockets.
- Information about key drivers, restrains, & opportunities and their impact analysis on the global generative AI market size are provided in the report.
- Porter's five forces analysis illustrates the potency of buyers and suppliers operating in the industry.
- The quantitative analysis of the global generative AI market from 2022 to 2032 is provided to determine the market potential.
Additional benefits you will get with this purchase are:
- Quarterly Update and* (only available with a corporate license, on listed price)
- 5 additional Company Profile of client Choice pre- or Post-purchase, as a free update.
- Free Upcoming Version on the Purchase of Five and Enterprise User License.
- 16 analyst hours of support* (post-purchase, if you find additional data requirements upon review of the report, you may receive support amounting to 16 analyst hours to solve questions, and post-sale queries)
- 15% Free Customization* (in case the scope or segment of the report does not match your requirements, 20% is equivalent to 3 working days of free work, applicable once)
- Free data Pack on the Five and Enterprise User License. (Excel version of the report)
- Free Updated report if the report is 6-12 months old or older.
- 24-hour priority response*
- Free Industry updates and white papers.
Possible Customization with this report (with additional cost and timeline talk to the sales executive to know more)
- Investment Opportunities
- Market share analysis of players by products/segments
- Regulatory Guidelines
- Additional company profiles with specific to client's interest
- Additional country or region analysis- market size and forecast
- Market share analysis of players at global/region/country level
- SWOT Analysis
Key Market Segments
By Component
- Software
- Service
By Technology
- Generative Adversarial Networks (GANs)
- Transformer
- Variational Autoencoder (VAE)
- Diffusion Networks
- Retrieval Augmented Generation
By End User
- Media and Entertainment
- BFSI
- IT and Telecom
- Healthcare
- Automotive and Transportation
- Others
By Region
- North America
- U.S.
- Canada
- Europe
- UK
- Germany
- France
- Italy
- Spain
- Rest of Europe
- Asia-Pacific
- China
- Japan
- India
- Australia
- South Korea
- Rest of Asia-Pacific
- LAMEA
- Latin America
- Middle East
- Africa
Key Market Players:
- Adobe.
- Amazon Web Services, Inc.
- D-ID
- Genie AI Ltd.
- Google LLC
- IBM Corporation
- Microsoft Corporation
- MOSTLY AI Inc.
- Rephrase.ai
- Synthesia
TABLE OF CONTENTS
CHAPTER 1: INTRODUCTION
- 1.1. Report description
- 1.2. Key market segments
- 1.3. Key benefits to the stakeholders
- 1.4. Research Methodology
- 1.4.1. Primary research
- 1.4.2. Secondary research
- 1.4.3. Analyst tools and models
CHAPTER 2: EXECUTIVE SUMMARY
- 2.1. CXO Perspective
CHAPTER 3: MARKET OVERVIEW
- 3.1. Market definition and scope
- 3.2. Key findings
- 3.2.1. Top impacting factors
- 3.2.2. Top investment pockets
- 3.3. Porter's five forces analysis
- 3.3.1. High to moderate bargaining power of suppliers
- 3.3.2. High to moderate threat of new entrants
- 3.3.3. Moderate to high threat of substitutes
- 3.3.4. High to moderate intensity of rivalry
- 3.3.5. High o moderate bargaining power of buyers
- 3.4. Market dynamics
- 3.4.1. Drivers
- 3.4.1.1. Advancements in deep learning
- 3.4.1.2. Growing demand for AI-generated content
- 3.4.1.3. Personalization and customization needs
- 3.4.1. Drivers
- 3.4.2. Restraints
- 3.4.2.1. Ethical and privacy concerns
- 3.4.2.2. High computational complexity
- 3.4.3. Opportunities
- 3.4.3.1. Integration of generative AI in industry-specific applications
- 3.5. COVID-19 Impact Analysis on the market
CHAPTER 4: GENERATIVE AI MARKET, BY COMPONENT
- 4.1. Overview
- 4.1.1. Market size and forecast
- 4.2. Software
- 4.2.1. Key market trends, growth factors and opportunities
- 4.2.2. Market size and forecast, by region
- 4.2.3. Market share analysis by country
- 4.3. Service
- 4.3.1. Key market trends, growth factors and opportunities
- 4.3.2. Market size and forecast, by region
- 4.3.3. Market share analysis by country
CHAPTER 5: GENERATIVE AI MARKET, BY TECHNOLOGY
- 5.1. Overview
- 5.1.1. Market size and forecast
- 5.2. Generative Adversarial Networks (GANs)
- 5.2.1. Key market trends, growth factors and opportunities
- 5.2.2. Market size and forecast, by region
- 5.2.3. Market share analysis by country
- 5.3. Transformer
- 5.3.1. Key market trends, growth factors and opportunities
- 5.3.2. Market size and forecast, by region
- 5.3.3. Market share analysis by country
- 5.4. Variational Autoencoder (VAE)
- 5.4.1. Key market trends, growth factors and opportunities
- 5.4.2. Market size and forecast, by region
- 5.4.3. Market share analysis by country
- 5.5. Diffusion Networks
- 5.5.1. Key market trends, growth factors and opportunities
- 5.5.2. Market size and forecast, by region
- 5.5.3. Market share analysis by country
- 5.6. Retrieval Augmented Generation
- 5.6.1. Key market trends, growth factors and opportunities
- 5.6.2. Market size and forecast, by region
- 5.6.3. Market share analysis by country
CHAPTER 6: GENERATIVE AI MARKET, BY END USER
- 6.1. Overview
- 6.1.1. Market size and forecast
- 6.2. Media and Entertainment
- 6.2.1. Key market trends, growth factors and opportunities
- 6.2.2. Market size and forecast, by region
- 6.2.3. Market share analysis by country
- 6.3. BFSI
- 6.3.1. Key market trends, growth factors and opportunities
- 6.3.2. Market size and forecast, by region
- 6.3.3. Market share analysis by country
- 6.4. IT and Telecom
- 6.4.1. Key market trends, growth factors and opportunities
- 6.4.2. Market size and forecast, by region
- 6.4.3. Market share analysis by country
- 6.5. Healthcare
- 6.5.1. Key market trends, growth factors and opportunities
- 6.5.2. Market size and forecast, by region
- 6.5.3. Market share analysis by country
- 6.6. Automotive and Transportation
- 6.6.1. Key market trends, growth factors and opportunities
- 6.6.2. Market size and forecast, by region
- 6.6.3. Market share analysis by country
- 6.7. Others
- 6.7.1. Key market trends, growth factors and opportunities
- 6.7.2. Market size and forecast, by region
- 6.7.3. Market share analysis by country
CHAPTER 7: GENERATIVE AI MARKET, BY REGION
- 7.1. Overview
- 7.1.1. Market size and forecast By Region
- 7.2. North America
- 7.2.1. Key trends and opportunities
- 7.2.2. Market size and forecast, by Component
- 7.2.3. Market size and forecast, by Technology
- 7.2.4. Market size and forecast, by End User
- 7.2.5. Market size and forecast, by country
- 7.2.5.1. U.S.
- 7.2.5.1.1. Key market trends, growth factors and opportunities
- 7.2.5.1.2. Market size and forecast, by Component
- 7.2.5.1.3. Market size and forecast, by Technology
- 7.2.5.1.4. Market size and forecast, by End User
- 7.2.5.2. Canada
- 7.2.5.2.1. Key market trends, growth factors and opportunities
- 7.2.5.2.2. Market size and forecast, by Component
- 7.2.5.2.3. Market size and forecast, by Technology
- 7.2.5.2.4. Market size and forecast, by End User
- 7.3. Europe
- 7.3.1. Key trends and opportunities
- 7.3.2. Market size and forecast, by Component
- 7.3.3. Market size and forecast, by Technology
- 7.3.4. Market size and forecast, by End User
- 7.3.5. Market size and forecast, by country
- 7.3.5.1. UK
- 7.3.5.1.1. Key market trends, growth factors and opportunities
- 7.3.5.1.2. Market size and forecast, by Component
- 7.3.5.1.3. Market size and forecast, by Technology
- 7.3.5.1.4. Market size and forecast, by End User
- 7.3.5.2. Germany
- 7.3.5.2.1. Key market trends, growth factors and opportunities
- 7.3.5.2.2. Market size and forecast, by Component
- 7.3.5.2.3. Market size and forecast, by Technology
- 7.3.5.2.4. Market size and forecast, by End User
- 7.3.5.3. France
- 7.3.5.3.1. Key market trends, growth factors and opportunities
- 7.3.5.3.2. Market size and forecast, by Component
- 7.3.5.3.3. Market size and forecast, by Technology
- 7.3.5.3.4. Market size and forecast, by End User
- 7.3.5.4. Italy
- 7.3.5.4.1. Key market trends, growth factors and opportunities
- 7.3.5.4.2. Market size and forecast, by Component
- 7.3.5.4.3. Market size and forecast, by Technology
- 7.3.5.4.4. Market size and forecast, by End User
- 7.3.5.5. Spain
- 7.3.5.5.1. Key market trends, growth factors and opportunities
- 7.3.5.5.2. Market size and forecast, by Component
- 7.3.5.5.3. Market size and forecast, by Technology
- 7.3.5.5.4. Market size and forecast, by End User
- 7.3.5.6. Rest of Europe
- 7.3.5.6.1. Key market trends, growth factors and opportunities
- 7.3.5.6.2. Market size and forecast, by Component
- 7.3.5.6.3. Market size and forecast, by Technology
- 7.3.5.6.4. Market size and forecast, by End User
- 7.4. Asia-Pacific
- 7.4.1. Key trends and opportunities
- 7.4.2. Market size and forecast, by Component
- 7.4.3. Market size and forecast, by Technology
- 7.4.4. Market size and forecast, by End User
- 7.4.5. Market size and forecast, by country
- 7.4.5.1. China
- 7.4.5.1.1. Key market trends, growth factors and opportunities
- 7.4.5.1.2. Market size and forecast, by Component
- 7.4.5.1.3. Market size and forecast, by Technology
- 7.4.5.1.4. Market size and forecast, by End User
- 7.4.5.2. Japan
- 7.4.5.2.1. Key market trends, growth factors and opportunities
- 7.4.5.2.2. Market size and forecast, by Component
- 7.4.5.2.3. Market size and forecast, by Technology
- 7.4.5.2.4. Market size and forecast, by End User
- 7.4.5.3. India
- 7.4.5.3.1. Key market trends, growth factors and opportunities
- 7.4.5.3.2. Market size and forecast, by Component
- 7.4.5.3.3. Market size and forecast, by Technology
- 7.4.5.3.4. Market size and forecast, by End User
- 7.4.5.4. Australia
- 7.4.5.4.1. Key market trends, growth factors and opportunities
- 7.4.5.4.2. Market size and forecast, by Component
- 7.4.5.4.3. Market size and forecast, by Technology
- 7.4.5.4.4. Market size and forecast, by End User
- 7.4.5.5. South Korea
- 7.4.5.5.1. Key market trends, growth factors and opportunities
- 7.4.5.5.2. Market size and forecast, by Component
- 7.4.5.5.3. Market size and forecast, by Technology
- 7.4.5.5.4. Market size and forecast, by End User
- 7.4.5.6. Rest of Asia-Pacific
- 7.4.5.6.1. Key market trends, growth factors and opportunities
- 7.4.5.6.2. Market size and forecast, by Component
- 7.4.5.6.3. Market size and forecast, by Technology
- 7.4.5.6.4. Market size and forecast, by End User
- 7.5. LAMEA
- 7.5.1. Key trends and opportunities
- 7.5.2. Market size and forecast, by Component
- 7.5.3. Market size and forecast, by Technology
- 7.5.4. Market size and forecast, by End User
- 7.5.5. Market size and forecast, by country
- 7.5.5.1. Latin America
- 7.5.5.1.1. Key market trends, growth factors and opportunities
- 7.5.5.1.2. Market size and forecast, by Component
- 7.5.5.1.3. Market size and forecast, by Technology
- 7.5.5.1.4. Market size and forecast, by End User
- 7.5.5.2. Middle East
- 7.5.5.2.1. Key market trends, growth factors and opportunities
- 7.5.5.2.2. Market size and forecast, by Component
- 7.5.5.2.3. Market size and forecast, by Technology
- 7.5.5.2.4. Market size and forecast, by End User
- 7.5.5.3. Africa
- 7.5.5.3.1. Key market trends, growth factors and opportunities
- 7.5.5.3.2. Market size and forecast, by Component
- 7.5.5.3.3. Market size and forecast, by Technology
- 7.5.5.3.4. Market size and forecast, by End User
CHAPTER 8: COMPETITIVE LANDSCAPE
- 8.1. Introduction
- 8.2. Top winning strategies
- 8.3. Product Mapping of Top 10 Player
- 8.4. Competitive Dashboard
- 8.5. Competitive Heatmap
- 8.6. Top player positioning, 2022
CHAPTER 9: COMPANY PROFILES
- 9.1. IBM Corporation
- 9.1.1. Company overview
- 9.1.2. Key Executives
- 9.1.3. Company snapshot
- 9.1.4. Operating business segments
- 9.1.5. Product portfolio
- 9.1.6. Business performance
- 9.1.7. Key strategic moves and developments
- 9.2. Genie AI Ltd.
- 9.2.1. Company overview
- 9.2.2. Key Executives
- 9.2.3. Company snapshot
- 9.2.4. Operating business segments
- 9.2.5. Product portfolio
- 9.2.6. Key strategic moves and developments
- 9.3. MOSTLY AI Inc.
- 9.3.1. Company overview
- 9.3.2. Key Executives
- 9.3.3. Company snapshot
- 9.3.4. Operating business segments
- 9.3.5. Product portfolio
- 9.3.6. Key strategic moves and developments
- 9.4. Google LLC
- 9.4.1. Company overview
- 9.4.2. Key Executives
- 9.4.3. Company snapshot
- 9.4.4. Operating business segments
- 9.4.5. Product portfolio
- 9.4.6. Business performance
- 9.4.7. Key strategic moves and developments
- 9.5. D-ID
- 9.5.1. Company overview
- 9.5.2. Key Executives
- 9.5.3. Company snapshot
- 9.5.4. Operating business segments
- 9.5.5. Product portfolio
- 9.5.6. Key strategic moves and developments
- 9.6. Rephrase.ai
- 9.6.1. Company overview
- 9.6.2. Key Executives
- 9.6.3. Company snapshot
- 9.6.4. Operating business segments
- 9.6.5. Product portfolio
- 9.6.6. Key strategic moves and developments
- 9.7. Amazon Web Services, Inc.
- 9.7.1. Company overview
- 9.7.2. Key Executives
- 9.7.3. Company snapshot
- 9.7.4. Operating business segments
- 9.7.5. Product portfolio
- 9.7.6. Business performance
- 9.7.7. Key strategic moves and developments
- 9.8. Microsoft Corporation
- 9.8.1. Company overview
- 9.8.2. Key Executives
- 9.8.3. Company snapshot
- 9.8.4. Operating business segments
- 9.8.5. Product portfolio
- 9.8.6. Business performance
- 9.8.7. Key strategic moves and developments
- 9.9. Adobe.
- 9.9.1. Company overview
- 9.9.2. Key Executives
- 9.9.3. Company snapshot
- 9.9.4. Operating business segments
- 9.9.5. Product portfolio
- 9.9.6. Business performance
- 9.9.7. Key strategic moves and developments
- 9.10. Synthesia
- 9.10.1. Company overview
- 9.10.2. Key Executives
- 9.10.3. Company snapshot
- 9.10.4. Operating business segments
- 9.10.5. Product portfolio
- 9.10.6. Key strategic moves and developments
LIST OF TABLES
- TABLE 01. GLOBAL GENERATIVE AI MARKET, BY COMPONENT, 2022-2032 ($MILLION)
- TABLE 02. GENERATIVE AI MARKET FOR SOFTWARE, BY REGION, 2022-2032 ($MILLION)
- TABLE 03. GENERATIVE AI MARKET FOR SERVICE, BY REGION, 2022-2032 ($MILLION)
- TABLE 04. GLOBAL GENERATIVE AI MARKET, BY TECHNOLOGY, 2022-2032 ($MILLION)
- TABLE 05. GENERATIVE AI MARKET FOR GENERATIVE ADVERSARIAL NETWORKS (GANS), BY REGION, 2022-2032 ($MILLION)
- TABLE 06. GENERATIVE AI MARKET FOR TRANSFORMER, BY REGION, 2022-2032 ($MILLION)
- TABLE 07. GENERATIVE AI MARKET FOR VARIATIONAL AUTOENCODER (VAE), BY REGION, 2022-2032 ($MILLION)
- TABLE 08. GENERATIVE AI MARKET FOR DIFFUSION NETWORKS, BY REGION, 2022-2032 ($MILLION)
- TABLE 09. GENERATIVE AI MARKET FOR RETRIEVAL AUGMENTED GENERATION, BY REGION, 2022-2032 ($MILLION)
- TABLE 10. GLOBAL GENERATIVE AI MARKET, BY END USER, 2022-2032 ($MILLION)
- TABLE 11. GENERATIVE AI MARKET FOR MEDIA AND ENTERTAINMENT, BY REGION, 2022-2032 ($MILLION)
- TABLE 12. GENERATIVE AI MARKET FOR BFSI, BY REGION, 2022-2032 ($MILLION)
- TABLE 13. GENERATIVE AI MARKET FOR IT AND TELECOM, BY REGION, 2022-2032 ($MILLION)
- TABLE 14. GENERATIVE AI MARKET FOR HEALTHCARE, BY REGION, 2022-2032 ($MILLION)
- TABLE 15. GENERATIVE AI MARKET FOR AUTOMOTIVE AND TRANSPORTATION, BY REGION, 2022-2032 ($MILLION)
- TABLE 16. GENERATIVE AI MARKET FOR OTHERS, BY REGION, 2022-2032 ($MILLION)
- TABLE 17. GENERATIVE AI MARKET, BY REGION, 2022-2032 ($MILLION)
- TABLE 18. NORTH AMERICA GENERATIVE AI MARKET, BY COMPONENT, 2022-2032 ($MILLION)
- TABLE 19. NORTH AMERICA GENERATIVE AI MARKET, BY TECHNOLOGY, 2022-2032 ($MILLION)
- TABLE 20. NORTH AMERICA GENERATIVE AI MARKET, BY END USER, 2022-2032 ($MILLION)
- TABLE 21. NORTH AMERICA GENERATIVE AI MARKET, BY COUNTRY, 2022-2032 ($MILLION)
- TABLE 22. U.S. GENERATIVE AI MARKET, BY COMPONENT, 2022-2032 ($MILLION)
- TABLE 23. U.S. GENERATIVE AI MARKET, BY TECHNOLOGY, 2022-2032 ($MILLION)
- TABLE 24. U.S. GENERATIVE AI MARKET, BY END USER, 2022-2032 ($MILLION)
- TABLE 25. CANADA GENERATIVE AI MARKET, BY COMPONENT, 2022-2032 ($MILLION)
- TABLE 26. CANADA GENERATIVE AI MARKET, BY TECHNOLOGY, 2022-2032 ($MILLION)
- TABLE 27. CANADA GENERATIVE AI MARKET, BY END USER, 2022-2032 ($MILLION)
- TABLE 28. EUROPE GENERATIVE AI MARKET, BY COMPONENT, 2022-2032 ($MILLION)
- TABLE 29. EUROPE GENERATIVE AI MARKET, BY TECHNOLOGY, 2022-2032 ($MILLION)
- TABLE 30. EUROPE GENERATIVE AI MARKET, BY END USER, 2022-2032 ($MILLION)
- TABLE 31. EUROPE GENERATIVE AI MARKET, BY COUNTRY, 2022-2032 ($MILLION)
- TABLE 32. UK GENERATIVE AI MARKET, BY COMPONENT, 2022-2032 ($MILLION)
- TABLE 33. UK GENERATIVE AI MARKET, BY TECHNOLOGY, 2022-2032 ($MILLION)
- TABLE 34. UK GENERATIVE AI MARKET, BY END USER, 2022-2032 ($MILLION)
- TABLE 35. GERMANY GENERATIVE AI MARKET, BY COMPONENT, 2022-2032 ($MILLION)
- TABLE 36. GERMANY GENERATIVE AI MARKET, BY TECHNOLOGY, 2022-2032 ($MILLION)
- TABLE 37. GERMANY GENERATIVE AI MARKET, BY END USER, 2022-2032 ($MILLION)
- TABLE 38. FRANCE GENERATIVE AI MARKET, BY COMPONENT, 2022-2032 ($MILLION)
- TABLE 39. FRANCE GENERATIVE AI MARKET, BY TECHNOLOGY, 2022-2032 ($MILLION)
- TABLE 40. FRANCE GENERATIVE AI MARKET, BY END USER, 2022-2032 ($MILLION)
- TABLE 41. ITALY GENERATIVE AI MARKET, BY COMPONENT, 2022-2032 ($MILLION)
- TABLE 42. ITALY GENERATIVE AI MARKET, BY TECHNOLOGY, 2022-2032 ($MILLION)
- TABLE 43. ITALY GENERATIVE AI MARKET, BY END USER, 2022-2032 ($MILLION)
- TABLE 44. SPAIN GENERATIVE AI MARKET, BY COMPONENT, 2022-2032 ($MILLION)
- TABLE 45. SPAIN GENERATIVE AI MARKET, BY TECHNOLOGY, 2022-2032 ($MILLION)
- TABLE 46. SPAIN GENERATIVE AI MARKET, BY END USER, 2022-2032 ($MILLION)
- TABLE 47. REST OF EUROPE GENERATIVE AI MARKET, BY COMPONENT, 2022-2032 ($MILLION)
- TABLE 48. REST OF EUROPE GENERATIVE AI MARKET, BY TECHNOLOGY, 2022-2032 ($MILLION)
- TABLE 49. REST OF EUROPE GENERATIVE AI MARKET, BY END USER, 2022-2032 ($MILLION)
- TABLE 50. ASIA-PACIFIC GENERATIVE AI MARKET, BY COMPONENT, 2022-2032 ($MILLION)
- TABLE 51. ASIA-PACIFIC GENERATIVE AI MARKET, BY TECHNOLOGY, 2022-2032 ($MILLION)
- TABLE 52. ASIA-PACIFIC GENERATIVE AI MARKET, BY END USER, 2022-2032 ($MILLION)
- TABLE 53. ASIA-PACIFIC GENERATIVE AI MARKET, BY COUNTRY, 2022-2032 ($MILLION)
- TABLE 54. CHINA GENERATIVE AI MARKET, BY COMPONENT, 2022-2032 ($MILLION)
- TABLE 55. CHINA GENERATIVE AI MARKET, BY TECHNOLOGY, 2022-2032 ($MILLION)
- TABLE 56. CHINA GENERATIVE AI MARKET, BY END USER, 2022-2032 ($MILLION)
- TABLE 57. JAPAN GENERATIVE AI MARKET, BY COMPONENT, 2022-2032 ($MILLION)
- TABLE 58. JAPAN GENERATIVE AI MARKET, BY TECHNOLOGY, 2022-2032 ($MILLION)
- TABLE 59. JAPAN GENERATIVE AI MARKET, BY END USER, 2022-2032 ($MILLION)
- TABLE 60. INDIA GENERATIVE AI MARKET, BY COMPONENT, 2022-2032 ($MILLION)
- TABLE 61. INDIA GENERATIVE AI MARKET, BY TECHNOLOGY, 2022-2032 ($MILLION)
- TABLE 62. INDIA GENERATIVE AI MARKET, BY END USER, 2022-2032 ($MILLION)
- TABLE 63. AUSTRALIA GENERATIVE AI MARKET, BY COMPONENT, 2022-2032 ($MILLION)
- TABLE 64. AUSTRALIA GENERATIVE AI MARKET, BY TECHNOLOGY, 2022-2032 ($MILLION)
- TABLE 65. AUSTRALIA GENERATIVE AI MARKET, BY END USER, 2022-2032 ($MILLION)
- TABLE 66. SOUTH KOREA GENERATIVE AI MARKET, BY COMPONENT, 2022-2032 ($MILLION)
- TABLE 67. SOUTH KOREA GENERATIVE AI MARKET, BY TECHNOLOGY, 2022-2032 ($MILLION)
- TABLE 68. SOUTH KOREA GENERATIVE AI MARKET, BY END USER, 2022-2032 ($MILLION)
- TABLE 69. REST OF ASIA-PACIFIC GENERATIVE AI MARKET, BY COMPONENT, 2022-2032 ($MILLION)
- TABLE 70. REST OF ASIA-PACIFIC GENERATIVE AI MARKET, BY TECHNOLOGY, 2022-2032 ($MILLION)
- TABLE 71. REST OF ASIA-PACIFIC GENERATIVE AI MARKET, BY END USER, 2022-2032 ($MILLION)
- TABLE 72. LAMEA GENERATIVE AI MARKET, BY COMPONENT, 2022-2032 ($MILLION)
- TABLE 73. LAMEA GENERATIVE AI MARKET, BY TECHNOLOGY, 2022-2032 ($MILLION)
- TABLE 74. LAMEA GENERATIVE AI MARKET, BY END USER, 2022-2032 ($MILLION)
- TABLE 75. LAMEA GENERATIVE AI MARKET, BY COUNTRY, 2022-2032 ($MILLION)
- TABLE 76. LATIN AMERICA GENERATIVE AI MARKET, BY COMPONENT, 2022-2032 ($MILLION)
- TABLE 77. LATIN AMERICA GENERATIVE AI MARKET, BY TECHNOLOGY, 2022-2032 ($MILLION)
- TABLE 78. LATIN AMERICA GENERATIVE AI MARKET, BY END USER, 2022-2032 ($MILLION)
- TABLE 79. MIDDLE EAST GENERATIVE AI MARKET, BY COMPONENT, 2022-2032 ($MILLION)
- TABLE 80. MIDDLE EAST GENERATIVE AI MARKET, BY TECHNOLOGY, 2022-2032 ($MILLION)
- TABLE 81. MIDDLE EAST GENERATIVE AI MARKET, BY END USER, 2022-2032 ($MILLION)
- TABLE 82. AFRICA GENERATIVE AI MARKET, BY COMPONENT, 2022-2032 ($MILLION)
- TABLE 83. AFRICA GENERATIVE AI MARKET, BY TECHNOLOGY, 2022-2032 ($MILLION)
- TABLE 84. AFRICA GENERATIVE AI MARKET, BY END USER, 2022-2032 ($MILLION)
- TABLE 85. IBM CORPORATION: KEY EXECUTIVES
- TABLE 86. IBM CORPORATION: COMPANY SNAPSHOT
- TABLE 87. IBM CORPORATION: SERVICE SEGMENTS
- TABLE 88. IBM CORPORATION: PRODUCT PORTFOLIO
- TABLE 89. IBM CORPORATION: KEY STRATERGIES
- TABLE 90. GENIE AI LTD.: KEY EXECUTIVES
- TABLE 91. GENIE AI LTD.: COMPANY SNAPSHOT
- TABLE 92. GENIE AI LTD.: SERVICE SEGMENTS
- TABLE 93. GENIE AI LTD.: PRODUCT PORTFOLIO
- TABLE 94. GENIE AI LTD.: KEY STRATERGIES
- TABLE 95. MOSTLY AI INC.: KEY EXECUTIVES
- TABLE 96. MOSTLY AI INC.: COMPANY SNAPSHOT
- TABLE 97. MOSTLY AI INC.: SERVICE SEGMENTS
- TABLE 98. MOSTLY AI INC.: PRODUCT PORTFOLIO
- TABLE 99. MOSTLY AI INC.: KEY STRATERGIES
- TABLE 100. GOOGLE LLC: KEY EXECUTIVES
- TABLE 101. GOOGLE LLC: COMPANY SNAPSHOT
- TABLE 102. GOOGLE LLC: SERVICE SEGMENTS
- TABLE 103. GOOGLE LLC: PRODUCT PORTFOLIO
- TABLE 104. GOOGLE LLC: KEY STRATERGIES
- TABLE 105. D-ID: KEY EXECUTIVES
- TABLE 106. D-ID: COMPANY SNAPSHOT
- TABLE 107. D-ID: SERVICE SEGMENTS
- TABLE 108. D-ID: PRODUCT PORTFOLIO
- TABLE 109. D-ID: KEY STRATERGIES
- TABLE 110. REPHRASE.AI: KEY EXECUTIVES
- TABLE 111. REPHRASE.AI: COMPANY SNAPSHOT
- TABLE 112. REPHRASE.AI: SERVICE SEGMENTS
- TABLE 113. REPHRASE.AI: PRODUCT PORTFOLIO
- TABLE 114. REPHRASE.AI: KEY STRATERGIES
- TABLE 115. AMAZON WEB SERVICES, INC.: KEY EXECUTIVES
- TABLE 116. AMAZON WEB SERVICES, INC.: COMPANY SNAPSHOT
- TABLE 117. AMAZON WEB SERVICES, INC.: SERVICE SEGMENTS
- TABLE 118. AMAZON WEB SERVICES, INC.: PRODUCT PORTFOLIO
- TABLE 119. AMAZON WEB SERVICES, INC.: KEY STRATERGIES
- TABLE 120. MICROSOFT CORPORATION: KEY EXECUTIVES
- TABLE 121. MICROSOFT CORPORATION: COMPANY SNAPSHOT
- TABLE 122. MICROSOFT CORPORATION: SERVICE SEGMENTS
- TABLE 123. MICROSOFT CORPORATION: PRODUCT PORTFOLIO
- TABLE 124. MICROSOFT CORPORATION: KEY STRATERGIES
- TABLE 125. ADOBE.: KEY EXECUTIVES
- TABLE 126. ADOBE.: COMPANY SNAPSHOT
- TABLE 127. ADOBE.: SERVICE SEGMENTS
- TABLE 128. ADOBE.: PRODUCT PORTFOLIO
- TABLE 129. ADOBE.: KEY STRATERGIES
- TABLE 130. SYNTHESIA: KEY EXECUTIVES
- TABLE 131. SYNTHESIA: COMPANY SNAPSHOT
- TABLE 132. SYNTHESIA: SERVICE SEGMENTS
- TABLE 133. SYNTHESIA: PRODUCT PORTFOLIO
- TABLE 134. SYNTHESIA: KEY STRATERGIES
LIST OF FIGURES
- FIGURE 01. GENERATIVE AI MARKET, 2022-2032
- FIGURE 02. SEGMENTATION OF GENERATIVE AI MARKET, 2022-2032
- FIGURE 03. GENERATIVE AI MARKET,2022-2032
- FIGURE 04. TOP INVESTMENT POCKETS IN GENERATIVE AI MARKET (2023-2032)
- FIGURE 05. HIGH TO MODERATE BARGAINING POWER OF SUPPLIERS
- FIGURE 06. HIGH TO MODERATE THREAT OF NEW ENTRANTS
- FIGURE 07. MODERATE TO HIGH THREAT OF SUBSTITUTES
- FIGURE 08. HIGH TO MODERATE INTENSITY OF RIVALRY
- FIGURE 09. HIGH O MODERATE BARGAINING POWER OF BUYERS
- FIGURE 10. GLOBAL GENERATIVE AI MARKET:DRIVERS, RESTRAINTS AND OPPORTUNITIES
- FIGURE 11. GENERATIVE AI MARKET, BY COMPONENT, 2022(%)
- FIGURE 12. COMPARATIVE SHARE ANALYSIS OF GENERATIVE AI MARKET FOR SOFTWARE, BY COUNTRY 2022-2032(%)
- FIGURE 13. COMPARATIVE SHARE ANALYSIS OF GENERATIVE AI MARKET FOR SERVICE, BY COUNTRY 2022-2032(%)
- FIGURE 14. GENERATIVE AI MARKET, BY TECHNOLOGY, 2022(%)
- FIGURE 15. COMPARATIVE SHARE ANALYSIS OF GENERATIVE AI MARKET FOR GENERATIVE ADVERSARIAL NETWORKS (GANS), BY COUNTRY 2022-2032(%)
- FIGURE 16. COMPARATIVE SHARE ANALYSIS OF GENERATIVE AI MARKET FOR TRANSFORMER, BY COUNTRY 2022-2032(%)
- FIGURE 17. COMPARATIVE SHARE ANALYSIS OF GENERATIVE AI MARKET FOR VARIATIONAL AUTOENCODER (VAE), BY COUNTRY 2022-2032(%)
- FIGURE 18. COMPARATIVE SHARE ANALYSIS OF GENERATIVE AI MARKET FOR DIFFUSION NETWORKS, BY COUNTRY 2022-2032(%)
- FIGURE 19. COMPARATIVE SHARE ANALYSIS OF GENERATIVE AI MARKET FOR RETRIEVAL AUGMENTED GENERATION, BY COUNTRY 2022-2032(%)
- FIGURE 20. GENERATIVE AI MARKET, BY END USER, 2022(%)
- FIGURE 21. COMPARATIVE SHARE ANALYSIS OF GENERATIVE AI MARKET FOR MEDIA AND ENTERTAINMENT, BY COUNTRY 2022-2032(%)
- FIGURE 22. COMPARATIVE SHARE ANALYSIS OF GENERATIVE AI MARKET FOR BFSI, BY COUNTRY 2022-2032(%)
- FIGURE 23. COMPARATIVE SHARE ANALYSIS OF GENERATIVE AI MARKET FOR IT AND TELECOM, BY COUNTRY 2022-2032(%)
- FIGURE 24. COMPARATIVE SHARE ANALYSIS OF GENERATIVE AI MARKET FOR HEALTHCARE, BY COUNTRY 2022-2032(%)
- FIGURE 25. COMPARATIVE SHARE ANALYSIS OF GENERATIVE AI MARKET FOR AUTOMOTIVE AND TRANSPORTATION, BY COUNTRY 2022-2032(%)
- FIGURE 26. COMPARATIVE SHARE ANALYSIS OF GENERATIVE AI MARKET FOR OTHERS, BY COUNTRY 2022-2032(%)
- FIGURE 27. GENERATIVE AI MARKET BY REGION, 2022
- FIGURE 28. U.S. GENERATIVE AI MARKET, 2022-2032 ($MILLION)
- FIGURE 29. CANADA GENERATIVE AI MARKET, 2022-2032 ($MILLION)
- FIGURE 30. UK GENERATIVE AI MARKET, 2022-2032 ($MILLION)
- FIGURE 31. GERMANY GENERATIVE AI MARKET, 2022-2032 ($MILLION)
- FIGURE 32. FRANCE GENERATIVE AI MARKET, 2022-2032 ($MILLION)
- FIGURE 33. ITALY GENERATIVE AI MARKET, 2022-2032 ($MILLION)
- FIGURE 34. SPAIN GENERATIVE AI MARKET, 2022-2032 ($MILLION)
- FIGURE 35. REST OF EUROPE GENERATIVE AI MARKET, 2022-2032 ($MILLION)
- FIGURE 36. CHINA GENERATIVE AI MARKET, 2022-2032 ($MILLION)
- FIGURE 37. JAPAN GENERATIVE AI MARKET, 2022-2032 ($MILLION)
- FIGURE 38. INDIA GENERATIVE AI MARKET, 2022-2032 ($MILLION)
- FIGURE 39. AUSTRALIA GENERATIVE AI MARKET, 2022-2032 ($MILLION)
- FIGURE 40. SOUTH KOREA GENERATIVE AI MARKET, 2022-2032 ($MILLION)
- FIGURE 41. REST OF ASIA-PACIFIC GENERATIVE AI MARKET, 2022-2032 ($MILLION)
- FIGURE 42. LATIN AMERICA GENERATIVE AI MARKET, 2022-2032 ($MILLION)
- FIGURE 43. MIDDLE EAST GENERATIVE AI MARKET, 2022-2032 ($MILLION)
- FIGURE 44. AFRICA GENERATIVE AI MARKET, 2022-2032 ($MILLION)
- FIGURE 45. TOP WINNING STRATEGIES, BY YEAR
- FIGURE 46. TOP WINNING STRATEGIES, BY DEVELOPMENT
- FIGURE 47. TOP WINNING STRATEGIES, BY COMPANY
- FIGURE 48. PRODUCT MAPPING OF TOP 10 PLAYERS
- FIGURE 49. COMPETITIVE DASHBOARD
- FIGURE 50. COMPETITIVE HEATMAP: GENERATIVE AI MARKET
- FIGURE 51. TOP PLAYER POSITIONING, 2022
- FIGURE 52. IBM CORPORATION: RESEARCH & DEVELOPMENT EXPENDITURE, 2020-2022 ($MILLION)
- FIGURE 53. IBM CORPORATION: NET REVENUE, 2020-2022 ($MILLION)
- FIGURE 54. IBM CORPORATION: REVENUE SHARE BY SEGMENT, 2022 (%)
- FIGURE 55. IBM CORPORATION: REVENUE SHARE BY REGION, 2022 (%)
- FIGURE 56. GOOGLE LLC: NET REVENUE, 2020-2022 ($MILLION)
- FIGURE 57. GOOGLE LLC: RESEARCH & DEVELOPMENT EXPENDITURE, 2020-2022 ($MILLION)
- FIGURE 58. GOOGLE LLC: REVENUE SHARE BY SEGMENT, 2022 (%)
- FIGURE 59. GOOGLE LLC: REVENUE SHARE BY REGION, 2022 (%)
- FIGURE 60. AMAZON WEB SERVICES, INC.: NET REVENUE, 2020-2022 ($MILLION)
- FIGURE 61. AMAZON WEB SERVICES, INC.: REVENUE SHARE BY SEGMENT, 2022 (%)
- FIGURE 62. AMAZON WEB SERVICES, INC.: REVENUE SHARE BY REGION, 2022 (%)
- FIGURE 63. MICROSOFT CORPORATION: NET REVENUE, 2020-2022 ($MILLION)
- FIGURE 64. MICROSOFT CORPORATION: RESEARCH & DEVELOPMENT EXPENDITURE, 2020-2022 ($MILLION)
- FIGURE 65. MICROSOFT CORPORATION: REVENUE SHARE BY SEGMENT, 2022 (%)
- FIGURE 66. MICROSOFT CORPORATION: REVENUE SHARE BY REGION, 2022 (%)
- FIGURE 67. ADOBE.: NET REVENUE, 2020-2022 ($MILLION)
- FIGURE 68. ADOBE.: REVENUE SHARE BY SEGMENT, 2022 (%)
- FIGURE 69. ADOBE.: REVENUE SHARE BY REGION, 2022 (%)

