
PUBLISHER: Allied Market Research | PRODUCT CODE: 1365700

PUBLISHER: Allied Market Research | PRODUCT CODE: 1365700
LCD shelf label Market By component, By display size, By communication technology, By store type : Global Opportunity Analysis and Industry Forecast, 2023-2032
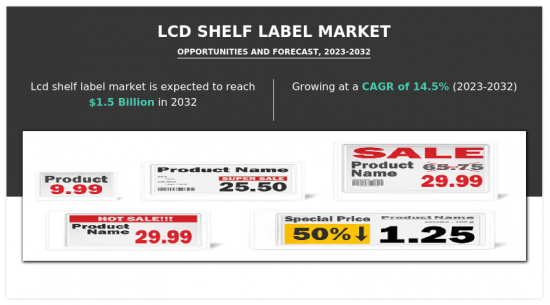
According to a new report published by Allied Market Research, titled, "LCD shelf label Market," The lcd shelf label market was valued at $387.87 million in 2022, and is estimated to reach $1.5 billion by 2032, growing at a CAGR of 14.5% from 2023 to 2032.
In recent years, the prices of LCD shelf screens have significantly dropped, further driving the adoption of this technology in ESL displays. The reduced costs have made it more feasible for retailers to implement LCD-based solutions, enhancing their overall customer experience and operational efficiency.
A notable example of the advancements in LCD technology is the launch of the 10.1" Zkong Dual Screen LCD Digital Signage by ZKONG in July 2022. This innovative product features two screens that can display different contents simultaneously, offering a unique and captivating visual experience. Supported by a rich library of templates and multi-screen co-display capabilities, the Zkong Dual Screen LCD Digital Signage enables users to bring their creative ideas to life and captivate their audience with engaging and informative displays.
However, the reliance on wireless connectivity for LCD shelf labels acts as a restraint in the market. Retailers must ensure consistent and reliable network coverage throughout their stores to support the seamless operation of the labels. However, achieving adequate coverage can be difficult in large retail environments or areas with limited network availability. The need for extensive network infrastructure and potential limitations in certain locations can increase the complexity and cost of implementing LCD shelf labels. These connectivity and infrastructure requirements may serve as barriers for some retailers, limiting the widespread adoption of this technology in certain market segments or geographical areas.
Despite this constraint, customization and personalization are key factors that have created significant opportunities for the growth of the LCD shelf label market. LCD shelf labels provide retailers with the flexibility to customize and personalize the display and content according to their branding requirements. This level of customization allows retailers to create a consistent and cohesive visual identity across their stores, reinforcing their brand image. Additionally, LCD shelf labels enable retailers to display product information in multiple languages, catering to a diverse customer base and enhancing accessibility. Moreover, personalized offers based on individual customer preferences can be displayed on the labels, creating a more engaging and targeted shopping experience. By leveraging these customization and personalization capabilities, retailers can differentiate themselves in the market, improve customer satisfaction, and ultimately drive sales.
The LCD shelf label market is segmented on the basis of component, display size, communication technology, store type, and region. By component, it is divided into displays, batteries, transceivers, microprocessors, and others. By display size, it is categorized into less than 3-inch, 3-inch to 7-inch, 7-inch to 10-inch, and more than 10-inch. By communication technology, it is segmented into radio frequency, infrared, near field communication, and others. By store type, it is classified into hypermarkets, supermarkets, non-food retail stores, specialty stores, and others. By region, the market is analyzed across North America (U.S., Canada, and Mexico), Europe (UK, Germany, France, and rest of Europe), Asia-Pacific (China, Japan, India, South Korea, and rest of Asia-Pacific) and LAMEA (Latin America, Middle East, and Africa).
The Major companies profiled in the report include: RECHI Retail System Solutions Limited, SES-imagotag, Zkong, Hanshow Technology, ZhSunyco, Highlight, ACLAS, Diebold Nixdorf, Incorporated., Samsung Electro-Mechanics Co Ltd., and Displaydata Limited.
Key Benefits For Stakeholders
- This report provides a quantitative analysis of the market segments, current trends, estimations, and dynamics of the lcd shelf label market analysis from 2022 to 2032 to identify the prevailing lcd shelf label market opportunities.
- The market research is offered along with information related to key drivers, restraints, and opportunities.
- Porter's five forces analysis highlights the potency of buyers and suppliers to enable stakeholders make profit-oriented business decisions and strengthen their supplier-buyer network.
- In-depth analysis of the lcd shelf label market segmentation assists to determine the prevailing market opportunities.
- Major countries in each region are mapped according to their revenue contribution to the global market.
- Market player positioning facilitates benchmarking and provides a clear understanding of the present position of the market players.
- The report includes the analysis of the regional as well as global lcd shelf label market trends, key players, market segments, application areas, and market growth strategies.
Additional benefits you will get with this purchase are:
- Quarterly Update and* (only available with a corporate license, on listed price)
- 5 additional Company Profile of client Choice pre- or Post-purchase, as a free update.
- Free Upcoming Version on the Purchase of Five and Enterprise User License.
- 16 analyst hours of support* (post-purchase, if you find additional data requirements upon review of the report, you may receive support amounting to 16 analyst hours to solve questions, and post-sale queries)
- 15% Free Customization* (in case the scope or segment of the report does not match your requirements, 20% is equivalent to 3 working days of free work, applicable once)
- Free data Pack on the Five and Enterprise User License. (Excel version of the report)
- Free Updated report if the report is 6-12 months old or older.
- 24-hour priority response*
- Free Industry updates and white papers.
Possible Customization with this report (with additional cost and timeline talk to the sales executive to know more)
- Product Benchmarking / Product specification and applications
- Product Life Cycles
- Supply Chain Analysis & Vendor Margins
- Upcoming/New Entrant by Regions
- Market share analysis of players by products/segments
- New Product Development/ Product Matrix of Key Players
- Additional company profiles with specific to client's interest
- Additional country or region analysis- market size and forecast
- Expanded list for Company Profiles
- Historic market data
- Key player details (including location, contact details, supplier/vendor network etc. in excel format)
- Market share analysis of players at global/region/country level
Key Market Segments
By component
- Displays
- Batteries
- Transceivers
- Microprocessors
- Others
By display size
- Less than 3-inch
- 3-inch to 7-inch
- 7-inch to 10-inch
- More than 10-inch
By communication technology
- Radio Frequency
- Infrared
- Near Field Communication
- Others
By store type
- Non-food Retail Stores
- Specialty Stores
- Others
- Hypermarkets
- Supermarkets
By Region
- North America
- U.S.
- Canada
- Mexico
- Europe
- UK
- Germany
- France
- Rest of Europe
- Asia-Pacific
- China
- Japan
- India
- South Korea
- Rest of Asia-Pacific
- LAMEA
- Latin America
- Middle East
- Africa
Key Market Players:
- ACLAS (Xiamen Pinnacle Electrical Co., Ltd)
- Diebold Nixdorf, Incorporated.
- Displaydata Limited
- Hanshow Technology
- Highlight Manufacturing Corp., Ltd
- RECHI Retail System Solutions Limited
- Samsung Electro-Mechanics Co Ltd.
- SES-imagotag SA
- ZhSunyco
- Zkong
TABLE OF CONTENTS
CHAPTER 1: INTRODUCTION
- 1.1. Report description
- 1.2. Key market segments
- 1.3. Key benefits to the stakeholders
- 1.4. Research Methodology
- 1.4.1. Primary research
- 1.4.2. Secondary research
- 1.4.3. Analyst tools and models
CHAPTER 2: EXECUTIVE SUMMARY
- 2.1. CXO Perspective
CHAPTER 3: MARKET OVERVIEW
- 3.1. Market definition and scope
- 3.2. Key findings
- 3.2.1. Top impacting factors
- 3.2.2. Top investment pockets
- 3.3. Porter's five forces analysis
- 3.3.1. Moderate bargaining power of suppliers
- 3.3.2. High threat of new entrants
- 3.3.3. Low threat of substitutes
- 3.3.4. Moderate-to-high intensity of rivalry
- 3.3.5. Moderate bargaining power of buyers
- 3.4. Market dynamics
- 3.4.1. Drivers
- 3.4.1.1. Enhanced pricing accuracy
- 3.4.1.2. Operational efficiency
- 3.4.1. Drivers
- 3.4.2. Restraints
- 3.4.2.1. Initial investment costs
- 3.4.3. Opportunities
- 3.4.3.1. Data-driven Insights
- 3.5. COVID-19 Impact Analysis on the market
CHAPTER 4: LCD SHELF LABEL MARKET, BY COMPONENT
- 4.1. Overview
- 4.1.1. Market size and forecast
- 4.2. Displays
- 4.2.1. Key market trends, growth factors and opportunities
- 4.2.2. Market size and forecast, by region
- 4.2.3. Market share analysis by country
- 4.3. Batteries
- 4.3.1. Key market trends, growth factors and opportunities
- 4.3.2. Market size and forecast, by region
- 4.3.3. Market share analysis by country
- 4.4. Transceivers
- 4.4.1. Key market trends, growth factors and opportunities
- 4.4.2. Market size and forecast, by region
- 4.4.3. Market share analysis by country
- 4.5. Microprocessors
- 4.5.1. Key market trends, growth factors and opportunities
- 4.5.2. Market size and forecast, by region
- 4.5.3. Market share analysis by country
- 4.6. Others
- 4.6.1. Key market trends, growth factors and opportunities
- 4.6.2. Market size and forecast, by region
- 4.6.3. Market share analysis by country
CHAPTER 5: LCD SHELF LABEL MARKET, BY DISPLAY SIZE
- 5.1. Overview
- 5.1.1. Market size and forecast
- 5.2. Less than 3-inch
- 5.2.1. Key market trends, growth factors and opportunities
- 5.2.2. Market size and forecast, by region
- 5.2.3. Market share analysis by country
- 5.3. 3-inch to 7-inch
- 5.3.1. Key market trends, growth factors and opportunities
- 5.3.2. Market size and forecast, by region
- 5.3.3. Market share analysis by country
- 5.4. 7-inch to 10-inch
- 5.4.1. Key market trends, growth factors and opportunities
- 5.4.2. Market size and forecast, by region
- 5.4.3. Market share analysis by country
- 5.5. More than 10-inch
- 5.5.1. Key market trends, growth factors and opportunities
- 5.5.2. Market size and forecast, by region
- 5.5.3. Market share analysis by country
CHAPTER 6: LCD SHELF LABEL MARKET, BY COMMUNICATION TECHNOLOGY
- 6.1. Overview
- 6.1.1. Market size and forecast
- 6.2. Radio Frequency
- 6.2.1. Key market trends, growth factors and opportunities
- 6.2.2. Market size and forecast, by region
- 6.2.3. Market share analysis by country
- 6.3. Infrared
- 6.3.1. Key market trends, growth factors and opportunities
- 6.3.2. Market size and forecast, by region
- 6.3.3. Market share analysis by country
- 6.4. Near Field Communication
- 6.4.1. Key market trends, growth factors and opportunities
- 6.4.2. Market size and forecast, by region
- 6.4.3. Market share analysis by country
- 6.5. Others
- 6.5.1. Key market trends, growth factors and opportunities
- 6.5.2. Market size and forecast, by region
- 6.5.3. Market share analysis by country
CHAPTER 7: LCD SHELF LABEL MARKET, BY STORE TYPE
- 7.1. Overview
- 7.1.1. Market size and forecast
- 7.2. Hypermarkets
- 7.2.1. Key market trends, growth factors and opportunities
- 7.2.2. Market size and forecast, by region
- 7.2.3. Market share analysis by country
- 7.3. Supermarkets
- 7.3.1. Key market trends, growth factors and opportunities
- 7.3.2. Market size and forecast, by region
- 7.3.3. Market share analysis by country
- 7.4. Non-food Retail Stores
- 7.4.1. Key market trends, growth factors and opportunities
- 7.4.2. Market size and forecast, by region
- 7.4.3. Market share analysis by country
- 7.5. Specialty Stores
- 7.5.1. Key market trends, growth factors and opportunities
- 7.5.2. Market size and forecast, by region
- 7.5.3. Market share analysis by country
- 7.6. Others
- 7.6.1. Key market trends, growth factors and opportunities
- 7.6.2. Market size and forecast, by region
- 7.6.3. Market share analysis by country
CHAPTER 8: LCD SHELF LABEL MARKET, BY REGION
- 8.1. Overview
- 8.1.1. Market size and forecast By Region
- 8.2. North America
- 8.2.1. Key trends and opportunities
- 8.2.2. Market size and forecast, by component
- 8.2.3. Market size and forecast, by display size
- 8.2.4. Market size and forecast, by communication technology
- 8.2.5. Market size and forecast, by store type
- 8.2.6. Market size and forecast, by country
- 8.2.6.1. U.S.
- 8.2.6.1.1. Key market trends, growth factors and opportunities
- 8.2.6.1.2. Market size and forecast, by component
- 8.2.6.1.3. Market size and forecast, by display size
- 8.2.6.1.4. Market size and forecast, by communication technology
- 8.2.6.1.5. Market size and forecast, by store type
- 8.2.6.2. Canada
- 8.2.6.2.1. Key market trends, growth factors and opportunities
- 8.2.6.2.2. Market size and forecast, by component
- 8.2.6.2.3. Market size and forecast, by display size
- 8.2.6.2.4. Market size and forecast, by communication technology
- 8.2.6.2.5. Market size and forecast, by store type
- 8.2.6.3. Mexico
- 8.2.6.3.1. Key market trends, growth factors and opportunities
- 8.2.6.3.2. Market size and forecast, by component
- 8.2.6.3.3. Market size and forecast, by display size
- 8.2.6.3.4. Market size and forecast, by communication technology
- 8.2.6.3.5. Market size and forecast, by store type
- 8.3. Europe
- 8.3.1. Key trends and opportunities
- 8.3.2. Market size and forecast, by component
- 8.3.3. Market size and forecast, by display size
- 8.3.4. Market size and forecast, by communication technology
- 8.3.5. Market size and forecast, by store type
- 8.3.6. Market size and forecast, by country
- 8.3.6.1. UK
- 8.3.6.1.1. Key market trends, growth factors and opportunities
- 8.3.6.1.2. Market size and forecast, by component
- 8.3.6.1.3. Market size and forecast, by display size
- 8.3.6.1.4. Market size and forecast, by communication technology
- 8.3.6.1.5. Market size and forecast, by store type
- 8.3.6.2. Germany
- 8.3.6.2.1. Key market trends, growth factors and opportunities
- 8.3.6.2.2. Market size and forecast, by component
- 8.3.6.2.3. Market size and forecast, by display size
- 8.3.6.2.4. Market size and forecast, by communication technology
- 8.3.6.2.5. Market size and forecast, by store type
- 8.3.6.3. France
- 8.3.6.3.1. Key market trends, growth factors and opportunities
- 8.3.6.3.2. Market size and forecast, by component
- 8.3.6.3.3. Market size and forecast, by display size
- 8.3.6.3.4. Market size and forecast, by communication technology
- 8.3.6.3.5. Market size and forecast, by store type
- 8.3.6.4. Rest of Europe
- 8.3.6.4.1. Key market trends, growth factors and opportunities
- 8.3.6.4.2. Market size and forecast, by component
- 8.3.6.4.3. Market size and forecast, by display size
- 8.3.6.4.4. Market size and forecast, by communication technology
- 8.3.6.4.5. Market size and forecast, by store type
- 8.4. Asia-Pacific
- 8.4.1. Key trends and opportunities
- 8.4.2. Market size and forecast, by component
- 8.4.3. Market size and forecast, by display size
- 8.4.4. Market size and forecast, by communication technology
- 8.4.5. Market size and forecast, by store type
- 8.4.6. Market size and forecast, by country
- 8.4.6.1. China
- 8.4.6.1.1. Key market trends, growth factors and opportunities
- 8.4.6.1.2. Market size and forecast, by component
- 8.4.6.1.3. Market size and forecast, by display size
- 8.4.6.1.4. Market size and forecast, by communication technology
- 8.4.6.1.5. Market size and forecast, by store type
- 8.4.6.2. Japan
- 8.4.6.2.1. Key market trends, growth factors and opportunities
- 8.4.6.2.2. Market size and forecast, by component
- 8.4.6.2.3. Market size and forecast, by display size
- 8.4.6.2.4. Market size and forecast, by communication technology
- 8.4.6.2.5. Market size and forecast, by store type
- 8.4.6.3. India
- 8.4.6.3.1. Key market trends, growth factors and opportunities
- 8.4.6.3.2. Market size and forecast, by component
- 8.4.6.3.3. Market size and forecast, by display size
- 8.4.6.3.4. Market size and forecast, by communication technology
- 8.4.6.3.5. Market size and forecast, by store type
- 8.4.6.4. South Korea
- 8.4.6.4.1. Key market trends, growth factors and opportunities
- 8.4.6.4.2. Market size and forecast, by component
- 8.4.6.4.3. Market size and forecast, by display size
- 8.4.6.4.4. Market size and forecast, by communication technology
- 8.4.6.4.5. Market size and forecast, by store type
- 8.4.6.5. Rest of Asia-Pacific
- 8.4.6.5.1. Key market trends, growth factors and opportunities
- 8.4.6.5.2. Market size and forecast, by component
- 8.4.6.5.3. Market size and forecast, by display size
- 8.4.6.5.4. Market size and forecast, by communication technology
- 8.4.6.5.5. Market size and forecast, by store type
- 8.5. LAMEA
- 8.5.1. Key trends and opportunities
- 8.5.2. Market size and forecast, by component
- 8.5.3. Market size and forecast, by display size
- 8.5.4. Market size and forecast, by communication technology
- 8.5.5. Market size and forecast, by store type
- 8.5.6. Market size and forecast, by country
- 8.5.6.1. Latin America
- 8.5.6.1.1. Key market trends, growth factors and opportunities
- 8.5.6.1.2. Market size and forecast, by component
- 8.5.6.1.3. Market size and forecast, by display size
- 8.5.6.1.4. Market size and forecast, by communication technology
- 8.5.6.1.5. Market size and forecast, by store type
- 8.5.6.2. Middle East
- 8.5.6.2.1. Key market trends, growth factors and opportunities
- 8.5.6.2.2. Market size and forecast, by component
- 8.5.6.2.3. Market size and forecast, by display size
- 8.5.6.2.4. Market size and forecast, by communication technology
- 8.5.6.2.5. Market size and forecast, by store type
- 8.5.6.3. Africa
- 8.5.6.3.1. Key market trends, growth factors and opportunities
- 8.5.6.3.2. Market size and forecast, by component
- 8.5.6.3.3. Market size and forecast, by display size
- 8.5.6.3.4. Market size and forecast, by communication technology
- 8.5.6.3.5. Market size and forecast, by store type
CHAPTER 9: COMPETITIVE LANDSCAPE
- 9.1. Introduction
- 9.2. Top winning strategies
- 9.3. Product Mapping of Top 10 Player
- 9.4. Competitive Dashboard
- 9.5. Competitive Heatmap
- 9.6. Top player positioning, 2022
CHAPTER 10: COMPANY PROFILES
- 10.1. RECHI Retail System Solutions Limited
- 10.1.1. Company overview
- 10.1.2. Key Executives
- 10.1.3. Company snapshot
- 10.1.4. Operating business segments
- 10.1.5. Product portfolio
- 10.2. SES-imagotag SA
- 10.2.1. Company overview
- 10.2.2. Key Executives
- 10.2.3. Company snapshot
- 10.2.4. Operating business segments
- 10.2.5. Product portfolio
- 10.2.6. Business performance
- 10.2.7. Key strategic moves and developments
- 10.3. Zkong
- 10.3.1. Company overview
- 10.3.2. Key Executives
- 10.3.3. Company snapshot
- 10.3.4. Operating business segments
- 10.3.5. Product portfolio
- 10.3.6. Key strategic moves and developments
- 10.4. Hanshow Technology
- 10.4.1. Company overview
- 10.4.2. Key Executives
- 10.4.3. Company snapshot
- 10.4.4. Operating business segments
- 10.4.5. Product portfolio
- 10.4.6. Key strategic moves and developments
- 10.5. ZhSunyco
- 10.5.1. Company overview
- 10.5.2. Key Executives
- 10.5.3. Company snapshot
- 10.5.4. Operating business segments
- 10.5.5. Product portfolio
- 10.6. Highlight Manufacturing Corp., Ltd
- 10.6.1. Company overview
- 10.6.2. Key Executives
- 10.6.3. Company snapshot
- 10.6.4. Operating business segments
- 10.6.5. Product portfolio
- 10.7. ACLAS (Xiamen Pinnacle Electrical Co., Ltd)
- 10.7.1. Company overview
- 10.7.2. Key Executives
- 10.7.3. Company snapshot
- 10.7.4. Operating business segments
- 10.7.5. Product portfolio
- 10.8. Diebold Nixdorf, Incorporated.
- 10.8.1. Company overview
- 10.8.2. Key Executives
- 10.8.3. Company snapshot
- 10.8.4. Operating business segments
- 10.8.5. Product portfolio
- 10.8.6. Business performance
- 10.9. Samsung Electro-Mechanics Co Ltd.
- 10.9.1. Company overview
- 10.9.2. Key Executives
- 10.9.3. Company snapshot
- 10.9.4. Operating business segments
- 10.9.5. Product portfolio
- 10.9.6. Business performance
- 10.10. Displaydata Limited
- 10.10.1. Company overview
- 10.10.2. Key Executives
- 10.10.3. Company snapshot
- 10.10.4. Operating business segments
- 10.10.5. Product portfolio
- 10.10.6. Key strategic moves and developments
LIST OF TABLES
- TABLE 01. GLOBAL LCD SHELF LABEL MARKET, BY COMPONENT, 2022-2032 ($MILLION)
- TABLE 02. LCD SHELF LABEL MARKET FOR DISPLAYS, BY REGION, 2022-2032 ($MILLION)
- TABLE 03. LCD SHELF LABEL MARKET FOR BATTERIES, BY REGION, 2022-2032 ($MILLION)
- TABLE 04. LCD SHELF LABEL MARKET FOR TRANSCEIVERS, BY REGION, 2022-2032 ($MILLION)
- TABLE 05. LCD SHELF LABEL MARKET FOR MICROPROCESSORS, BY REGION, 2022-2032 ($MILLION)
- TABLE 06. LCD SHELF LABEL MARKET FOR OTHERS, BY REGION, 2022-2032 ($MILLION)
- TABLE 07. GLOBAL LCD SHELF LABEL MARKET, BY DISPLAY SIZE, 2022-2032 ($MILLION)
- TABLE 08. LCD SHELF LABEL MARKET FOR LESS THAN 3-INCH, BY REGION, 2022-2032 ($MILLION)
- TABLE 09. LCD SHELF LABEL MARKET FOR 3-INCH TO 7-INCH, BY REGION, 2022-2032 ($MILLION)
- TABLE 10. LCD SHELF LABEL MARKET FOR 7-INCH TO 10-INCH, BY REGION, 2022-2032 ($MILLION)
- TABLE 11. LCD SHELF LABEL MARKET FOR MORE THAN 10-INCH, BY REGION, 2022-2032 ($MILLION)
- TABLE 12. GLOBAL LCD SHELF LABEL MARKET, BY COMMUNICATION TECHNOLOGY, 2022-2032 ($MILLION)
- TABLE 13. LCD SHELF LABEL MARKET FOR RADIO FREQUENCY, BY REGION, 2022-2032 ($MILLION)
- TABLE 14. LCD SHELF LABEL MARKET FOR INFRARED , BY REGION, 2022-2032 ($MILLION)
- TABLE 15. LCD SHELF LABEL MARKET FOR NEAR FIELD COMMUNICATION, BY REGION, 2022-2032 ($MILLION)
- TABLE 16. LCD SHELF LABEL MARKET FOR OTHERS, BY REGION, 2022-2032 ($MILLION)
- TABLE 17. GLOBAL LCD SHELF LABEL MARKET, BY STORE TYPE, 2022-2032 ($MILLION)
- TABLE 18. LCD SHELF LABEL MARKET FOR HYPERMARKETS, BY REGION, 2022-2032 ($MILLION)
- TABLE 19. LCD SHELF LABEL MARKET FOR SUPERMARKETS, BY REGION, 2022-2032 ($MILLION)
- TABLE 20. LCD SHELF LABEL MARKET FOR NON-FOOD RETAIL STORES , BY REGION, 2022-2032 ($MILLION)
- TABLE 21. LCD SHELF LABEL MARKET FOR SPECIALTY STORES, BY REGION, 2022-2032 ($MILLION)
- TABLE 22. LCD SHELF LABEL MARKET FOR OTHERS, BY REGION, 2022-2032 ($MILLION)
- TABLE 23. LCD SHELF LABEL MARKET, BY REGION, 2022-2032 ($MILLION)
- TABLE 24. NORTH AMERICA LCD SHELF LABEL MARKET, BY COMPONENT, 2022-2032 ($MILLION)
- TABLE 25. NORTH AMERICA LCD SHELF LABEL MARKET, BY DISPLAY SIZE, 2022-2032 ($MILLION)
- TABLE 26. NORTH AMERICA LCD SHELF LABEL MARKET, BY COMMUNICATION TECHNOLOGY, 2022-2032 ($MILLION)
- TABLE 27. NORTH AMERICA LCD SHELF LABEL MARKET, BY STORE TYPE, 2022-2032 ($MILLION)
- TABLE 28. NORTH AMERICA LCD SHELF LABEL MARKET, BY COUNTRY, 2022-2032 ($MILLION)
- TABLE 29. U.S. LCD SHELF LABEL MARKET, BY COMPONENT, 2022-2032 ($MILLION)
- TABLE 30. U.S. LCD SHELF LABEL MARKET, BY DISPLAY SIZE, 2022-2032 ($MILLION)
- TABLE 31. U.S. LCD SHELF LABEL MARKET, BY COMMUNICATION TECHNOLOGY, 2022-2032 ($MILLION)
- TABLE 32. U.S. LCD SHELF LABEL MARKET, BY STORE TYPE, 2022-2032 ($MILLION)
- TABLE 33. CANADA LCD SHELF LABEL MARKET, BY COMPONENT, 2022-2032 ($MILLION)
- TABLE 34. CANADA LCD SHELF LABEL MARKET, BY DISPLAY SIZE, 2022-2032 ($MILLION)
- TABLE 35. CANADA LCD SHELF LABEL MARKET, BY COMMUNICATION TECHNOLOGY, 2022-2032 ($MILLION)
- TABLE 36. CANADA LCD SHELF LABEL MARKET, BY STORE TYPE, 2022-2032 ($MILLION)
- TABLE 37. MEXICO LCD SHELF LABEL MARKET, BY COMPONENT, 2022-2032 ($MILLION)
- TABLE 38. MEXICO LCD SHELF LABEL MARKET, BY DISPLAY SIZE, 2022-2032 ($MILLION)
- TABLE 39. MEXICO LCD SHELF LABEL MARKET, BY COMMUNICATION TECHNOLOGY, 2022-2032 ($MILLION)
- TABLE 40. MEXICO LCD SHELF LABEL MARKET, BY STORE TYPE, 2022-2032 ($MILLION)
- TABLE 41. EUROPE LCD SHELF LABEL MARKET, BY COMPONENT, 2022-2032 ($MILLION)
- TABLE 42. EUROPE LCD SHELF LABEL MARKET, BY DISPLAY SIZE, 2022-2032 ($MILLION)
- TABLE 43. EUROPE LCD SHELF LABEL MARKET, BY COMMUNICATION TECHNOLOGY, 2022-2032 ($MILLION)
- TABLE 44. EUROPE LCD SHELF LABEL MARKET, BY STORE TYPE, 2022-2032 ($MILLION)
- TABLE 45. EUROPE LCD SHELF LABEL MARKET, BY COUNTRY, 2022-2032 ($MILLION)
- TABLE 46. UK LCD SHELF LABEL MARKET, BY COMPONENT, 2022-2032 ($MILLION)
- TABLE 47. UK LCD SHELF LABEL MARKET, BY DISPLAY SIZE, 2022-2032 ($MILLION)
- TABLE 48. UK LCD SHELF LABEL MARKET, BY COMMUNICATION TECHNOLOGY, 2022-2032 ($MILLION)
- TABLE 49. UK LCD SHELF LABEL MARKET, BY STORE TYPE, 2022-2032 ($MILLION)
- TABLE 50. GERMANY LCD SHELF LABEL MARKET, BY COMPONENT, 2022-2032 ($MILLION)
- TABLE 51. GERMANY LCD SHELF LABEL MARKET, BY DISPLAY SIZE, 2022-2032 ($MILLION)
- TABLE 52. GERMANY LCD SHELF LABEL MARKET, BY COMMUNICATION TECHNOLOGY, 2022-2032 ($MILLION)
- TABLE 53. GERMANY LCD SHELF LABEL MARKET, BY STORE TYPE, 2022-2032 ($MILLION)
- TABLE 54. FRANCE LCD SHELF LABEL MARKET, BY COMPONENT, 2022-2032 ($MILLION)
- TABLE 55. FRANCE LCD SHELF LABEL MARKET, BY DISPLAY SIZE, 2022-2032 ($MILLION)
- TABLE 56. FRANCE LCD SHELF LABEL MARKET, BY COMMUNICATION TECHNOLOGY, 2022-2032 ($MILLION)
- TABLE 57. FRANCE LCD SHELF LABEL MARKET, BY STORE TYPE, 2022-2032 ($MILLION)
- TABLE 58. REST OF EUROPE LCD SHELF LABEL MARKET, BY COMPONENT, 2022-2032 ($MILLION)
- TABLE 59. REST OF EUROPE LCD SHELF LABEL MARKET, BY DISPLAY SIZE, 2022-2032 ($MILLION)
- TABLE 60. REST OF EUROPE LCD SHELF LABEL MARKET, BY COMMUNICATION TECHNOLOGY, 2022-2032 ($MILLION)
- TABLE 61. REST OF EUROPE LCD SHELF LABEL MARKET, BY STORE TYPE, 2022-2032 ($MILLION)
- TABLE 62. ASIA-PACIFIC LCD SHELF LABEL MARKET, BY COMPONENT, 2022-2032 ($MILLION)
- TABLE 63. ASIA-PACIFIC LCD SHELF LABEL MARKET, BY DISPLAY SIZE, 2022-2032 ($MILLION)
- TABLE 64. ASIA-PACIFIC LCD SHELF LABEL MARKET, BY COMMUNICATION TECHNOLOGY, 2022-2032 ($MILLION)
- TABLE 65. ASIA-PACIFIC LCD SHELF LABEL MARKET, BY STORE TYPE, 2022-2032 ($MILLION)
- TABLE 66. ASIA-PACIFIC LCD SHELF LABEL MARKET, BY COUNTRY, 2022-2032 ($MILLION)
- TABLE 67. CHINA LCD SHELF LABEL MARKET, BY COMPONENT, 2022-2032 ($MILLION)
- TABLE 68. CHINA LCD SHELF LABEL MARKET, BY DISPLAY SIZE, 2022-2032 ($MILLION)
- TABLE 69. CHINA LCD SHELF LABEL MARKET, BY COMMUNICATION TECHNOLOGY, 2022-2032 ($MILLION)
- TABLE 70. CHINA LCD SHELF LABEL MARKET, BY STORE TYPE, 2022-2032 ($MILLION)
- TABLE 71. JAPAN LCD SHELF LABEL MARKET, BY COMPONENT, 2022-2032 ($MILLION)
- TABLE 72. JAPAN LCD SHELF LABEL MARKET, BY DISPLAY SIZE, 2022-2032 ($MILLION)
- TABLE 73. JAPAN LCD SHELF LABEL MARKET, BY COMMUNICATION TECHNOLOGY, 2022-2032 ($MILLION)
- TABLE 74. JAPAN LCD SHELF LABEL MARKET, BY STORE TYPE, 2022-2032 ($MILLION)
- TABLE 75. INDIA LCD SHELF LABEL MARKET, BY COMPONENT, 2022-2032 ($MILLION)
- TABLE 76. INDIA LCD SHELF LABEL MARKET, BY DISPLAY SIZE, 2022-2032 ($MILLION)
- TABLE 77. INDIA LCD SHELF LABEL MARKET, BY COMMUNICATION TECHNOLOGY, 2022-2032 ($MILLION)
- TABLE 78. INDIA LCD SHELF LABEL MARKET, BY STORE TYPE, 2022-2032 ($MILLION)
- TABLE 79. SOUTH KOREA LCD SHELF LABEL MARKET, BY COMPONENT, 2022-2032 ($MILLION)
- TABLE 80. SOUTH KOREA LCD SHELF LABEL MARKET, BY DISPLAY SIZE, 2022-2032 ($MILLION)
- TABLE 81. SOUTH KOREA LCD SHELF LABEL MARKET, BY COMMUNICATION TECHNOLOGY, 2022-2032 ($MILLION)
- TABLE 82. SOUTH KOREA LCD SHELF LABEL MARKET, BY STORE TYPE, 2022-2032 ($MILLION)
- TABLE 83. REST OF ASIA-PACIFIC LCD SHELF LABEL MARKET, BY COMPONENT, 2022-2032 ($MILLION)
- TABLE 84. REST OF ASIA-PACIFIC LCD SHELF LABEL MARKET, BY DISPLAY SIZE, 2022-2032 ($MILLION)
- TABLE 85. REST OF ASIA-PACIFIC LCD SHELF LABEL MARKET, BY COMMUNICATION TECHNOLOGY, 2022-2032 ($MILLION)
- TABLE 86. REST OF ASIA-PACIFIC LCD SHELF LABEL MARKET, BY STORE TYPE, 2022-2032 ($MILLION)
- TABLE 87. LAMEA LCD SHELF LABEL MARKET, BY COMPONENT, 2022-2032 ($MILLION)
- TABLE 88. LAMEA LCD SHELF LABEL MARKET, BY DISPLAY SIZE, 2022-2032 ($MILLION)
- TABLE 89. LAMEA LCD SHELF LABEL MARKET, BY COMMUNICATION TECHNOLOGY, 2022-2032 ($MILLION)
- TABLE 90. LAMEA LCD SHELF LABEL MARKET, BY STORE TYPE, 2022-2032 ($MILLION)
- TABLE 91. LAMEA LCD SHELF LABEL MARKET, BY COUNTRY, 2022-2032 ($MILLION)
- TABLE 92. LATIN AMERICA LCD SHELF LABEL MARKET, BY COMPONENT, 2022-2032 ($MILLION)
- TABLE 93. LATIN AMERICA LCD SHELF LABEL MARKET, BY DISPLAY SIZE, 2022-2032 ($MILLION)
- TABLE 94. LATIN AMERICA LCD SHELF LABEL MARKET, BY COMMUNICATION TECHNOLOGY, 2022-2032 ($MILLION)
- TABLE 95. LATIN AMERICA LCD SHELF LABEL MARKET, BY STORE TYPE, 2022-2032 ($MILLION)
- TABLE 96. MIDDLE EAST LCD SHELF LABEL MARKET, BY COMPONENT, 2022-2032 ($MILLION)
- TABLE 97. MIDDLE EAST LCD SHELF LABEL MARKET, BY DISPLAY SIZE, 2022-2032 ($MILLION)
- TABLE 98. MIDDLE EAST LCD SHELF LABEL MARKET, BY COMMUNICATION TECHNOLOGY, 2022-2032 ($MILLION)
- TABLE 99. MIDDLE EAST LCD SHELF LABEL MARKET, BY STORE TYPE, 2022-2032 ($MILLION)
- TABLE 100. AFRICA LCD SHELF LABEL MARKET, BY COMPONENT, 2022-2032 ($MILLION)
- TABLE 101. AFRICA LCD SHELF LABEL MARKET, BY DISPLAY SIZE, 2022-2032 ($MILLION)
- TABLE 102. AFRICA LCD SHELF LABEL MARKET, BY COMMUNICATION TECHNOLOGY, 2022-2032 ($MILLION)
- TABLE 103. AFRICA LCD SHELF LABEL MARKET, BY STORE TYPE, 2022-2032 ($MILLION)
- TABLE 104. RECHI RETAIL SYSTEM SOLUTIONS LIMITED: KEY EXECUTIVES
- TABLE 105. RECHI RETAIL SYSTEM SOLUTIONS LIMITED: COMPANY SNAPSHOT
- TABLE 106. RECHI RETAIL SYSTEM SOLUTIONS LIMITED: SERVICE SEGMENTS
- TABLE 107. RECHI RETAIL SYSTEM SOLUTIONS LIMITED: PRODUCT PORTFOLIO
- TABLE 108. SES-IMAGOTAG SA: KEY EXECUTIVES
- TABLE 109. SES-IMAGOTAG SA: COMPANY SNAPSHOT
- TABLE 110. SES-IMAGOTAG SA: PRODUCT SEGMENTS
- TABLE 111. SES-IMAGOTAG SA: PRODUCT PORTFOLIO
- TABLE 112. SES-IMAGOTAG SA: KEY STRATERGIES
- TABLE 113. ZKONG: KEY EXECUTIVES
- TABLE 114. ZKONG: COMPANY SNAPSHOT
- TABLE 115. ZKONG: PRODUCT SEGMENTS
- TABLE 116. ZKONG: PRODUCT PORTFOLIO
- TABLE 117. ZKONG: KEY STRATERGIES
- TABLE 118. HANSHOW TECHNOLOGY: KEY EXECUTIVES
- TABLE 119. HANSHOW TECHNOLOGY: COMPANY SNAPSHOT
- TABLE 120. HANSHOW TECHNOLOGY: PRODUCT SEGMENTS
- TABLE 121. HANSHOW TECHNOLOGY: PRODUCT PORTFOLIO
- TABLE 122. HANSHOW TECHNOLOGY: KEY STRATERGIES
- TABLE 123. ZHSUNYCO: KEY EXECUTIVES
- TABLE 124. ZHSUNYCO: COMPANY SNAPSHOT
- TABLE 125. ZHSUNYCO: PRODUCT SEGMENTS
- TABLE 126. ZHSUNYCO: PRODUCT PORTFOLIO
- TABLE 127. HIGHLIGHT MANUFACTURING CORP., LTD: KEY EXECUTIVES
- TABLE 128. HIGHLIGHT MANUFACTURING CORP., LTD: COMPANY SNAPSHOT
- TABLE 129. HIGHLIGHT MANUFACTURING CORP., LTD: PRODUCT SEGMENTS
- TABLE 130. HIGHLIGHT MANUFACTURING CORP., LTD: PRODUCT PORTFOLIO
- TABLE 131. ACLAS (XIAMEN PINNACLE ELECTRICAL CO., LTD): KEY EXECUTIVES
- TABLE 132. ACLAS (XIAMEN PINNACLE ELECTRICAL CO., LTD): COMPANY SNAPSHOT
- TABLE 133. ACLAS (XIAMEN PINNACLE ELECTRICAL CO., LTD): SERVICE SEGMENTS
- TABLE 134. ACLAS (XIAMEN PINNACLE ELECTRICAL CO., LTD): PRODUCT PORTFOLIO
- TABLE 135. DIEBOLD NIXDORF, INCORPORATED.: KEY EXECUTIVES
- TABLE 136. DIEBOLD NIXDORF, INCORPORATED.: COMPANY SNAPSHOT
- TABLE 137. DIEBOLD NIXDORF, INCORPORATED.: PRODUCT SEGMENTS
- TABLE 138. DIEBOLD NIXDORF, INCORPORATED.: PRODUCT PORTFOLIO
- TABLE 139. SAMSUNG ELECTRO-MECHANICS CO LTD.: KEY EXECUTIVES
- TABLE 140. SAMSUNG ELECTRO-MECHANICS CO LTD.: COMPANY SNAPSHOT
- TABLE 141. SAMSUNG ELECTRO-MECHANICS CO LTD.: PRODUCT SEGMENTS
- TABLE 142. SAMSUNG ELECTRO-MECHANICS CO LTD.: PRODUCT PORTFOLIO
- TABLE 143. DISPLAYDATA LIMITED: KEY EXECUTIVES
- TABLE 144. DISPLAYDATA LIMITED: COMPANY SNAPSHOT
- TABLE 145. DISPLAYDATA LIMITED: PRODUCT SEGMENTS
- TABLE 146. DISPLAYDATA LIMITED: PRODUCT PORTFOLIO
- TABLE 147. DISPLAYDATA LIMITED: KEY STRATERGIES
LIST OF FIGURES
- FIGURE 01. LCD SHELF LABEL MARKET, 2022-2032
- FIGURE 02. SEGMENTATION OF LCD SHELF LABEL MARKET, 2022-2032
- FIGURE 03. LCD SHELF LABEL MARKET,2022-2032
- FIGURE 04. TOP INVESTMENT POCKETS IN LCD SHELF LABEL MARKET (2023-2032)
- FIGURE 05. MODERATE BARGAINING POWER OF SUPPLIERS
- FIGURE 06. HIGH THREAT OF NEW ENTRANTS
- FIGURE 07. LOW THREAT OF SUBSTITUTES
- FIGURE 08. MODERATE-TO-HIGH INTENSITY OF RIVALRY
- FIGURE 09. MODERATE BARGAINING POWER OF BUYERS
- FIGURE 10. GLOBAL LCD SHELF LABEL MARKET:DRIVERS, RESTRAINTS AND OPPORTUNITIES
- FIGURE 11. LCD SHELF LABEL MARKET, BY COMPONENT, 2022(%)
- FIGURE 12. COMPARATIVE SHARE ANALYSIS OF LCD SHELF LABEL MARKET FOR DISPLAYS, BY COUNTRY 2022-2032(%)
- FIGURE 13. COMPARATIVE SHARE ANALYSIS OF LCD SHELF LABEL MARKET FOR BATTERIES, BY COUNTRY 2022-2032(%)
- FIGURE 14. COMPARATIVE SHARE ANALYSIS OF LCD SHELF LABEL MARKET FOR TRANSCEIVERS, BY COUNTRY 2022-2032(%)
- FIGURE 15. COMPARATIVE SHARE ANALYSIS OF LCD SHELF LABEL MARKET FOR MICROPROCESSORS, BY COUNTRY 2022-2032(%)
- FIGURE 16. COMPARATIVE SHARE ANALYSIS OF LCD SHELF LABEL MARKET FOR OTHERS, BY COUNTRY 2022-2032(%)
- FIGURE 17. LCD SHELF LABEL MARKET, BY DISPLAY SIZE, 2022(%)
- FIGURE 18. COMPARATIVE SHARE ANALYSIS OF LCD SHELF LABEL MARKET FOR LESS THAN 3-INCH, BY COUNTRY 2022-2032(%)
- FIGURE 19. COMPARATIVE SHARE ANALYSIS OF LCD SHELF LABEL MARKET FOR 3-INCH TO 7-INCH, BY COUNTRY 2022-2032(%)
- FIGURE 20. COMPARATIVE SHARE ANALYSIS OF LCD SHELF LABEL MARKET FOR 7-INCH TO 10-INCH, BY COUNTRY 2022-2032(%)
- FIGURE 21. COMPARATIVE SHARE ANALYSIS OF LCD SHELF LABEL MARKET FOR MORE THAN 10-INCH, BY COUNTRY 2022-2032(%)
- FIGURE 22. LCD SHELF LABEL MARKET, BY COMMUNICATION TECHNOLOGY, 2022(%)
- FIGURE 23. COMPARATIVE SHARE ANALYSIS OF LCD SHELF LABEL MARKET FOR RADIO FREQUENCY, BY COUNTRY 2022-2032(%)
- FIGURE 24. COMPARATIVE SHARE ANALYSIS OF LCD SHELF LABEL MARKET FOR INFRARED , BY COUNTRY 2022-2032(%)
- FIGURE 25. COMPARATIVE SHARE ANALYSIS OF LCD SHELF LABEL MARKET FOR NEAR FIELD COMMUNICATION, BY COUNTRY 2022-2032(%)
- FIGURE 26. COMPARATIVE SHARE ANALYSIS OF LCD SHELF LABEL MARKET FOR OTHERS, BY COUNTRY 2022-2032(%)
- FIGURE 27. LCD SHELF LABEL MARKET, BY STORE TYPE, 2022(%)
- FIGURE 28. COMPARATIVE SHARE ANALYSIS OF LCD SHELF LABEL MARKET FOR HYPERMARKETS, BY COUNTRY 2022-2032(%)
- FIGURE 29. COMPARATIVE SHARE ANALYSIS OF LCD SHELF LABEL MARKET FOR SUPERMARKETS, BY COUNTRY 2022-2032(%)
- FIGURE 30. COMPARATIVE SHARE ANALYSIS OF LCD SHELF LABEL MARKET FOR NON-FOOD RETAIL STORES , BY COUNTRY 2022-2032(%)
- FIGURE 31. COMPARATIVE SHARE ANALYSIS OF LCD SHELF LABEL MARKET FOR SPECIALTY STORES, BY COUNTRY 2022-2032(%)
- FIGURE 32. COMPARATIVE SHARE ANALYSIS OF LCD SHELF LABEL MARKET FOR OTHERS, BY COUNTRY 2022-2032(%)
- FIGURE 33. LCD SHELF LABEL MARKET BY REGION, 2022
- FIGURE 34. U.S. LCD SHELF LABEL MARKET, 2022-2032 ($MILLION)
- FIGURE 35. CANADA LCD SHELF LABEL MARKET, 2022-2032 ($MILLION)
- FIGURE 36. MEXICO LCD SHELF LABEL MARKET, 2022-2032 ($MILLION)
- FIGURE 37. UK LCD SHELF LABEL MARKET, 2022-2032 ($MILLION)
- FIGURE 38. GERMANY LCD SHELF LABEL MARKET, 2022-2032 ($MILLION)
- FIGURE 39. FRANCE LCD SHELF LABEL MARKET, 2022-2032 ($MILLION)
- FIGURE 40. REST OF EUROPE LCD SHELF LABEL MARKET, 2022-2032 ($MILLION)
- FIGURE 41. CHINA LCD SHELF LABEL MARKET, 2022-2032 ($MILLION)
- FIGURE 42. JAPAN LCD SHELF LABEL MARKET, 2022-2032 ($MILLION)
- FIGURE 43. INDIA LCD SHELF LABEL MARKET, 2022-2032 ($MILLION)
- FIGURE 44. SOUTH KOREA LCD SHELF LABEL MARKET, 2022-2032 ($MILLION)
- FIGURE 45. REST OF ASIA-PACIFIC LCD SHELF LABEL MARKET, 2022-2032 ($MILLION)
- FIGURE 46. LATIN AMERICA LCD SHELF LABEL MARKET, 2022-2032 ($MILLION)
- FIGURE 47. MIDDLE EAST LCD SHELF LABEL MARKET, 2022-2032 ($MILLION)
- FIGURE 48. AFRICA LCD SHELF LABEL MARKET, 2022-2032 ($MILLION)
- FIGURE 49. TOP WINNING STRATEGIES, BY YEAR
- FIGURE 50. TOP WINNING STRATEGIES, BY DEVELOPMENT
- FIGURE 51. TOP WINNING STRATEGIES, BY COMPANY
- FIGURE 52. PRODUCT MAPPING OF TOP 10 PLAYERS
- FIGURE 53. COMPETITIVE DASHBOARD
- FIGURE 54. COMPETITIVE HEATMAP: LCD SHELF LABEL MARKET
- FIGURE 55. TOP PLAYER POSITIONING, 2022
- FIGURE 56. SES-IMAGOTAG SA: NET REVENUE, 2020-2022 ($MILLION)
- FIGURE 57. SES-IMAGOTAG SA: REVENUE SHARE BY REGION, 2021 (%)
- FIGURE 58. DIEBOLD NIXDORF, INCORPORATED.: NET REVENUE, 2020-2022 ($MILLION)
- FIGURE 59. DIEBOLD NIXDORF, INCORPORATED.: RESEARCH & DEVELOPMENT EXPENDITURE, 2020-2022
- FIGURE 60. DIEBOLD NIXDORF, INCORPORATED.: REVENUE SHARE BY SEGMENT, 2022 (%)
- FIGURE 61. DIEBOLD NIXDORF, INCORPORATED.: REVENUE SHARE BY REGION, 2021 (%)
- FIGURE 62. SAMSUNG ELECTRO-MECHANICS CO LTD.: NET REVENUE, 2020-2022 ($MILLION)

