
PUBLISHER: Allied Market Research | PRODUCT CODE: 1365751

PUBLISHER: Allied Market Research | PRODUCT CODE: 1365751
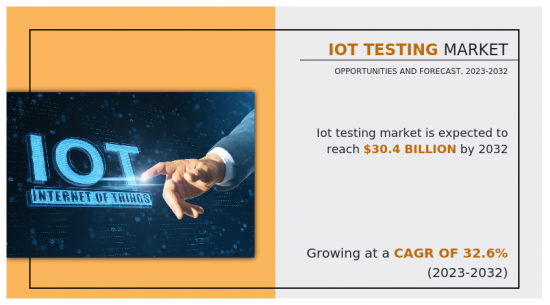
IoT Testing Market By Service Type, By Testing Type, By Application : Global Opportunity Analysis and Industry Forecast, 2023-2032
The IoT Testing Market is likely to experience a significant growth rate of 32.6% from 2023-2032 owing to increasing market demand for smart manufacturing applications- Allied Market Research
IoT (Internet of Things) testing is the comprehensive process of evaluating and verifying the functionality, performance, security, and overall quality of IoT devices, systems, and applications. IoT testing ensures that interconnected devices can effectively communicate, exchange data, and operate as intended within complex IoT ecosystems. This testing process is vital for delivering reliable and seamless IoT solutions that meet user expectations and industry standards.
The increase in demand for IP testing of IoT devices is a key driver for the growth of the IoT testing market. The proliferation of IoT devices across industries has led to intricate ecosystems with diverse devices, platforms, and communication protocols. IP testing ensures that devices can effectively communicate with one another, fostering interoperability and avoiding communication breakdowns. As IoT networks expand, the ability to handle increased network traffic becomes even more important. Furthermore, increased deployment of microservices and rise in importance of DevOps are other factors driving the growth of the IoT testing market. DevOps methodologies emphasize continuous integration and continuous delivery (CI/CD), allowing for faster and more frequent releases of IoT applications and firmware. As IoT devices become more integral to various industries, the need for rapid development and deployment is critical. This accelerated pace demands efficient and automated testing to ensure the quality and reliability of IoT solutions. However, lack of consistency among standards for interconnectivity and interoperability is a major factor hampering the growth of the market. The absence of consistent standards leads to a diverse array of communication protocols, data formats, and connectivity mechanisms. This complexity complicates testing environments, requiring testing providers to support a multitude of variations. Moreover, the lack of standardized protocols and interfaces slows down the testing process and overall product development lifecycle. This extended time-to-market can hamper the competitiveness of IoT solutions.
The market also offers growth opportunities to the key players in the market. The increase in adoption of smart city concepts presents a significant opportunity for the IoT testing industry. Smart cities encompass a wide array of IoT applications, including smart transportation, energy management, waste management, public safety, and more. Each application domain demands specialized testing to validate its unique functionalities and interactions. In addition, smart cities generate massive volumes of data from various sources. Testing services that validate data accuracy, integrity, and analytics algorithms are vital to extracting meaningful insights.
The IoT testing market is segmented on the basis service type, testing type, application, and region. On the basis of service type, it is categorized into professional service and managed service. By testing type, it is divided into functional testing, performance testing, network testing, compatibility testing, usability testing, and security testing. As per application, it is categorized into smart building and home automation, capillary networks management, smart utilities, vehicle telematics, smart manufacturing, smart healthcare, and others. Region wise, it is analyzed across North America (the U.S., and Canada), Europe (UK, Germany, France, Italy, Spain, and rest of Europe), Asia-Pacific (China, India, Japan, Australia, South Korea and rest of Asia-Pacific), and LAMEA (Latin America, Middle East, and Africa).
The key players profiled in the study are AFour Technologies, Apica, Novacoast, Inc., Capgemini SE, Happiest Minds, HCL Technologies Limited, Infosys, Keysight Technologies, Praetorian, and Rapid7. The players in the market have been actively engaged in the adoption various strategies such as collaboration, product launch, and partnership to remain competitive and gain advantage over the competitors in the market. For instance, in January 2023, Cognizant, a prominent IT services company, acquired Mobica, a supplier of IoT software engineering services with its headquarters in Manchester, UK. Mobica's services include the whole software development lifecycle, focusing on customers' strategic internal research and development initiatives and core expertise in various domains, including testing. The purchase considerably broadens Cognizant's expertise in IoT-embedded software engineering and offers clients a broader range of end-to-end assistance to facilitate digital transformation. Moreover, in May 2023, HCL Technologies launched ADvantage Code on Amazon Web Services (AWS) marketplace. The solution enhances and automates cloud-native application development. The solution aids businesses in scaling, standardizing, and lowering infrastructure expenses. In addition, the software enhances application development by automatically producing portions of the code. The code is then regularly reviewed, tested for security and quality, and ultimately deployed to the target platform via DevOps pipelines. This strategy was implemented to strengthen HCL Technologies position in the IoT testing market. Therefore, such strategies foster the IoT testing market growth.
Key Market Insights
By service type, the professional service segment was the highest revenue contributor to the market, and is estimated to $18949.59 million by 2032, with a CAGR of 31.3%. However, the managed service segment is expected to be the fastest growing segment with the CAGR of 34.9% during the forecast period.
By testing type, the functional testing segment dominated the global market, and is estimated to reach $5505.69 million by 2032, with a CAGR of 27.0%. However, the network testing segment is expected to be the fastest growing segment with the CAGR of 37.3% during the forecast period.
By application, the smart manufacturing segment dominated the global market, and is estimated to reach $5807.32 million by 2032, with a CAGR of 28.9%. However, the smart healthcare segment is expected to be the fastest growing segment with the CAGR of 39.5% during the forecast period.
- Based on region, North America was the highest revenue contributor, accounting for $685.92 million in 2022, and is estimated to reach $9335.01 million by 2032, with a CAGR of 30.2%.
Additional benefits you will get with this purchase are:
- Quarterly Update and* (only available with a corporate license, on listed price)
- 5 additional Company Profile of client Choice pre- or Post-purchase, as a free update.
- Free Upcoming Version on the Purchase of Five and Enterprise User License.
- 16 analyst hours of support* (post-purchase, if you find additional data requirements upon review of the report, you may receive support amounting to 16 analyst hours to solve questions, and post-sale queries)
- 15% Free Customization* (in case the scope or segment of the report does not match your requirements, 20% is equivalent to 3 working days of free work, applicable once)
- Free data Pack on the Five and Enterprise User License. (Excel version of the report)
- Free Updated report if the report is 6-12 months old or older.
- 24-hour priority response*
- Free Industry updates and white papers.
Possible Customization with this report (with additional cost and timeline talk to the sales executive to know more)
- Investment Opportunities
- New Product Development/ Product Matrix of Key Players
- Additional company profiles with specific to client's interest
- Additional country or region analysis- market size and forecast
- SWOT Analysis
Key Market Segments
By Service Type
- Professional Service
- Managed Service
By Testing Type
- Functional Testing
- Performance Testing
- Network Testing
- Compatibility Testing
- Usability Testing
- Security Testing
By Application
- Smart Building and Home Automation
- Capillary Network Management
- Smart Utilities
- Vehicle Telematics
- Smart Manufacturing
- Smart Healthcare
- Others
By Region
- North America
- U.S.
- Canada
- Europe
- UK
- Germany
- France
- Italy
- Spain
- Rest of Europe
- Asia-Pacific
- China
- Japan
- India
- Australia
- South Korea
- Rest of Asia-Pacific
- LAMEA
- Latin America
- Middle East
- Africa
Key Market Players:
- Keysight Technologies
- Rapid7, Inc.
- Happiest Minds Technologies
- Praetorian
- Novacoast, Inc.
- Capgemini SE
- HCL Technologies Limited
- Infosys
- AFour Technologies
- Apica
TABLE OF CONTENTS
CHAPTER 1: INTRODUCTION
- 1.1. Report description
- 1.2. Key market segments
- 1.3. Key benefits to the stakeholders
- 1.4. Research Methodology
- 1.4.1. Primary research
- 1.4.2. Secondary research
- 1.4.3. Analyst tools and models
CHAPTER 2: EXECUTIVE SUMMARY
- 2.1. CXO Perspective
CHAPTER 3: MARKET OVERVIEW
- 3.1. Market definition and scope
- 3.2. Key findings
- 3.2.1. Top impacting factors
- 3.2.2. Top investment pockets
- 3.3. Porter's five forces analysis
- 3.3.1. Low bargaining power of suppliers
- 3.3.2. Low threat of new entrants
- 3.3.3. Low threat of substitutes
- 3.3.4. Low intensity of rivalry
- 3.3.5. Low bargaining power of buyers
- 3.4. Market dynamics
- 3.4.1. Drivers
- 3.4.1.1. Rise in importance of DevOps
- 3.4.1.2. Increase in demand for IP testing of IoT devices
- 3.4.1.3. The increased deployment of microservices
- 3.4.1. Drivers
- 3.4.2. Restraints
- 3.4.2.1. Lack of consistency among standards for interconnectivity and interoperability
- 3.4.3. Opportunities
- 3.4.3.1. Increasing demand for API monitoring
- 3.4.3.2. The increase in adoption of smart city concepts
- 3.5. COVID-19 Impact Analysis on the market
CHAPTER 4: IOT TESTING MARKET, BY SERVICE TYPE
- 4.1. Overview
- 4.1.1. Market size and forecast
- 4.2. Professional Service
- 4.2.1. Key market trends, growth factors and opportunities
- 4.2.2. Market size and forecast, by region
- 4.2.3. Market share analysis by country
- 4.3. Managed Service
- 4.3.1. Key market trends, growth factors and opportunities
- 4.3.2. Market size and forecast, by region
- 4.3.3. Market share analysis by country
CHAPTER 5: IOT TESTING MARKET, BY TESTING TYPE
- 5.1. Overview
- 5.1.1. Market size and forecast
- 5.2. Functional Testing
- 5.2.1. Key market trends, growth factors and opportunities
- 5.2.2. Market size and forecast, by region
- 5.2.3. Market share analysis by country
- 5.3. Performance Testing
- 5.3.1. Key market trends, growth factors and opportunities
- 5.3.2. Market size and forecast, by region
- 5.3.3. Market share analysis by country
- 5.4. Network Testing
- 5.4.1. Key market trends, growth factors and opportunities
- 5.4.2. Market size and forecast, by region
- 5.4.3. Market share analysis by country
- 5.5. Compatibility Testing
- 5.5.1. Key market trends, growth factors and opportunities
- 5.5.2. Market size and forecast, by region
- 5.5.3. Market share analysis by country
- 5.6. Usability Testing
- 5.6.1. Key market trends, growth factors and opportunities
- 5.6.2. Market size and forecast, by region
- 5.6.3. Market share analysis by country
- 5.7. Security Testing
- 5.7.1. Key market trends, growth factors and opportunities
- 5.7.2. Market size and forecast, by region
- 5.7.3. Market share analysis by country
CHAPTER 6: IOT TESTING MARKET, BY APPLICATION
- 6.1. Overview
- 6.1.1. Market size and forecast
- 6.2. Smart Building and Home Automation
- 6.2.1. Key market trends, growth factors and opportunities
- 6.2.2. Market size and forecast, by region
- 6.2.3. Market share analysis by country
- 6.3. Capillary Network Management
- 6.3.1. Key market trends, growth factors and opportunities
- 6.3.2. Market size and forecast, by region
- 6.3.3. Market share analysis by country
- 6.4. Smart Utilities
- 6.4.1. Key market trends, growth factors and opportunities
- 6.4.2. Market size and forecast, by region
- 6.4.3. Market share analysis by country
- 6.5. Vehicle Telematics
- 6.5.1. Key market trends, growth factors and opportunities
- 6.5.2. Market size and forecast, by region
- 6.5.3. Market share analysis by country
- 6.6. Smart Manufacturing
- 6.6.1. Key market trends, growth factors and opportunities
- 6.6.2. Market size and forecast, by region
- 6.6.3. Market share analysis by country
- 6.7. Smart Healthcare
- 6.7.1. Key market trends, growth factors and opportunities
- 6.7.2. Market size and forecast, by region
- 6.7.3. Market share analysis by country
- 6.8. Others
- 6.8.1. Key market trends, growth factors and opportunities
- 6.8.2. Market size and forecast, by region
- 6.8.3. Market share analysis by country
CHAPTER 7: IOT TESTING MARKET, BY REGION
- 7.1. Overview
- 7.1.1. Market size and forecast By Region
- 7.2. North America
- 7.2.1. Key market trends, growth factors and opportunities
- 7.2.2. Market size and forecast, by Service Type
- 7.2.3. Market size and forecast, by Testing Type
- 7.2.4. Market size and forecast, by Application
- 7.2.5. Market size and forecast, by country
- 7.2.5.1. U.S.
- 7.2.5.1.1. Market size and forecast, by Service Type
- 7.2.5.1.2. Market size and forecast, by Testing Type
- 7.2.5.1.3. Market size and forecast, by Application
- 7.2.5.2. Canada
- 7.2.5.2.1. Market size and forecast, by Service Type
- 7.2.5.2.2. Market size and forecast, by Testing Type
- 7.2.5.2.3. Market size and forecast, by Application
- 7.3. Europe
- 7.3.1. Key market trends, growth factors and opportunities
- 7.3.2. Market size and forecast, by Service Type
- 7.3.3. Market size and forecast, by Testing Type
- 7.3.4. Market size and forecast, by Application
- 7.3.5. Market size and forecast, by country
- 7.3.5.1. UK
- 7.3.5.1.1. Market size and forecast, by Service Type
- 7.3.5.1.2. Market size and forecast, by Testing Type
- 7.3.5.1.3. Market size and forecast, by Application
- 7.3.5.2. Germany
- 7.3.5.2.1. Market size and forecast, by Service Type
- 7.3.5.2.2. Market size and forecast, by Testing Type
- 7.3.5.2.3. Market size and forecast, by Application
- 7.3.5.3. France
- 7.3.5.3.1. Market size and forecast, by Service Type
- 7.3.5.3.2. Market size and forecast, by Testing Type
- 7.3.5.3.3. Market size and forecast, by Application
- 7.3.5.4. Italy
- 7.3.5.4.1. Market size and forecast, by Service Type
- 7.3.5.4.2. Market size and forecast, by Testing Type
- 7.3.5.4.3. Market size and forecast, by Application
- 7.3.5.5. Spain
- 7.3.5.5.1. Market size and forecast, by Service Type
- 7.3.5.5.2. Market size and forecast, by Testing Type
- 7.3.5.5.3. Market size and forecast, by Application
- 7.3.5.6. Rest of Europe
- 7.3.5.6.1. Market size and forecast, by Service Type
- 7.3.5.6.2. Market size and forecast, by Testing Type
- 7.3.5.6.3. Market size and forecast, by Application
- 7.4. Asia-Pacific
- 7.4.1. Key market trends, growth factors and opportunities
- 7.4.2. Market size and forecast, by Service Type
- 7.4.3. Market size and forecast, by Testing Type
- 7.4.4. Market size and forecast, by Application
- 7.4.5. Market size and forecast, by country
- 7.4.5.1. China
- 7.4.5.1.1. Market size and forecast, by Service Type
- 7.4.5.1.2. Market size and forecast, by Testing Type
- 7.4.5.1.3. Market size and forecast, by Application
- 7.4.5.2. Japan
- 7.4.5.2.1. Market size and forecast, by Service Type
- 7.4.5.2.2. Market size and forecast, by Testing Type
- 7.4.5.2.3. Market size and forecast, by Application
- 7.4.5.3. India
- 7.4.5.3.1. Market size and forecast, by Service Type
- 7.4.5.3.2. Market size and forecast, by Testing Type
- 7.4.5.3.3. Market size and forecast, by Application
- 7.4.5.4. Australia
- 7.4.5.4.1. Market size and forecast, by Service Type
- 7.4.5.4.2. Market size and forecast, by Testing Type
- 7.4.5.4.3. Market size and forecast, by Application
- 7.4.5.5. South Korea
- 7.4.5.5.1. Market size and forecast, by Service Type
- 7.4.5.5.2. Market size and forecast, by Testing Type
- 7.4.5.5.3. Market size and forecast, by Application
- 7.4.5.6. Rest of Asia-Pacific
- 7.4.5.6.1. Market size and forecast, by Service Type
- 7.4.5.6.2. Market size and forecast, by Testing Type
- 7.4.5.6.3. Market size and forecast, by Application
- 7.5. LAMEA
- 7.5.1. Key market trends, growth factors and opportunities
- 7.5.2. Market size and forecast, by Service Type
- 7.5.3. Market size and forecast, by Testing Type
- 7.5.4. Market size and forecast, by Application
- 7.5.5. Market size and forecast, by country
- 7.5.5.1. Latin America
- 7.5.5.1.1. Market size and forecast, by Service Type
- 7.5.5.1.2. Market size and forecast, by Testing Type
- 7.5.5.1.3. Market size and forecast, by Application
- 7.5.5.2. Middle East
- 7.5.5.2.1. Market size and forecast, by Service Type
- 7.5.5.2.2. Market size and forecast, by Testing Type
- 7.5.5.2.3. Market size and forecast, by Application
- 7.5.5.3. Africa
- 7.5.5.3.1. Market size and forecast, by Service Type
- 7.5.5.3.2. Market size and forecast, by Testing Type
- 7.5.5.3.3. Market size and forecast, by Application
CHAPTER 8: COMPETITIVE LANDSCAPE
- 8.1. Introduction
- 8.2. Top winning strategies
- 8.3. Product Mapping of Top 10 Player
- 8.4. Competitive Dashboard
- 8.5. Competitive Heatmap
- 8.6. Top player positioning, 2022
CHAPTER 9: COMPANY PROFILES
- 9.1. AFour Technologies
- 9.1.1. Company overview
- 9.1.2. Key Executives
- 9.1.3. Company snapshot
- 9.1.4. Operating business segments
- 9.1.5. Product portfolio
- 9.2. Apica
- 9.2.1. Company overview
- 9.2.2. Key Executives
- 9.2.3. Company snapshot
- 9.2.4. Operating business segments
- 9.2.5. Product portfolio
- 9.3. Novacoast, Inc.
- 9.3.1. Company overview
- 9.3.2. Key Executives
- 9.3.3. Company snapshot
- 9.3.4. Operating business segments
- 9.3.5. Product portfolio
- 9.3.6. Key strategic moves and developments
- 9.4. Capgemini SE
- 9.4.1. Company overview
- 9.4.2. Key Executives
- 9.4.3. Company snapshot
- 9.4.4. Operating business segments
- 9.4.5. Product portfolio
- 9.4.6. Business performance
- 9.4.7. Key strategic moves and developments
- 9.5. Happiest Minds Technologies
- 9.5.1. Company overview
- 9.5.2. Key Executives
- 9.5.3. Company snapshot
- 9.5.4. Operating business segments
- 9.5.5. Product portfolio
- 9.5.6. Business performance
- 9.5.7. Key strategic moves and developments
- 9.6. HCL Technologies Limited
- 9.6.1. Company overview
- 9.6.2. Key Executives
- 9.6.3. Company snapshot
- 9.6.4. Operating business segments
- 9.6.5. Product portfolio
- 9.6.6. Business performance
- 9.6.7. Key strategic moves and developments
- 9.7. Infosys
- 9.7.1. Company overview
- 9.7.2. Key Executives
- 9.7.3. Company snapshot
- 9.7.4. Operating business segments
- 9.7.5. Product portfolio
- 9.7.6. Business performance
- 9.7.7. Key strategic moves and developments
- 9.8. Keysight Technologies
- 9.8.1. Company overview
- 9.8.2. Key Executives
- 9.8.3. Company snapshot
- 9.8.4. Operating business segments
- 9.8.5. Product portfolio
- 9.8.6. Business performance
- 9.8.7. Key strategic moves and developments
- 9.9. Praetorian
- 9.9.1. Company overview
- 9.9.2. Key Executives
- 9.9.3. Company snapshot
- 9.9.4. Operating business segments
- 9.9.5. Product portfolio
- 9.9.6. Key strategic moves and developments
- 9.10. Rapid7, Inc.
- 9.10.1. Company overview
- 9.10.2. Key Executives
- 9.10.3. Company snapshot
- 9.10.4. Operating business segments
- 9.10.5. Product portfolio
- 9.10.6. Business performance
- 9.10.7. Key strategic moves and developments
LIST OF TABLES
- TABLE 01. GLOBAL IOT TESTING MARKET, BY SERVICE TYPE, 2022-2032 ($MILLION)
- TABLE 02. IOT TESTING MARKET FOR PROFESSIONAL SERVICE, BY REGION, 2022-2032 ($MILLION)
- TABLE 03. IOT TESTING MARKET FOR MANAGED SERVICE, BY REGION, 2022-2032 ($MILLION)
- TABLE 04. GLOBAL IOT TESTING MARKET, BY TESTING TYPE, 2022-2032 ($MILLION)
- TABLE 05. IOT TESTING MARKET FOR FUNCTIONAL TESTING, BY REGION, 2022-2032 ($MILLION)
- TABLE 06. IOT TESTING MARKET FOR PERFORMANCE TESTING, BY REGION, 2022-2032 ($MILLION)
- TABLE 07. IOT TESTING MARKET FOR NETWORK TESTING, BY REGION, 2022-2032 ($MILLION)
- TABLE 08. IOT TESTING MARKET FOR COMPATIBILITY TESTING, BY REGION, 2022-2032 ($MILLION)
- TABLE 09. IOT TESTING MARKET FOR USABILITY TESTING, BY REGION, 2022-2032 ($MILLION)
- TABLE 10. IOT TESTING MARKET FOR SECURITY TESTING, BY REGION, 2022-2032 ($MILLION)
- TABLE 11. GLOBAL IOT TESTING MARKET, BY APPLICATION, 2022-2032 ($MILLION)
- TABLE 12. IOT TESTING MARKET FOR SMART BUILDING AND HOME AUTOMATION, BY REGION, 2022-2032 ($MILLION)
- TABLE 13. IOT TESTING MARKET FOR CAPILLARY NETWORK MANAGEMENT, BY REGION, 2022-2032 ($MILLION)
- TABLE 14. IOT TESTING MARKET FOR SMART UTILITIES, BY REGION, 2022-2032 ($MILLION)
- TABLE 15. IOT TESTING MARKET FOR VEHICLE TELEMATICS, BY REGION, 2022-2032 ($MILLION)
- TABLE 16. IOT TESTING MARKET FOR SMART MANUFACTURING, BY REGION, 2022-2032 ($MILLION)
- TABLE 17. IOT TESTING MARKET FOR SMART HEALTHCARE, BY REGION, 2022-2032 ($MILLION)
- TABLE 18. IOT TESTING MARKET FOR OTHERS, BY REGION, 2022-2032 ($MILLION)
- TABLE 19. IOT TESTING MARKET, BY REGION, 2022-2032 ($MILLION)
- TABLE 20. NORTH AMERICA IOT TESTING MARKET, BY SERVICE TYPE, 2022-2032 ($MILLION)
- TABLE 21. NORTH AMERICA IOT TESTING MARKET, BY TESTING TYPE, 2022-2032 ($MILLION)
- TABLE 22. NORTH AMERICA IOT TESTING MARKET, BY APPLICATION, 2022-2032 ($MILLION)
- TABLE 23. NORTH AMERICA IOT TESTING MARKET, BY COUNTRY, 2022-2032 ($MILLION)
- TABLE 24. U.S. IOT TESTING MARKET, BY SERVICE TYPE, 2022-2032 ($MILLION)
- TABLE 25. U.S. IOT TESTING MARKET, BY TESTING TYPE, 2022-2032 ($MILLION)
- TABLE 26. U.S. IOT TESTING MARKET, BY APPLICATION, 2022-2032 ($MILLION)
- TABLE 27. CANADA IOT TESTING MARKET, BY SERVICE TYPE, 2022-2032 ($MILLION)
- TABLE 28. CANADA IOT TESTING MARKET, BY TESTING TYPE, 2022-2032 ($MILLION)
- TABLE 29. CANADA IOT TESTING MARKET, BY APPLICATION, 2022-2032 ($MILLION)
- TABLE 30. EUROPE IOT TESTING MARKET, BY SERVICE TYPE, 2022-2032 ($MILLION)
- TABLE 31. EUROPE IOT TESTING MARKET, BY TESTING TYPE, 2022-2032 ($MILLION)
- TABLE 32. EUROPE IOT TESTING MARKET, BY APPLICATION, 2022-2032 ($MILLION)
- TABLE 33. EUROPE IOT TESTING MARKET, BY COUNTRY, 2022-2032 ($MILLION)
- TABLE 34. UK IOT TESTING MARKET, BY SERVICE TYPE, 2022-2032 ($MILLION)
- TABLE 35. UK IOT TESTING MARKET, BY TESTING TYPE, 2022-2032 ($MILLION)
- TABLE 36. UK IOT TESTING MARKET, BY APPLICATION, 2022-2032 ($MILLION)
- TABLE 37. GERMANY IOT TESTING MARKET, BY SERVICE TYPE, 2022-2032 ($MILLION)
- TABLE 38. GERMANY IOT TESTING MARKET, BY TESTING TYPE, 2022-2032 ($MILLION)
- TABLE 39. GERMANY IOT TESTING MARKET, BY APPLICATION, 2022-2032 ($MILLION)
- TABLE 40. FRANCE IOT TESTING MARKET, BY SERVICE TYPE, 2022-2032 ($MILLION)
- TABLE 41. FRANCE IOT TESTING MARKET, BY TESTING TYPE, 2022-2032 ($MILLION)
- TABLE 42. FRANCE IOT TESTING MARKET, BY APPLICATION, 2022-2032 ($MILLION)
- TABLE 43. ITALY IOT TESTING MARKET, BY SERVICE TYPE, 2022-2032 ($MILLION)
- TABLE 44. ITALY IOT TESTING MARKET, BY TESTING TYPE, 2022-2032 ($MILLION)
- TABLE 45. ITALY IOT TESTING MARKET, BY APPLICATION, 2022-2032 ($MILLION)
- TABLE 46. SPAIN IOT TESTING MARKET, BY SERVICE TYPE, 2022-2032 ($MILLION)
- TABLE 47. SPAIN IOT TESTING MARKET, BY TESTING TYPE, 2022-2032 ($MILLION)
- TABLE 48. SPAIN IOT TESTING MARKET, BY APPLICATION, 2022-2032 ($MILLION)
- TABLE 49. REST OF EUROPE IOT TESTING MARKET, BY SERVICE TYPE, 2022-2032 ($MILLION)
- TABLE 50. REST OF EUROPE IOT TESTING MARKET, BY TESTING TYPE, 2022-2032 ($MILLION)
- TABLE 51. REST OF EUROPE IOT TESTING MARKET, BY APPLICATION, 2022-2032 ($MILLION)
- TABLE 52. ASIA-PACIFIC IOT TESTING MARKET, BY SERVICE TYPE, 2022-2032 ($MILLION)
- TABLE 53. ASIA-PACIFIC IOT TESTING MARKET, BY TESTING TYPE, 2022-2032 ($MILLION)
- TABLE 54. ASIA-PACIFIC IOT TESTING MARKET, BY APPLICATION, 2022-2032 ($MILLION)
- TABLE 55. ASIA-PACIFIC IOT TESTING MARKET, BY COUNTRY, 2022-2032 ($MILLION)
- TABLE 56. CHINA IOT TESTING MARKET, BY SERVICE TYPE, 2022-2032 ($MILLION)
- TABLE 57. CHINA IOT TESTING MARKET, BY TESTING TYPE, 2022-2032 ($MILLION)
- TABLE 58. CHINA IOT TESTING MARKET, BY APPLICATION, 2022-2032 ($MILLION)
- TABLE 59. JAPAN IOT TESTING MARKET, BY SERVICE TYPE, 2022-2032 ($MILLION)
- TABLE 60. JAPAN IOT TESTING MARKET, BY TESTING TYPE, 2022-2032 ($MILLION)
- TABLE 61. JAPAN IOT TESTING MARKET, BY APPLICATION, 2022-2032 ($MILLION)
- TABLE 62. INDIA IOT TESTING MARKET, BY SERVICE TYPE, 2022-2032 ($MILLION)
- TABLE 63. INDIA IOT TESTING MARKET, BY TESTING TYPE, 2022-2032 ($MILLION)
- TABLE 64. INDIA IOT TESTING MARKET, BY APPLICATION, 2022-2032 ($MILLION)
- TABLE 65. AUSTRALIA IOT TESTING MARKET, BY SERVICE TYPE, 2022-2032 ($MILLION)
- TABLE 66. AUSTRALIA IOT TESTING MARKET, BY TESTING TYPE, 2022-2032 ($MILLION)
- TABLE 67. AUSTRALIA IOT TESTING MARKET, BY APPLICATION, 2022-2032 ($MILLION)
- TABLE 68. SOUTH KOREA IOT TESTING MARKET, BY SERVICE TYPE, 2022-2032 ($MILLION)
- TABLE 69. SOUTH KOREA IOT TESTING MARKET, BY TESTING TYPE, 2022-2032 ($MILLION)
- TABLE 70. SOUTH KOREA IOT TESTING MARKET, BY APPLICATION, 2022-2032 ($MILLION)
- TABLE 71. REST OF ASIA-PACIFIC IOT TESTING MARKET, BY SERVICE TYPE, 2022-2032 ($MILLION)
- TABLE 72. REST OF ASIA-PACIFIC IOT TESTING MARKET, BY TESTING TYPE, 2022-2032 ($MILLION)
- TABLE 73. REST OF ASIA-PACIFIC IOT TESTING MARKET, BY APPLICATION, 2022-2032 ($MILLION)
- TABLE 74. LAMEA IOT TESTING MARKET, BY SERVICE TYPE, 2022-2032 ($MILLION)
- TABLE 75. LAMEA IOT TESTING MARKET, BY TESTING TYPE, 2022-2032 ($MILLION)
- TABLE 76. LAMEA IOT TESTING MARKET, BY APPLICATION, 2022-2032 ($MILLION)
- TABLE 77. LAMEA IOT TESTING MARKET, BY COUNTRY, 2022-2032 ($MILLION)
- TABLE 78. LATIN AMERICA IOT TESTING MARKET, BY SERVICE TYPE, 2022-2032 ($MILLION)
- TABLE 79. LATIN AMERICA IOT TESTING MARKET, BY TESTING TYPE, 2022-2032 ($MILLION)
- TABLE 80. LATIN AMERICA IOT TESTING MARKET, BY APPLICATION, 2022-2032 ($MILLION)
- TABLE 81. MIDDLE EAST IOT TESTING MARKET, BY SERVICE TYPE, 2022-2032 ($MILLION)
- TABLE 82. MIDDLE EAST IOT TESTING MARKET, BY TESTING TYPE, 2022-2032 ($MILLION)
- TABLE 83. MIDDLE EAST IOT TESTING MARKET, BY APPLICATION, 2022-2032 ($MILLION)
- TABLE 84. AFRICA IOT TESTING MARKET, BY SERVICE TYPE, 2022-2032 ($MILLION)
- TABLE 85. AFRICA IOT TESTING MARKET, BY TESTING TYPE, 2022-2032 ($MILLION)
- TABLE 86. AFRICA IOT TESTING MARKET, BY APPLICATION, 2022-2032 ($MILLION)
- TABLE 87. AFOUR TECHNOLOGIES: KEY EXECUTIVES
- TABLE 88. AFOUR TECHNOLOGIES: COMPANY SNAPSHOT
- TABLE 89. AFOUR TECHNOLOGIES: SERVICE SEGMENTS
- TABLE 90. AFOUR TECHNOLOGIES: PRODUCT PORTFOLIO
- TABLE 91. APICA: KEY EXECUTIVES
- TABLE 92. APICA: COMPANY SNAPSHOT
- TABLE 93. APICA: SERVICE SEGMENTS
- TABLE 94. APICA: PRODUCT PORTFOLIO
- TABLE 95. NOVACOAST, INC.: KEY EXECUTIVES
- TABLE 96. NOVACOAST, INC.: COMPANY SNAPSHOT
- TABLE 97. NOVACOAST, INC.: SERVICE SEGMENTS
- TABLE 98. NOVACOAST, INC.: PRODUCT PORTFOLIO
- TABLE 99. NOVACOAST, INC.: KEY STRATERGIES
- TABLE 100. CAPGEMINI SE: KEY EXECUTIVES
- TABLE 101. CAPGEMINI SE: COMPANY SNAPSHOT
- TABLE 102. CAPGEMINI SE: PRODUCT SEGMENTS
- TABLE 103. CAPGEMINI SE: PRODUCT PORTFOLIO
- TABLE 104. CAPGEMINI SE: KEY STRATERGIES
- TABLE 105. HAPPIEST MINDS TECHNOLOGIES: KEY EXECUTIVES
- TABLE 106. HAPPIEST MINDS TECHNOLOGIES: COMPANY SNAPSHOT
- TABLE 107. HAPPIEST MINDS TECHNOLOGIES: SERVICE SEGMENTS
- TABLE 108. HAPPIEST MINDS TECHNOLOGIES: PRODUCT PORTFOLIO
- TABLE 109. HAPPIEST MINDS TECHNOLOGIES: KEY STRATERGIES
- TABLE 110. HCL TECHNOLOGIES LIMITED: KEY EXECUTIVES
- TABLE 111. HCL TECHNOLOGIES LIMITED: COMPANY SNAPSHOT
- TABLE 112. HCL TECHNOLOGIES LIMITED: SERVICE SEGMENTS
- TABLE 113. HCL TECHNOLOGIES LIMITED: PRODUCT PORTFOLIO
- TABLE 114. HCL TECHNOLOGIES LIMITED: KEY STRATERGIES
- TABLE 115. INFOSYS: KEY EXECUTIVES
- TABLE 116. INFOSYS: COMPANY SNAPSHOT
- TABLE 117. INFOSYS: PRODUCT SEGMENTS
- TABLE 118. INFOSYS: PRODUCT PORTFOLIO
- TABLE 119. INFOSYS: KEY STRATERGIES
- TABLE 120. KEYSIGHT TECHNOLOGIES: KEY EXECUTIVES
- TABLE 121. KEYSIGHT TECHNOLOGIES: COMPANY SNAPSHOT
- TABLE 122. KEYSIGHT TECHNOLOGIES: PRODUCT SEGMENTS
- TABLE 123. KEYSIGHT TECHNOLOGIES: PRODUCT PORTFOLIO
- TABLE 124. KEYSIGHT TECHNOLOGIES: KEY STRATERGIES
- TABLE 125. PRAETORIAN: KEY EXECUTIVES
- TABLE 126. PRAETORIAN: COMPANY SNAPSHOT
- TABLE 127. PRAETORIAN: SERVICE SEGMENTS
- TABLE 128. PRAETORIAN: PRODUCT PORTFOLIO
- TABLE 129. PRAETORIAN: KEY STRATERGIES
- TABLE 130. RAPID7, INC.: KEY EXECUTIVES
- TABLE 131. RAPID7, INC.: COMPANY SNAPSHOT
- TABLE 132. RAPID7, INC.: PRODUCT SEGMENTS
- TABLE 133. RAPID7, INC.: PRODUCT PORTFOLIO
- TABLE 134. RAPID7, INC.: KEY STRATERGIES
LIST OF FIGURES
- FIGURE 01. IOT TESTING MARKET, 2022-2032
- FIGURE 02. SEGMENTATION OF IOT TESTING MARKET,2022-2032
- FIGURE 03. TOP INVESTMENT POCKETS IN IOT TESTING MARKET (2023-2032)
- FIGURE 04. LOW BARGAINING POWER OF SUPPLIERS
- FIGURE 05. LOW THREAT OF NEW ENTRANTS
- FIGURE 06. LOW THREAT OF SUBSTITUTES
- FIGURE 07. LOW INTENSITY OF RIVALRY
- FIGURE 08. LOW BARGAINING POWER OF BUYERS
- FIGURE 09. GLOBAL IOT TESTING MARKET:DRIVERS, RESTRAINTS AND OPPORTUNITIES
- FIGURE 10. IOT TESTING MARKET, BY SERVICE TYPE, 2022(%)
- FIGURE 11. COMPARATIVE SHARE ANALYSIS OF IOT TESTING MARKET FOR PROFESSIONAL SERVICE, BY COUNTRY 2022 AND 2032(%)
- FIGURE 12. COMPARATIVE SHARE ANALYSIS OF IOT TESTING MARKET FOR MANAGED SERVICE, BY COUNTRY 2022 AND 2032(%)
- FIGURE 13. IOT TESTING MARKET, BY TESTING TYPE, 2022(%)
- FIGURE 14. COMPARATIVE SHARE ANALYSIS OF IOT TESTING MARKET FOR FUNCTIONAL TESTING, BY COUNTRY 2022 AND 2032(%)
- FIGURE 15. COMPARATIVE SHARE ANALYSIS OF IOT TESTING MARKET FOR PERFORMANCE TESTING, BY COUNTRY 2022 AND 2032(%)
- FIGURE 16. COMPARATIVE SHARE ANALYSIS OF IOT TESTING MARKET FOR NETWORK TESTING, BY COUNTRY 2022 AND 2032(%)
- FIGURE 17. COMPARATIVE SHARE ANALYSIS OF IOT TESTING MARKET FOR COMPATIBILITY TESTING, BY COUNTRY 2022 AND 2032(%)
- FIGURE 18. COMPARATIVE SHARE ANALYSIS OF IOT TESTING MARKET FOR USABILITY TESTING, BY COUNTRY 2022 AND 2032(%)
- FIGURE 19. COMPARATIVE SHARE ANALYSIS OF IOT TESTING MARKET FOR SECURITY TESTING, BY COUNTRY 2022 AND 2032(%)
- FIGURE 20. IOT TESTING MARKET, BY APPLICATION, 2022(%)
- FIGURE 21. COMPARATIVE SHARE ANALYSIS OF IOT TESTING MARKET FOR SMART BUILDING AND HOME AUTOMATION, BY COUNTRY 2022 AND 2032(%)
- FIGURE 22. COMPARATIVE SHARE ANALYSIS OF IOT TESTING MARKET FOR CAPILLARY NETWORK MANAGEMENT, BY COUNTRY 2022 AND 2032(%)
- FIGURE 23. COMPARATIVE SHARE ANALYSIS OF IOT TESTING MARKET FOR SMART UTILITIES, BY COUNTRY 2022 AND 2032(%)
- FIGURE 24. COMPARATIVE SHARE ANALYSIS OF IOT TESTING MARKET FOR VEHICLE TELEMATICS, BY COUNTRY 2022 AND 2032(%)
- FIGURE 25. COMPARATIVE SHARE ANALYSIS OF IOT TESTING MARKET FOR SMART MANUFACTURING, BY COUNTRY 2022 AND 2032(%)
- FIGURE 26. COMPARATIVE SHARE ANALYSIS OF IOT TESTING MARKET FOR SMART HEALTHCARE, BY COUNTRY 2022 AND 2032(%)
- FIGURE 27. COMPARATIVE SHARE ANALYSIS OF IOT TESTING MARKET FOR OTHERS, BY COUNTRY 2022 AND 2032(%)
- FIGURE 28. IOT TESTING MARKET BY REGION, 2022(%)
- FIGURE 29. U.S. IOT TESTING MARKET, 2022-2032 ($MILLION)
- FIGURE 30. CANADA IOT TESTING MARKET, 2022-2032 ($MILLION)
- FIGURE 31. UK IOT TESTING MARKET, 2022-2032 ($MILLION)
- FIGURE 32. GERMANY IOT TESTING MARKET, 2022-2032 ($MILLION)
- FIGURE 33. FRANCE IOT TESTING MARKET, 2022-2032 ($MILLION)
- FIGURE 34. ITALY IOT TESTING MARKET, 2022-2032 ($MILLION)
- FIGURE 35. SPAIN IOT TESTING MARKET, 2022-2032 ($MILLION)
- FIGURE 36. REST OF EUROPE IOT TESTING MARKET, 2022-2032 ($MILLION)
- FIGURE 37. CHINA IOT TESTING MARKET, 2022-2032 ($MILLION)
- FIGURE 38. JAPAN IOT TESTING MARKET, 2022-2032 ($MILLION)
- FIGURE 39. INDIA IOT TESTING MARKET, 2022-2032 ($MILLION)
- FIGURE 40. AUSTRALIA IOT TESTING MARKET, 2022-2032 ($MILLION)
- FIGURE 41. SOUTH KOREA IOT TESTING MARKET, 2022-2032 ($MILLION)
- FIGURE 42. REST OF ASIA-PACIFIC IOT TESTING MARKET, 2022-2032 ($MILLION)
- FIGURE 43. LATIN AMERICA IOT TESTING MARKET, 2022-2032 ($MILLION)
- FIGURE 44. MIDDLE EAST IOT TESTING MARKET, 2022-2032 ($MILLION)
- FIGURE 45. AFRICA IOT TESTING MARKET, 2022-2032 ($MILLION)
- FIGURE 46. TOP WINNING STRATEGIES, BY YEAR (2020-2023)
- FIGURE 47. TOP WINNING STRATEGIES, BY DEVELOPMENT (2020-2023)
- FIGURE 48. TOP WINNING STRATEGIES, BY COMPANY (2020-2023)
- FIGURE 49. PRODUCT MAPPING OF TOP 10 PLAYERS
- FIGURE 50. COMPETITIVE DASHBOARD
- FIGURE 51. COMPETITIVE HEATMAP: IOT TESTING MARKET
- FIGURE 52. TOP PLAYER POSITIONING, 2022
- FIGURE 53. CAPGEMINI SE: NET SALES, 2019-2021 ($MILLION)
- FIGURE 54. CAPGEMINI SE: REVENUE SHARE BY SEGMENT, 2021 (%)
- FIGURE 55. CAPGEMINI SE: REVENUE SHARE BY REGION, 2021 (%)
- FIGURE 56. HAPPIEST MINDS TECHNOLOGIES: NET REVENUE, 2020-2022 ($MILLION)
- FIGURE 57. HAPPIEST MINDS TECHNOLOGIES: REVENUE SHARE BY SEGMENT, 2022 (%)
- FIGURE 58. HAPPIEST MINDS TECHNOLOGIES: REVENUE SHARE BY REGION, 2022 (%)
- FIGURE 59. HCL TECHNOLOGIES LIMITED: NET REVENUE, 2020-2022 ($MILLION)
- FIGURE 60. HCL TECHNOLOGIES LIMITED: RESEARCH & DEVELOPMENT EXPENDITURE, 2020-2022 ($MILLION)
- FIGURE 61. HCL TECHNOLOGIES LIMITED: REVENUE SHARE BY SEGMENT, 2022 (%)
- FIGURE 62. HCL TECHNOLOGIES LIMITED: REVENUE SHARE BY REGION, 2022 (%)
- FIGURE 63. INFOSYS: NET SALES, 2019-2021 ($MILLION)
- FIGURE 64. KEYSIGHT TECHNOLOGIES: NET REVENUE, 2020-2022 ($MILLION)
- FIGURE 65. KEYSIGHT TECHNOLOGIES: RESEARCH & DEVELOPMENT EXPENDITURE, 2020-2022 ($MILLION)
- FIGURE 66. KEYSIGHT TECHNOLOGIES: REVENUE SHARE BY SEGMENT, 2022 (%)
- FIGURE 67. KEYSIGHT TECHNOLOGIES: REVENUE SHARE BY REGION, 2022 (%)
- FIGURE 68. RAPID7, INC.: NET REVENUE, 2020-2022 ($MILLION)
- FIGURE 69. RAPID7, INC.: RESEARCH & DEVELOPMENT EXPENDITURE, 2020-2022 ($MILLION)
- FIGURE 70. RAPID7, INC.: REVENUE SHARE BY SEGMENT, 2022 (%)
- FIGURE 71. RAPID7, INC.: REVENUE SHARE BY REGION, 2022 (%)

