
PUBLISHER: Allied Market Research | PRODUCT CODE: 1365844

PUBLISHER: Allied Market Research | PRODUCT CODE: 1365844
POLED Panel Market By Type (Flexible pOLED Displays, Foldable pOLED Displays, Others), By Application (Smartphones, Wearables): Global Opportunity Analysis and Industry Forecast, 2023-2032
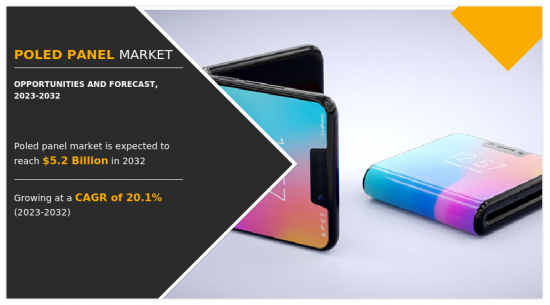
According to a new report published by Allied Market Research, titled, "POLED Panel Market," The poled panel market was valued at $836.82 million in 2022, and is estimated to reach $5.2 billion by 2032, growing at a CAGR of 20.1% from 2023 to 2032.
The fundamental structure of a POLED panel consists of several layers between two electrodes, including an anode, a hole transport layer, an emissive layer with organic materials, and a cathode. When an electric current is applied, the positive and negative charge carriers meet in the emissive layer, leading to light emission. The flexibility of the plastic substrate enables the creation of curved and flexible displays, making them ideal for innovative and unique designs in electronic devices.
POLED panels offer numerous advantages over other display technologies. One of the key benefits is their self-emissive property, meaning each pixel emits its light, eliminating the need for a separate backlight. This enhances energy efficiency as only active pixels consume power, making POLED panels more power-efficient than LCDs. Moreover, their lack of a backlight allows POLED panels to achieve deep blacks and improved contrast, resulting in superior image quality and sharper visuals. In addition, the flexibility of the plastic substrate opens up new possibilities for foldable and rollable displays, paving the way for exciting applications in consumer electronics, wearables, automotive displays, and smart clothing.
Despite these advantages, POLED panels face challenges related to the long-term stability of organic materials, which degrade over time and affect the display's longevity. Manufacturers are actively working on refining materials and technologies to overcome these issues and advance POLED panel technology further.
The POLED panel market analysis is expected to expand significantly during the forecast period owing to the increase in use of POLED panel in automotive industry, and surge in energy efficient POLED panel for wearables. In addition, during the forecast period, the POLED panel market is anticipated to benefit from surge in use of POLED panels for consumer electronics, and healthcare application. On the contrary, the high manufacturing costs and complex fabrication process associated with POLED panels is the restraint for POLED panel market growth during the forecast period.
The POLED panel market is segmented into type, application, and region. On the basis of type, the market is classified into flexible pOLED displays, foldable pOLED displays, and others. In 2022, the flexible pOLED displays segment dominated the market, and it is expected to acquire a major market share till 2032. Depending on application, the market is categorized into smartphones and wearables. The smartphones segment acquired the largest share in 2022 and wearables segment is expected to grow at a significant CAGR from 2023 to 2032.
Region-wise, the POLED panel market trends are analyzed across North America (the U.S., Canada, and Mexico), Europe (UK, Germany, France, and rest of Europe), Asia-Pacific (China, Japan, India, South Korea, and rest of Asia-Pacific), and LAMEA (Latin America, Middle East, and Africa).
Competitive analysis and profiles of the major POLED panel market players that have been provided in the report include LG DISPLAY CO., LTD., Motorola Mobility LLC (Lenovo), Google (Alphabet Inc.), and Apple Inc. The key strategies adopted by the major players of the POLED panel market are product launch and business expansion.
Key Benefits For Stakeholders
- This report provides a quantitative analysis of the market segments, current trends, estimations, and dynamics of the poled panel market analysis from 2022 to 2032 to identify the prevailing poled panel market opportunities.
- The market research is offered along with information related to key drivers, restraints, and opportunities.
- Porter's five forces analysis highlights the potency of buyers and suppliers to enable stakeholders make profit-oriented business decisions and strengthen their supplier-buyer network.
- In-depth analysis of the poled panel market segmentation assists to determine the prevailing market opportunities.
- Major countries in each region are mapped according to their revenue contribution to the global market.
- Market player positioning facilitates benchmarking and provides a clear understanding of the present position of the market players.
- The report includes the analysis of the regional as well as global poled panel market trends, key players, market segments, application areas, and market growth strategies.
Additional benefits you will get with this purchase are:
- Quarterly Update and* (only available with a corporate license, on listed price)
- 5 additional Company Profile of client Choice pre- or Post-purchase, as a free update.
- Free Upcoming Version on the Purchase of Five and Enterprise User License.
- 16 analyst hours of support* (post-purchase, if you find additional data requirements upon review of the report, you may receive support amounting to 16 analyst hours to solve questions, and post-sale queries)
- 15% Free Customization* (in case the scope or segment of the report does not match your requirements, 20% is equivalent to 3 working days of free work, applicable once)
- Free data Pack on the Five and Enterprise User License. (Excel version of the report)
- Free Updated report if the report is 6-12 months old or older.
- 24-hour priority response*
- Free Industry updates and white papers.
Possible Customization with this report (with additional cost and timeline talk to the sales executive to know more)
- Upcoming/New Entrant by Regions
- New Product Development/ Product Matrix of Key Players
- Key player details (including location, contact details, supplier/vendor network etc. in excel format)
- List of customers/consumers/raw material suppliers- value chain analysis
Key Market Segments
By Type
- Flexible pOLED Displays
- Foldable pOLED Displays
- Others
By Application
- Smartphones
- Wearables
By Region
- North America
- U.S.
- Canada
- Mexico
- Europe
- UK
- Germany
- France
- Rest of Europe
- Asia-Pacific
- China
- Japan
- India
- South Korea
- Rest of Asia-Pacific
- LAMEA
- Latin America
- Middle East
- Africa
Key Market Players:
- Apple Inc.
- LG DISPLAY CO., LTD.
- Google (Alphabet Inc.)
- Motorola Mobility LLC (Lenovo)
TABLE OF CONTENTS
CHAPTER 1: INTRODUCTION
- 1.1. Report description
- 1.2. Key market segments
- 1.3. Key benefits to the stakeholders
- 1.4. Research Methodology
- 1.4.1. Primary research
- 1.4.2. Secondary research
- 1.4.3. Analyst tools and models
CHAPTER 2: EXECUTIVE SUMMARY
- 2.1. CXO Perspective
CHAPTER 3: MARKET OVERVIEW
- 3.1. Market definition and scope
- 3.2. Key findings
- 3.2.1. Top impacting factors
- 3.2.2. Top investment pockets
- 3.3. Porter's five forces analysis
- 3.3.1. Low to high bargaining power of suppliers
- 3.3.2. Low to high threat of new entrants
- 3.3.3. Low to high threat of substitutes
- 3.3.4. Low to high intensity of rivalry
- 3.3.5. Low bargaining power of buyers
- 3.4. Market dynamics
- 3.4.1. Drivers
- 3.4.1.1. Increase in use of pOLED display in automotive industry.
- 3.4.1.2. Surge in energy efficient pOLED display for wearables.
- 3.4.1. Drivers
- 3.4.2. Restraints
- 3.4.2.1. High manufacturing costs and complex fabrication process
- 3.4.3. Opportunities
- 3.4.3.1. Increase in use of pOLED displays for consumer electronics, and healthcare application.
- 3.5. COVID-19 Impact Analysis on the market
CHAPTER 4: POLED PANEL MARKET, BY TYPE
- 4.1. Overview
- 4.1.1. Market size and forecast
- 4.2. Flexible pOLED Displays
- 4.2.1. Key market trends, growth factors and opportunities
- 4.2.2. Market size and forecast, by region
- 4.2.3. Market share analysis by country
- 4.3. Foldable pOLED Displays
- 4.3.1. Key market trends, growth factors and opportunities
- 4.3.2. Market size and forecast, by region
- 4.3.3. Market share analysis by country
- 4.4. Others
- 4.4.1. Key market trends, growth factors and opportunities
- 4.4.2. Market size and forecast, by region
- 4.4.3. Market share analysis by country
CHAPTER 5: POLED PANEL MARKET, BY APPLICATION
- 5.1. Overview
- 5.1.1. Market size and forecast
- 5.2. Smartphones
- 5.2.1. Key market trends, growth factors and opportunities
- 5.2.2. Market size and forecast, by region
- 5.2.3. Market share analysis by country
- 5.3. Wearables
- 5.3.1. Key market trends, growth factors and opportunities
- 5.3.2. Market size and forecast, by region
- 5.3.3. Market share analysis by country
CHAPTER 6: POLED PANEL MARKET, BY REGION
- 6.1. Overview
- 6.1.1. Market size and forecast By Region
- 6.2. North America
- 6.2.1. Key market trends, growth factors and opportunities
- 6.2.2. Market size and forecast, by Type
- 6.2.3. Market size and forecast, by Application
- 6.2.4. Market size and forecast, by country
- 6.2.4.1. U.S.
- 6.2.4.1.1. Market size and forecast, by Type
- 6.2.4.1.2. Market size and forecast, by Application
- 6.2.4.2. Canada
- 6.2.4.2.1. Market size and forecast, by Type
- 6.2.4.2.2. Market size and forecast, by Application
- 6.2.4.3. Mexico
- 6.2.4.3.1. Market size and forecast, by Type
- 6.2.4.3.2. Market size and forecast, by Application
- 6.3. Europe
- 6.3.1. Key market trends, growth factors and opportunities
- 6.3.2. Market size and forecast, by Type
- 6.3.3. Market size and forecast, by Application
- 6.3.4. Market size and forecast, by country
- 6.3.4.1. UK
- 6.3.4.1.1. Market size and forecast, by Type
- 6.3.4.1.2. Market size and forecast, by Application
- 6.3.4.2. Germany
- 6.3.4.2.1. Market size and forecast, by Type
- 6.3.4.2.2. Market size and forecast, by Application
- 6.3.4.3. France
- 6.3.4.3.1. Market size and forecast, by Type
- 6.3.4.3.2. Market size and forecast, by Application
- 6.3.4.4. Rest of Europe
- 6.3.4.4.1. Market size and forecast, by Type
- 6.3.4.4.2. Market size and forecast, by Application
- 6.4. Asia-Pacific
- 6.4.1. Key market trends, growth factors and opportunities
- 6.4.2. Market size and forecast, by Type
- 6.4.3. Market size and forecast, by Application
- 6.4.4. Market size and forecast, by country
- 6.4.4.1. China
- 6.4.4.1.1. Market size and forecast, by Type
- 6.4.4.1.2. Market size and forecast, by Application
- 6.4.4.2. Japan
- 6.4.4.2.1. Market size and forecast, by Type
- 6.4.4.2.2. Market size and forecast, by Application
- 6.4.4.3. India
- 6.4.4.3.1. Market size and forecast, by Type
- 6.4.4.3.2. Market size and forecast, by Application
- 6.4.4.4. South Korea
- 6.4.4.4.1. Market size and forecast, by Type
- 6.4.4.4.2. Market size and forecast, by Application
- 6.4.4.5. Rest of Asia-Pacific
- 6.4.4.5.1. Market size and forecast, by Type
- 6.4.4.5.2. Market size and forecast, by Application
- 6.5. LAMEA
- 6.5.1. Key market trends, growth factors and opportunities
- 6.5.2. Market size and forecast, by Type
- 6.5.3. Market size and forecast, by Application
- 6.5.4. Market size and forecast, by country
- 6.5.4.1. Latin America
- 6.5.4.1.1. Market size and forecast, by Type
- 6.5.4.1.2. Market size and forecast, by Application
- 6.5.4.2. Middle East
- 6.5.4.2.1. Market size and forecast, by Type
- 6.5.4.2.2. Market size and forecast, by Application
- 6.5.4.3. Africa
- 6.5.4.3.1. Market size and forecast, by Type
- 6.5.4.3.2. Market size and forecast, by Application
CHAPTER 7: COMPETITIVE LANDSCAPE
- 7.1. Introduction
- 7.2. Top winning strategies
- 7.3. Product Mapping of Top 10 Player
- 7.4. Competitive Dashboard
- 7.5. Competitive Heatmap
- 7.6. Top player positioning, 2022
CHAPTER 8: COMPANY PROFILES
- 8.1. LG DISPLAY CO., LTD.
- 8.1.1. Company overview
- 8.1.2. Key Executives
- 8.1.3. Company snapshot
- 8.1.4. Operating business segments
- 8.1.5. Product portfolio
- 8.1.6. Business performance
- 8.1.7. Key strategic moves and developments
- 8.2. Apple Inc.
- 8.2.1. Company overview
- 8.2.2. Key Executives
- 8.2.3. Company snapshot
- 8.2.4. Operating business segments
- 8.2.5. Product portfolio
- 8.2.6. Business performance
- 8.3. Google (Alphabet Inc.)
- 8.3.1. Company overview
- 8.3.2. Key Executives
- 8.3.3. Company snapshot
- 8.3.4. Operating business segments
- 8.3.5. Product portfolio
- 8.3.6. Business performance
- 8.4. Motorola Mobility LLC (Lenovo)
- 8.4.1. Company overview
- 8.4.2. Key Executives
- 8.4.3. Company snapshot
- 8.4.4. Operating business segments
- 8.4.5. Product portfolio
- 8.4.6. Business performance
- 8.4.7. Key strategic moves and developments
LIST OF TABLES
- TABLE 01. GLOBAL POLED PANEL MARKET, BY TYPE, 2022-2032 ($MILLION)
- TABLE 02. POLED PANEL MARKET FOR FLEXIBLE POLED DISPLAYS, BY REGION, 2022-2032 ($MILLION)
- TABLE 03. POLED PANEL MARKET FOR FOLDABLE POLED DISPLAYS, BY REGION, 2022-2032 ($MILLION)
- TABLE 04. POLED PANEL MARKET FOR OTHERS, BY REGION, 2022-2032 ($MILLION)
- TABLE 05. GLOBAL POLED PANEL MARKET, BY APPLICATION, 2022-2032 ($MILLION)
- TABLE 06. POLED PANEL MARKET FOR SMARTPHONES, BY REGION, 2022-2032 ($MILLION)
- TABLE 07. POLED PANEL MARKET FOR WEARABLES, BY REGION, 2022-2032 ($MILLION)
- TABLE 08. POLED PANEL MARKET, BY REGION, 2022-2032 ($MILLION)
- TABLE 09. NORTH AMERICA POLED PANEL MARKET, BY TYPE, 2022-2032 ($MILLION)
- TABLE 10. NORTH AMERICA POLED PANEL MARKET, BY APPLICATION, 2022-2032 ($MILLION)
- TABLE 11. NORTH AMERICA POLED PANEL MARKET, BY COUNTRY, 2022-2032 ($MILLION)
- TABLE 12. U.S. POLED PANEL MARKET, BY TYPE, 2022-2032 ($MILLION)
- TABLE 13. U.S. POLED PANEL MARKET, BY APPLICATION, 2022-2032 ($MILLION)
- TABLE 14. CANADA POLED PANEL MARKET, BY TYPE, 2022-2032 ($MILLION)
- TABLE 15. CANADA POLED PANEL MARKET, BY APPLICATION, 2022-2032 ($MILLION)
- TABLE 16. MEXICO POLED PANEL MARKET, BY TYPE, 2022-2032 ($MILLION)
- TABLE 17. MEXICO POLED PANEL MARKET, BY APPLICATION, 2022-2032 ($MILLION)
- TABLE 18. EUROPE POLED PANEL MARKET, BY TYPE, 2022-2032 ($MILLION)
- TABLE 19. EUROPE POLED PANEL MARKET, BY APPLICATION, 2022-2032 ($MILLION)
- TABLE 20. EUROPE POLED PANEL MARKET, BY COUNTRY, 2022-2032 ($MILLION)
- TABLE 21. UK POLED PANEL MARKET, BY TYPE, 2022-2032 ($MILLION)
- TABLE 22. UK POLED PANEL MARKET, BY APPLICATION, 2022-2032 ($MILLION)
- TABLE 23. GERMANY POLED PANEL MARKET, BY TYPE, 2022-2032 ($MILLION)
- TABLE 24. GERMANY POLED PANEL MARKET, BY APPLICATION, 2022-2032 ($MILLION)
- TABLE 25. FRANCE POLED PANEL MARKET, BY TYPE, 2022-2032 ($MILLION)
- TABLE 26. FRANCE POLED PANEL MARKET, BY APPLICATION, 2022-2032 ($MILLION)
- TABLE 27. REST OF EUROPE POLED PANEL MARKET, BY TYPE, 2022-2032 ($MILLION)
- TABLE 28. REST OF EUROPE POLED PANEL MARKET, BY APPLICATION, 2022-2032 ($MILLION)
- TABLE 29. ASIA-PACIFIC POLED PANEL MARKET, BY TYPE, 2022-2032 ($MILLION)
- TABLE 30. ASIA-PACIFIC POLED PANEL MARKET, BY APPLICATION, 2022-2032 ($MILLION)
- TABLE 31. ASIA-PACIFIC POLED PANEL MARKET, BY COUNTRY, 2022-2032 ($MILLION)
- TABLE 32. CHINA POLED PANEL MARKET, BY TYPE, 2022-2032 ($MILLION)
- TABLE 33. CHINA POLED PANEL MARKET, BY APPLICATION, 2022-2032 ($MILLION)
- TABLE 34. JAPAN POLED PANEL MARKET, BY TYPE, 2022-2032 ($MILLION)
- TABLE 35. JAPAN POLED PANEL MARKET, BY APPLICATION, 2022-2032 ($MILLION)
- TABLE 36. INDIA POLED PANEL MARKET, BY TYPE, 2022-2032 ($MILLION)
- TABLE 37. INDIA POLED PANEL MARKET, BY APPLICATION, 2022-2032 ($MILLION)
- TABLE 38. SOUTH KOREA POLED PANEL MARKET, BY TYPE, 2022-2032 ($MILLION)
- TABLE 39. SOUTH KOREA POLED PANEL MARKET, BY APPLICATION, 2022-2032 ($MILLION)
- TABLE 40. REST OF ASIA-PACIFIC POLED PANEL MARKET, BY TYPE, 2022-2032 ($MILLION)
- TABLE 41. REST OF ASIA-PACIFIC POLED PANEL MARKET, BY APPLICATION, 2022-2032 ($MILLION)
- TABLE 42. LAMEA POLED PANEL MARKET, BY TYPE, 2022-2032 ($MILLION)
- TABLE 43. LAMEA POLED PANEL MARKET, BY APPLICATION, 2022-2032 ($MILLION)
- TABLE 44. LAMEA POLED PANEL MARKET, BY COUNTRY, 2022-2032 ($MILLION)
- TABLE 45. LATIN AMERICA POLED PANEL MARKET, BY TYPE, 2022-2032 ($MILLION)
- TABLE 46. LATIN AMERICA POLED PANEL MARKET, BY APPLICATION, 2022-2032 ($MILLION)
- TABLE 47. MIDDLE EAST POLED PANEL MARKET, BY TYPE, 2022-2032 ($MILLION)
- TABLE 48. MIDDLE EAST POLED PANEL MARKET, BY APPLICATION, 2022-2032 ($MILLION)
- TABLE 49. AFRICA POLED PANEL MARKET, BY TYPE, 2022-2032 ($MILLION)
- TABLE 50. AFRICA POLED PANEL MARKET, BY APPLICATION, 2022-2032 ($MILLION)
- TABLE 51. LG DISPLAY CO., LTD.: KEY EXECUTIVES
- TABLE 52. LG DISPLAY CO., LTD.: COMPANY SNAPSHOT
- TABLE 53. LG DISPLAY CO., LTD.: PRODUCT SEGMENTS
- TABLE 54. LG DISPLAY CO., LTD.: PRODUCT PORTFOLIO
- TABLE 55. LG DISPLAY CO., LTD.: KEY STRATERGIES
- TABLE 56. APPLE INC.: KEY EXECUTIVES
- TABLE 57. APPLE INC.: COMPANY SNAPSHOT
- TABLE 58. APPLE INC.: SERVICE SEGMENTS
- TABLE 59. APPLE INC.: PRODUCT PORTFOLIO
- TABLE 60. GOOGLE (ALPHABET INC.): KEY EXECUTIVES
- TABLE 61. GOOGLE (ALPHABET INC.): COMPANY SNAPSHOT
- TABLE 62. GOOGLE (ALPHABET INC.): PRODUCT SEGMENTS
- TABLE 63. GOOGLE (ALPHABET INC.): PRODUCT PORTFOLIO
- TABLE 64. MOTOROLA MOBILITY LLC (LENOVO): KEY EXECUTIVES
- TABLE 65. MOTOROLA MOBILITY LLC (LENOVO): COMPANY SNAPSHOT
- TABLE 66. MOTOROLA MOBILITY LLC (LENOVO): PRODUCT SEGMENTS
- TABLE 67. MOTOROLA MOBILITY LLC (LENOVO): PRODUCT PORTFOLIO
- TABLE 68. MOTOROLA MOBILITY LLC (LENOVO): KEY STRATERGIES
LIST OF FIGURES
- FIGURE 01. POLED PANEL MARKET, 2022-2032
- FIGURE 02. SEGMENTATION OF POLED PANEL MARKET,2022-2032
- FIGURE 03. TOP INVESTMENT POCKETS IN POLED PANEL MARKET (2023-2032)
- FIGURE 04. LOW TO HIGH BARGAINING POWER OF SUPPLIERS
- FIGURE 05. LOW TO HIGH THREAT OF NEW ENTRANTS
- FIGURE 06. LOW TO HIGH THREAT OF SUBSTITUTES
- FIGURE 07. LOW TO HIGH INTENSITY OF RIVALRY
- FIGURE 08. LOW BARGAINING POWER OF BUYERS
- FIGURE 09. GLOBAL POLED PANEL MARKET:DRIVERS, RESTRAINTS AND OPPORTUNITIES
- FIGURE 10. POLED PANEL MARKET, BY TYPE, 2022(%)
- FIGURE 11. COMPARATIVE SHARE ANALYSIS OF POLED PANEL MARKET FOR FLEXIBLE POLED DISPLAYS, BY COUNTRY 2022 AND 2032(%)
- FIGURE 12. COMPARATIVE SHARE ANALYSIS OF POLED PANEL MARKET FOR FOLDABLE POLED DISPLAYS, BY COUNTRY 2022 AND 2032(%)
- FIGURE 13. COMPARATIVE SHARE ANALYSIS OF POLED PANEL MARKET FOR OTHERS, BY COUNTRY 2022 AND 2032(%)
- FIGURE 14. POLED PANEL MARKET, BY APPLICATION, 2022(%)
- FIGURE 15. COMPARATIVE SHARE ANALYSIS OF POLED PANEL MARKET FOR SMARTPHONES, BY COUNTRY 2022 AND 2032(%)
- FIGURE 16. COMPARATIVE SHARE ANALYSIS OF POLED PANEL MARKET FOR WEARABLES, BY COUNTRY 2022 AND 2032(%)
- FIGURE 17. POLED PANEL MARKET BY REGION, 2022(%)
- FIGURE 18. U.S. POLED PANEL MARKET, 2022-2032 ($MILLION)
- FIGURE 19. CANADA POLED PANEL MARKET, 2022-2032 ($MILLION)
- FIGURE 20. MEXICO POLED PANEL MARKET, 2022-2032 ($MILLION)
- FIGURE 21. UK POLED PANEL MARKET, 2022-2032 ($MILLION)
- FIGURE 22. GERMANY POLED PANEL MARKET, 2022-2032 ($MILLION)
- FIGURE 23. FRANCE POLED PANEL MARKET, 2022-2032 ($MILLION)
- FIGURE 24. REST OF EUROPE POLED PANEL MARKET, 2022-2032 ($MILLION)
- FIGURE 25. CHINA POLED PANEL MARKET, 2022-2032 ($MILLION)
- FIGURE 26. JAPAN POLED PANEL MARKET, 2022-2032 ($MILLION)
- FIGURE 27. INDIA POLED PANEL MARKET, 2022-2032 ($MILLION)
- FIGURE 28. SOUTH KOREA POLED PANEL MARKET, 2022-2032 ($MILLION)
- FIGURE 29. REST OF ASIA-PACIFIC POLED PANEL MARKET, 2022-2032 ($MILLION)
- FIGURE 30. LATIN AMERICA POLED PANEL MARKET, 2022-2032 ($MILLION)
- FIGURE 31. MIDDLE EAST POLED PANEL MARKET, 2022-2032 ($MILLION)
- FIGURE 32. AFRICA POLED PANEL MARKET, 2022-2032 ($MILLION)
- FIGURE 33. TOP WINNING STRATEGIES, BY YEAR (2021-2023)
- FIGURE 34. TOP WINNING STRATEGIES, BY DEVELOPMENT (2021-2023)
- FIGURE 35. TOP WINNING STRATEGIES, BY COMPANY (2021-2023)
- FIGURE 36. PRODUCT MAPPING OF TOP 10 PLAYERS
- FIGURE 37. COMPETITIVE DASHBOARD
- FIGURE 38. COMPETITIVE HEATMAP: POLED PANEL MARKET
- FIGURE 39. TOP PLAYER POSITIONING, 2022
- FIGURE 40. LG DISPLAY CO., LTD.: NET REVENUE, 2020-2022 ($MILLION)
- FIGURE 41. LG DISPLAY CO., LTD.: RESEARCH & DEVELOPMENT EXPENDITURE, 2020-2022 ($MILLION)
- FIGURE 42. LG DISPLAY CO., LTD.: REVENUE SHARE BY SEGMENT, 2022 (%)
- FIGURE 43. LG DISPLAY CO., LTD.: REVENUE SHARE BY REGION, 2022 (%)
- FIGURE 44. APPLE INC.: NET REVENUE, 2020-2022 ($MILLION)
- FIGURE 45. APPLE INC.: REVENUE SHARE BY SEGMENT, 2022 (%)
- FIGURE 46. APPLE INC.: REVENUE SHARE BY REGION, 2022 (%)
- FIGURE 47. GOOGLE (ALPHABET INC.): NET REVENUE, 2020-2022 ($MILLION)
- FIGURE 48. GOOGLE (ALPHABET INC.): RESEARCH & DEVELOPMENT EXPENDITURE, 2020-2022 ($MILLION)
- FIGURE 49. GOOGLE (ALPHABET INC.): REVENUE SHARE BY SEGMENT, 2022 (%)
- FIGURE 50. GOOGLE (ALPHABET INC.): REVENUE SHARE BY REGION, 2022 (%)
- FIGURE 51. MOTOROLA MOBILITY LLC (LENOVO): NET REVENUE, 2020-2022 ($MILLION)
- FIGURE 52. MOTOROLA MOBILITY LLC (LENOVO): RESEARCH & DEVELOPMENT EXPENDITURE, 2020-2022 ($MILLION)
- FIGURE 53. MOTOROLA MOBILITY LLC (LENOVO): REVENUE SHARE BY SEGMENT, 2022 (%)
- FIGURE 54. MOTOROLA MOBILITY LLC (LENOVO): REVENUE SHARE BY REGION, 2022 (%)

