
PUBLISHER: Allied Market Research | PRODUCT CODE: 1414747

PUBLISHER: Allied Market Research | PRODUCT CODE: 1414747
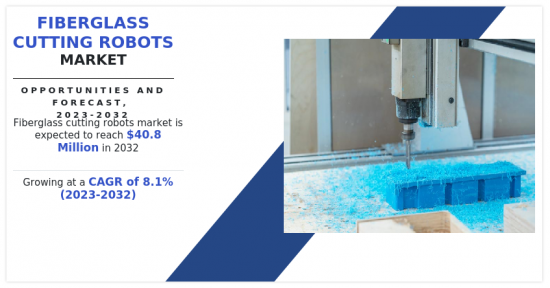
Fiberglass Cutting Robots Market By Product Type, By Application, By Payload, By Reach : Global Opportunity Analysis and Industry Forecast, 2023-2032
According to a new report published by Allied Market Research, titled, "Fiberglass Cutting Robots Market," The fiberglass cutting robots market was valued at $19 million in 2022, and is estimated to reach $40.8 million by 2032, growing at a CAGR of 8.1% from 2023 to 2032.
Increase in demand for fiberglass and the need for automation in non-conventional areas, such as
1) micro-electronics, aerospace, and marine have fostered the market growth. Hence, an auxiliary channel utilizing fiberglass cutting robots has surfaced in recent years. The manufacturing sector drives the demand for fiberglass cutting robots. The global fiberglass cutting robots market is impacted by several factors such as
1) usage of fiberglass cutting robots in the manufacturing industry, increase in demand for automation activities in the industry, reduction in custom duties, and the evolving robotics & AI industry.
Rapid changes in the factors, such as
1) industrial growth, consumer preference, wireless technologies, and others, have resulted in continuous improvements in specifications and features of fiberglass cutting robots. Funding from various private and government organizations to support R&D drives the fiberglass cutting robots market growth.
Furthermore, initial investment and maintenance costs of employing robotics systems are high due to the integration of high-quality hardware coupled with efficient software control systems. The high cost of fiberglass cutting robots solutions is a major restraint for the market growth.
The report provides the market share analysis of the industry participants. The key players have also been profiled along with company overview, financial overview, business strategies, SWOT analysis, and recent developments in the field of fiberglass cutting robots. The major market participants profiled in this report include KUKA Robotics, Denso, Fanuc, Mitsubishi, and Universal Robots.
The fiberglass cutting robots market is segmented into product type, application, payload, reach, and region. By product type, the market is classified into 3-axis to 5-axis robots and 6-axis to 7-axis robots. By application, the market is divided into construction, automotive and transportation, pipe and tank, wind energy, and other. By payload, the market is divided into light, medium, and heavy. By reach, the market is divided into up to 2000 mm and more than 2000 mm.
Region-wise, the market is analyzed across North America (the U.S., Canada, and Mexico), Europe (Germany, the UK, France, Italy, and rest of Europe), Asia-Pacific (China, India, Japan, South Korea, and rest of Asia-Pacific), and LAMEA (Latin America, Middle East, and Africa).
In 2022, Asia-Pacific was the key shareholder in the market; however, LAMEA is anticipated to secure a leading position during the forecast period.
Emerging economies in Asia-Pacific and LAMEA have adopted fiberglass cutting robots solutions for various professional uses, which is expected to facilitate faster growth in terms of efficiency. Such factors are expected to offer numerous opportunities for the market growth during the forecast period.
COMPETITION ANALYSIS
The key companies profiled in the fiberglass cutting robots market report include ABB, Comau, Daihen Corporation Co., Ltd., Denso Corporation, Fanuc Corporation, Seiko Epson Corporation, Kawasaki Heavy Industries, Ltd., KUKA AG, Universal Robots A/S, and Yaskawa Electric Corporation.
Key Benefits For Stakeholders
- This report provides a quantitative analysis of the market segments, current trends, estimations, and dynamics of the fiberglass cutting robots market analysis from 2022 to 2032 to identify the prevailing fiberglass cutting robots market opportunities.
- The market research is offered along with information related to key drivers, restraints, and opportunities.
- Porter's five forces analysis highlights the potency of buyers and suppliers to enable stakeholders make profit-oriented business decisions and strengthen their supplier-buyer network.
- In-depth analysis of the fiberglass cutting robots market segmentation assists to determine the prevailing market opportunities.
- Major countries in each region are mapped according to their revenue contribution to the global market.
- Market player positioning facilitates benchmarking and provides a clear understanding of the present position of the market players.
- The report includes the analysis of the regional as well as global fiberglass cutting robots market trends, key players, market segments, application areas, and market growth strategies.
Additional benefits you will get with this purchase are:
- Quarterly Update and* (only available with a corporate license, on listed price)
- 5 additional Company Profile of client Choice pre- or Post-purchase, as a free update.
- Free Upcoming Version on the Purchase of Five and Enterprise User License.
- 16 analyst hours of support* (post-purchase, if you find additional data requirements upon review of the report, you may receive support amounting to 16 analyst hours to solve questions, and post-sale queries)
- 15% Free Customization* (in case the scope or segment of the report does not match your requirements, 15% is equivalent to 3 working days of free work, applicable once)
- Free data Pack on the Five and Enterprise User License. (Excel version of the report)
- Free Updated report if the report is 6-12 months old or older.
- 24-hour priority response*
- Free Industry updates and white papers.
Possible Customization with this report (with additional cost and timeline, please talk to the sales executive to know more)
- Investment Opportunities
- Market share analysis of players by products/segments
- Additional company profiles with specific to client's interest
- Additional country or region analysis- market size and forecast
- Expanded list for Company Profiles
- Historic market data
- Import Export Analysis/Data
Key Market Segments
By Payload
- Light
- Medium
- Heavy
By Reach
- Up to 2000 mm
- More than 2000 mm
By Product Type
- 3-AXIS TO 5-AXIS ROBOTS
- 6-AXIS TO 7-AXIS ROBOTS
By Application
- Construction
- Automotive and Transportation
- Pipe and Tank
- Wind Energy
- Others
By Region
- North America
- U.S.
- Canada
- Mexico
- Europe
- Germany
- France
- UK
- Italy
- Rest of Europe
- Asia-Pacific
- China
- Japan
- India
- South Korea
- Rest of Asia-Pacific
- LAMEA
- Latin America
- Middle East
- Africa
Key Market Players:
- KUKA AG
- FANUC Corporation
- Kawasaki Heavy Industries, Ltd.
- ABB
- DENSO CORPORATION
- Universal Robots A/S
- Comau S.p.A.
- Yaskawa Electric Corporation
- Seiko Epson Corporation.
- DAIHEN Corporation
TABLE OF CONTENTS
CHAPTER 1: INTRODUCTION
- 1.1. Report description
- 1.2. Key market segments
- 1.3. Key benefits to the stakeholders
- 1.4. Research methodology
- 1.4.1. Primary research
- 1.4.2. Secondary research
- 1.4.3. Analyst tools and models
CHAPTER 2: EXECUTIVE SUMMARY
- 2.1. CXO Perspective
CHAPTER 3: MARKET OVERVIEW
- 3.1. Market definition and scope
- 3.2. Key findings
- 3.2.1. Top impacting factors
- 3.2.2. Top investment pockets
- 3.3. Porter's five forces analysis
- 3.3.1. Low bargaining power of suppliers
- 3.3.2. Low threat of new entrants
- 3.3.3. Low threat of substitutes
- 3.3.4. Low intensity of rivalry
- 3.3.5. Low bargaining power of buyers
- 3.4. Market dynamics
- 3.4.1. Drivers
- 3.4.1.1. High requirement for automation.
- 3.4.1.2. High labor cost and dearth of skilled human workforce
- 3.4.1.3. Increase in investments in R&D activities
- 3.4.2. Restraints
- 3.4.2.1. High initial investment and installation costs
- 3.4.3. Opportunities
- 3.4.3.1. Evolving robotics and AI industry
- 3.4.1. Drivers
CHAPTER 4: FIBERGLASS CUTTING ROBOTS MARKET, BY PRODUCT TYPE
- 4.1. Overview
- 4.1.1. Market size and forecast
- 4.2. 3-AXIS TO 5-AXIS ROBOTS
- 4.2.1. Key market trends, growth factors and opportunities
- 4.2.2. Market size and forecast, by region
- 4.2.3. Market share analysis by country
- 4.3. 6-AXIS TO 7-AXIS ROBOTS
- 4.3.1. Key market trends, growth factors and opportunities
- 4.3.2. Market size and forecast, by region
- 4.3.3. Market share analysis by country
CHAPTER 5: FIBERGLASS CUTTING ROBOTS MARKET, BY APPLICATION
- 5.1. Overview
- 5.1.1. Market size and forecast
- 5.2. Construction
- 5.2.1. Key market trends, growth factors and opportunities
- 5.2.2. Market size and forecast, by region
- 5.2.3. Market share analysis by country
- 5.3. Automotive and Transportation
- 5.3.1. Key market trends, growth factors and opportunities
- 5.3.2. Market size and forecast, by region
- 5.3.3. Market share analysis by country
- 5.4. Pipe and Tank
- 5.4.1. Key market trends, growth factors and opportunities
- 5.4.2. Market size and forecast, by region
- 5.4.3. Market share analysis by country
- 5.5. Wind Energy
- 5.5.1. Key market trends, growth factors and opportunities
- 5.5.2. Market size and forecast, by region
- 5.5.3. Market share analysis by country
- 5.6. Others
- 5.6.1. Key market trends, growth factors and opportunities
- 5.6.2. Market size and forecast, by region
- 5.6.3. Market share analysis by country
CHAPTER 6: FIBERGLASS CUTTING ROBOTS MARKET, BY PAYLOAD
- 6.1. Overview
- 6.1.1. Market size and forecast
- 6.2. Light
- 6.2.1. Key market trends, growth factors and opportunities
- 6.2.2. Market size and forecast, by region
- 6.2.3. Market share analysis by country
- 6.3. Medium
- 6.3.1. Key market trends, growth factors and opportunities
- 6.3.2. Market size and forecast, by region
- 6.3.3. Market share analysis by country
- 6.4. Heavy
- 6.4.1. Key market trends, growth factors and opportunities
- 6.4.2. Market size and forecast, by region
- 6.4.3. Market share analysis by country
CHAPTER 7: FIBERGLASS CUTTING ROBOTS MARKET, BY REACH
- 7.1. Overview
- 7.1.1. Market size and forecast
- 7.2. Up to 2000 mm
- 7.2.1. Key market trends, growth factors and opportunities
- 7.2.2. Market size and forecast, by region
- 7.2.3. Market share analysis by country
- 7.3. More than 2000 mm
- 7.3.1. Key market trends, growth factors and opportunities
- 7.3.2. Market size and forecast, by region
- 7.3.3. Market share analysis by country
CHAPTER 8: FIBERGLASS CUTTING ROBOTS MARKET, BY REGION
- 8.1. Overview
- 8.1.1. Market size and forecast By Region
- 8.2. North America
- 8.2.1. Key market trends, growth factors and opportunities
- 8.2.2. Market size and forecast, by Product Type
- 8.2.3. Market size and forecast, by Application
- 8.2.4. Market size and forecast, by Payload
- 8.2.5. Market size and forecast, by Reach
- 8.2.6. Market size and forecast, by country
- 8.2.6.1. U.S.
- 8.2.6.1.1. Market size and forecast, by Product Type
- 8.2.6.1.2. Market size and forecast, by Application
- 8.2.6.1.3. Market size and forecast, by Payload
- 8.2.6.1.4. Market size and forecast, by Reach
- 8.2.6.2. Canada
- 8.2.6.2.1. Market size and forecast, by Product Type
- 8.2.6.2.2. Market size and forecast, by Application
- 8.2.6.2.3. Market size and forecast, by Payload
- 8.2.6.2.4. Market size and forecast, by Reach
- 8.2.6.3. Mexico
- 8.2.6.3.1. Market size and forecast, by Product Type
- 8.2.6.3.2. Market size and forecast, by Application
- 8.2.6.3.3. Market size and forecast, by Payload
- 8.2.6.3.4. Market size and forecast, by Reach
- 8.3. Europe
- 8.3.1. Key market trends, growth factors and opportunities
- 8.3.2. Market size and forecast, by Product Type
- 8.3.3. Market size and forecast, by Application
- 8.3.4. Market size and forecast, by Payload
- 8.3.5. Market size and forecast, by Reach
- 8.3.6. Market size and forecast, by country
- 8.3.6.1. Germany
- 8.3.6.1.1. Market size and forecast, by Product Type
- 8.3.6.1.2. Market size and forecast, by Application
- 8.3.6.1.3. Market size and forecast, by Payload
- 8.3.6.1.4. Market size and forecast, by Reach
- 8.3.6.2. France
- 8.3.6.2.1. Market size and forecast, by Product Type
- 8.3.6.2.2. Market size and forecast, by Application
- 8.3.6.2.3. Market size and forecast, by Payload
- 8.3.6.2.4. Market size and forecast, by Reach
- 8.3.6.3. UK
- 8.3.6.3.1. Market size and forecast, by Product Type
- 8.3.6.3.2. Market size and forecast, by Application
- 8.3.6.3.3. Market size and forecast, by Payload
- 8.3.6.3.4. Market size and forecast, by Reach
- 8.3.6.4. Italy
- 8.3.6.4.1. Market size and forecast, by Product Type
- 8.3.6.4.2. Market size and forecast, by Application
- 8.3.6.4.3. Market size and forecast, by Payload
- 8.3.6.4.4. Market size and forecast, by Reach
- 8.3.6.5. Rest of Europe
- 8.3.6.5.1. Market size and forecast, by Product Type
- 8.3.6.5.2. Market size and forecast, by Application
- 8.3.6.5.3. Market size and forecast, by Payload
- 8.3.6.5.4. Market size and forecast, by Reach
- 8.4. Asia-Pacific
- 8.4.1. Key market trends, growth factors and opportunities
- 8.4.2. Market size and forecast, by Product Type
- 8.4.3. Market size and forecast, by Application
- 8.4.4. Market size and forecast, by Payload
- 8.4.5. Market size and forecast, by Reach
- 8.4.6. Market size and forecast, by country
- 8.4.6.1. China
- 8.4.6.1.1. Market size and forecast, by Product Type
- 8.4.6.1.2. Market size and forecast, by Application
- 8.4.6.1.3. Market size and forecast, by Payload
- 8.4.6.1.4. Market size and forecast, by Reach
- 8.4.6.2. Japan
- 8.4.6.2.1. Market size and forecast, by Product Type
- 8.4.6.2.2. Market size and forecast, by Application
- 8.4.6.2.3. Market size and forecast, by Payload
- 8.4.6.2.4. Market size and forecast, by Reach
- 8.4.6.3. India
- 8.4.6.3.1. Market size and forecast, by Product Type
- 8.4.6.3.2. Market size and forecast, by Application
- 8.4.6.3.3. Market size and forecast, by Payload
- 8.4.6.3.4. Market size and forecast, by Reach
- 8.4.6.4. South Korea
- 8.4.6.4.1. Market size and forecast, by Product Type
- 8.4.6.4.2. Market size and forecast, by Application
- 8.4.6.4.3. Market size and forecast, by Payload
- 8.4.6.4.4. Market size and forecast, by Reach
- 8.4.6.5. Rest of Asia-Pacific
- 8.4.6.5.1. Market size and forecast, by Product Type
- 8.4.6.5.2. Market size and forecast, by Application
- 8.4.6.5.3. Market size and forecast, by Payload
- 8.4.6.5.4. Market size and forecast, by Reach
- 8.5. LAMEA
- 8.5.1. Key market trends, growth factors and opportunities
- 8.5.2. Market size and forecast, by Product Type
- 8.5.3. Market size and forecast, by Application
- 8.5.4. Market size and forecast, by Payload
- 8.5.5. Market size and forecast, by Reach
- 8.5.6. Market size and forecast, by country
- 8.5.6.1. Latin America
- 8.5.6.1.1. Market size and forecast, by Product Type
- 8.5.6.1.2. Market size and forecast, by Application
- 8.5.6.1.3. Market size and forecast, by Payload
- 8.5.6.1.4. Market size and forecast, by Reach
- 8.5.6.2. Middle East
- 8.5.6.2.1. Market size and forecast, by Product Type
- 8.5.6.2.2. Market size and forecast, by Application
- 8.5.6.2.3. Market size and forecast, by Payload
- 8.5.6.2.4. Market size and forecast, by Reach
- 8.5.6.3. Africa
- 8.5.6.3.1. Market size and forecast, by Product Type
- 8.5.6.3.2. Market size and forecast, by Application
- 8.5.6.3.3. Market size and forecast, by Payload
- 8.5.6.3.4. Market size and forecast, by Reach
CHAPTER 9: COMPETITIVE LANDSCAPE
- 9.1. Introduction
- 9.2. Top winning strategies
- 9.3. Product mapping of top 10 player
- 9.4. Competitive dashboard
- 9.5. Competitive heatmap
- 9.6. Top player positioning, 2022
CHAPTER 10: COMPANY PROFILES
- 10.1. KUKA AG
- 10.1.1. Company overview
- 10.1.2. Key executives
- 10.1.3. Company snapshot
- 10.1.4. Operating business segments
- 10.1.5. Product portfolio
- 10.1.6. Business performance
- 10.2. FANUC Corporation
- 10.2.1. Company overview
- 10.2.2. Key executives
- 10.2.3. Company snapshot
- 10.2.4. Operating business segments
- 10.2.5. Product portfolio
- 10.2.6. Business performance
- 10.2.7. Key strategic moves and developments
- 10.3. Kawasaki Heavy Industries, Ltd.
- 10.3.1. Company overview
- 10.3.2. Key executives
- 10.3.3. Company snapshot
- 10.3.4. Operating business segments
- 10.3.5. Product portfolio
- 10.3.6. Business performance
- 10.4. ABB
- 10.4.1. Company overview
- 10.4.2. Key executives
- 10.4.3. Company snapshot
- 10.4.4. Operating business segments
- 10.4.5. Product portfolio
- 10.4.6. Business performance
- 10.4.7. Key strategic moves and developments
- 10.5. Yaskawa Electric Corporation
- 10.5.1. Company overview
- 10.5.2. Key executives
- 10.5.3. Company snapshot
- 10.5.4. Operating business segments
- 10.5.5. Product portfolio
- 10.5.6. Business performance
- 10.6. DENSO CORPORATION
- 10.6.1. Company overview
- 10.6.2. Key executives
- 10.6.3. Company snapshot
- 10.6.4. Operating business segments
- 10.6.5. Product portfolio
- 10.6.6. Business performance
- 10.7. DAIHEN Corporation
- 10.7.1. Company overview
- 10.7.2. Key executives
- 10.7.3. Company snapshot
- 10.7.4. Operating business segments
- 10.7.5. Product portfolio
- 10.7.6. Business performance
- 10.7.7. Key strategic moves and developments
- 10.8. Universal Robots A/S
- 10.8.1. Company overview
- 10.8.2. Key executives
- 10.8.3. Company snapshot
- 10.8.4. Operating business segments
- 10.8.5. Product portfolio
- 10.8.6. Business performance
- 10.9. Comau S.p.A.
- 10.9.1. Company overview
- 10.9.2. Key executives
- 10.9.3. Company snapshot
- 10.9.4. Operating business segments
- 10.9.5. Product portfolio
- 10.9.6. Business performance
- 10.10. Seiko Epson Corporation.
- 10.10.1. Company overview
- 10.10.2. Key executives
- 10.10.3. Company snapshot
- 10.10.4. Operating business segments
- 10.10.5. Product portfolio
- 10.10.6. Business performance
LIST OF TABLES
- TABLE 01. GLOBAL FIBERGLASS CUTTING ROBOTS MARKET, BY PRODUCT TYPE, 2022-2032 ($THOUSAND)
- TABLE 02. FIBERGLASS CUTTING ROBOTS MARKET FOR 3-AXIS TO 5-AXIS ROBOTS, BY REGION, 2022-2032 ($THOUSAND)
- TABLE 03. FIBERGLASS CUTTING ROBOTS MARKET FOR 6-AXIS TO 7-AXIS ROBOTS, BY REGION, 2022-2032 ($THOUSAND)
- TABLE 04. GLOBAL FIBERGLASS CUTTING ROBOTS MARKET, BY APPLICATION, 2022-2032 ($THOUSAND)
- TABLE 05. FIBERGLASS CUTTING ROBOTS MARKET FOR CONSTRUCTION, BY REGION, 2022-2032 ($THOUSAND)
- TABLE 06. FIBERGLASS CUTTING ROBOTS MARKET FOR AUTOMOTIVE AND TRANSPORTATION, BY REGION, 2022-2032 ($THOUSAND)
- TABLE 07. FIBERGLASS CUTTING ROBOTS MARKET FOR PIPE AND TANK, BY REGION, 2022-2032 ($THOUSAND)
- TABLE 08. FIBERGLASS CUTTING ROBOTS MARKET FOR WIND ENERGY, BY REGION, 2022-2032 ($THOUSAND)
- TABLE 09. FIBERGLASS CUTTING ROBOTS MARKET FOR OTHERS, BY REGION, 2022-2032 ($THOUSAND)
- TABLE 10. GLOBAL FIBERGLASS CUTTING ROBOTS MARKET, BY PAYLOAD, 2022-2032 ($THOUSAND)
- TABLE 11. FIBERGLASS CUTTING ROBOTS MARKET FOR LIGHT, BY REGION, 2022-2032 ($THOUSAND)
- TABLE 12. FIBERGLASS CUTTING ROBOTS MARKET FOR MEDIUM, BY REGION, 2022-2032 ($THOUSAND)
- TABLE 13. FIBERGLASS CUTTING ROBOTS MARKET FOR HEAVY, BY REGION, 2022-2032 ($THOUSAND)
- TABLE 14. GLOBAL FIBERGLASS CUTTING ROBOTS MARKET, BY REACH, 2022-2032 ($THOUSAND)
- TABLE 15. FIBERGLASS CUTTING ROBOTS MARKET FOR UP TO 2000 MM, BY REGION, 2022-2032 ($THOUSAND)
- TABLE 16. FIBERGLASS CUTTING ROBOTS MARKET FOR MORE THAN 2000 MM, BY REGION, 2022-2032 ($THOUSAND)
- TABLE 17. FIBERGLASS CUTTING ROBOTS MARKET, BY REGION, 2022-2032 ($THOUSAND)
- TABLE 18. NORTH AMERICA FIBERGLASS CUTTING ROBOTS MARKET, BY PRODUCT TYPE, 2022-2032 ($THOUSAND)
- TABLE 19. NORTH AMERICA FIBERGLASS CUTTING ROBOTS MARKET, BY APPLICATION, 2022-2032 ($THOUSAND)
- TABLE 20. NORTH AMERICA FIBERGLASS CUTTING ROBOTS MARKET, BY PAYLOAD, 2022-2032 ($THOUSAND)
- TABLE 21. NORTH AMERICA FIBERGLASS CUTTING ROBOTS MARKET, BY REACH, 2022-2032 ($THOUSAND)
- TABLE 22. NORTH AMERICA FIBERGLASS CUTTING ROBOTS MARKET, BY COUNTRY, 2022-2032 ($THOUSAND)
- TABLE 23. U.S. FIBERGLASS CUTTING ROBOTS MARKET, BY PRODUCT TYPE, 2022-2032 ($THOUSAND)
- TABLE 24. U.S. FIBERGLASS CUTTING ROBOTS MARKET, BY APPLICATION, 2022-2032 ($THOUSAND)
- TABLE 25. U.S. FIBERGLASS CUTTING ROBOTS MARKET, BY PAYLOAD, 2022-2032 ($THOUSAND)
- TABLE 26. U.S. FIBERGLASS CUTTING ROBOTS MARKET, BY REACH, 2022-2032 ($THOUSAND)
- TABLE 27. CANADA FIBERGLASS CUTTING ROBOTS MARKET, BY PRODUCT TYPE, 2022-2032 ($THOUSAND)
- TABLE 28. CANADA FIBERGLASS CUTTING ROBOTS MARKET, BY APPLICATION, 2022-2032 ($THOUSAND)
- TABLE 29. CANADA FIBERGLASS CUTTING ROBOTS MARKET, BY PAYLOAD, 2022-2032 ($THOUSAND)
- TABLE 30. CANADA FIBERGLASS CUTTING ROBOTS MARKET, BY REACH, 2022-2032 ($THOUSAND)
- TABLE 31. MEXICO FIBERGLASS CUTTING ROBOTS MARKET, BY PRODUCT TYPE, 2022-2032 ($THOUSAND)
- TABLE 32. MEXICO FIBERGLASS CUTTING ROBOTS MARKET, BY APPLICATION, 2022-2032 ($THOUSAND)
- TABLE 33. MEXICO FIBERGLASS CUTTING ROBOTS MARKET, BY PAYLOAD, 2022-2032 ($THOUSAND)
- TABLE 34. MEXICO FIBERGLASS CUTTING ROBOTS MARKET, BY REACH, 2022-2032 ($THOUSAND)
- TABLE 35. EUROPE FIBERGLASS CUTTING ROBOTS MARKET, BY PRODUCT TYPE, 2022-2032 ($THOUSAND)
- TABLE 36. EUROPE FIBERGLASS CUTTING ROBOTS MARKET, BY APPLICATION, 2022-2032 ($THOUSAND)
- TABLE 37. EUROPE FIBERGLASS CUTTING ROBOTS MARKET, BY PAYLOAD, 2022-2032 ($THOUSAND)
- TABLE 38. EUROPE FIBERGLASS CUTTING ROBOTS MARKET, BY REACH, 2022-2032 ($THOUSAND)
- TABLE 39. EUROPE FIBERGLASS CUTTING ROBOTS MARKET, BY COUNTRY, 2022-2032 ($THOUSAND)
- TABLE 40. GERMANY FIBERGLASS CUTTING ROBOTS MARKET, BY PRODUCT TYPE, 2022-2032 ($THOUSAND)
- TABLE 41. GERMANY FIBERGLASS CUTTING ROBOTS MARKET, BY APPLICATION, 2022-2032 ($THOUSAND)
- TABLE 42. GERMANY FIBERGLASS CUTTING ROBOTS MARKET, BY PAYLOAD, 2022-2032 ($THOUSAND)
- TABLE 43. GERMANY FIBERGLASS CUTTING ROBOTS MARKET, BY REACH, 2022-2032 ($THOUSAND)
- TABLE 44. FRANCE FIBERGLASS CUTTING ROBOTS MARKET, BY PRODUCT TYPE, 2022-2032 ($THOUSAND)
- TABLE 45. FRANCE FIBERGLASS CUTTING ROBOTS MARKET, BY APPLICATION, 2022-2032 ($THOUSAND)
- TABLE 46. FRANCE FIBERGLASS CUTTING ROBOTS MARKET, BY PAYLOAD, 2022-2032 ($THOUSAND)
- TABLE 47. FRANCE FIBERGLASS CUTTING ROBOTS MARKET, BY REACH, 2022-2032 ($THOUSAND)
- TABLE 48. UK FIBERGLASS CUTTING ROBOTS MARKET, BY PRODUCT TYPE, 2022-2032 ($THOUSAND)
- TABLE 49. UK FIBERGLASS CUTTING ROBOTS MARKET, BY APPLICATION, 2022-2032 ($THOUSAND)
- TABLE 50. UK FIBERGLASS CUTTING ROBOTS MARKET, BY PAYLOAD, 2022-2032 ($THOUSAND)
- TABLE 51. UK FIBERGLASS CUTTING ROBOTS MARKET, BY REACH, 2022-2032 ($THOUSAND)
- TABLE 52. ITALY FIBERGLASS CUTTING ROBOTS MARKET, BY PRODUCT TYPE, 2022-2032 ($THOUSAND)
- TABLE 53. ITALY FIBERGLASS CUTTING ROBOTS MARKET, BY APPLICATION, 2022-2032 ($THOUSAND)
- TABLE 54. ITALY FIBERGLASS CUTTING ROBOTS MARKET, BY PAYLOAD, 2022-2032 ($THOUSAND)
- TABLE 55. ITALY FIBERGLASS CUTTING ROBOTS MARKET, BY REACH, 2022-2032 ($THOUSAND)
- TABLE 56. REST OF EUROPE FIBERGLASS CUTTING ROBOTS MARKET, BY PRODUCT TYPE, 2022-2032 ($THOUSAND)
- TABLE 57. REST OF EUROPE FIBERGLASS CUTTING ROBOTS MARKET, BY APPLICATION, 2022-2032 ($THOUSAND)
- TABLE 58. REST OF EUROPE FIBERGLASS CUTTING ROBOTS MARKET, BY PAYLOAD, 2022-2032 ($THOUSAND)
- TABLE 59. REST OF EUROPE FIBERGLASS CUTTING ROBOTS MARKET, BY REACH, 2022-2032 ($THOUSAND)
- TABLE 60. ASIA-PACIFIC FIBERGLASS CUTTING ROBOTS MARKET, BY PRODUCT TYPE, 2022-2032 ($THOUSAND)
- TABLE 61. ASIA-PACIFIC FIBERGLASS CUTTING ROBOTS MARKET, BY APPLICATION, 2022-2032 ($THOUSAND)
- TABLE 62. ASIA-PACIFIC FIBERGLASS CUTTING ROBOTS MARKET, BY PAYLOAD, 2022-2032 ($THOUSAND)
- TABLE 63. ASIA-PACIFIC FIBERGLASS CUTTING ROBOTS MARKET, BY REACH, 2022-2032 ($THOUSAND)
- TABLE 64. ASIA-PACIFIC FIBERGLASS CUTTING ROBOTS MARKET, BY COUNTRY, 2022-2032 ($THOUSAND)
- TABLE 65. CHINA FIBERGLASS CUTTING ROBOTS MARKET, BY PRODUCT TYPE, 2022-2032 ($THOUSAND)
- TABLE 66. CHINA FIBERGLASS CUTTING ROBOTS MARKET, BY APPLICATION, 2022-2032 ($THOUSAND)
- TABLE 67. CHINA FIBERGLASS CUTTING ROBOTS MARKET, BY PAYLOAD, 2022-2032 ($THOUSAND)
- TABLE 68. CHINA FIBERGLASS CUTTING ROBOTS MARKET, BY REACH, 2022-2032 ($THOUSAND)
- TABLE 69. JAPAN FIBERGLASS CUTTING ROBOTS MARKET, BY PRODUCT TYPE, 2022-2032 ($THOUSAND)
- TABLE 70. JAPAN FIBERGLASS CUTTING ROBOTS MARKET, BY APPLICATION, 2022-2032 ($THOUSAND)
- TABLE 71. JAPAN FIBERGLASS CUTTING ROBOTS MARKET, BY PAYLOAD, 2022-2032 ($THOUSAND)
- TABLE 72. JAPAN FIBERGLASS CUTTING ROBOTS MARKET, BY REACH, 2022-2032 ($THOUSAND)
- TABLE 73. INDIA FIBERGLASS CUTTING ROBOTS MARKET, BY PRODUCT TYPE, 2022-2032 ($THOUSAND)
- TABLE 74. INDIA FIBERGLASS CUTTING ROBOTS MARKET, BY APPLICATION, 2022-2032 ($THOUSAND)
- TABLE 75. INDIA FIBERGLASS CUTTING ROBOTS MARKET, BY PAYLOAD, 2022-2032 ($THOUSAND)
- TABLE 76. INDIA FIBERGLASS CUTTING ROBOTS MARKET, BY REACH, 2022-2032 ($THOUSAND)
- TABLE 77. SOUTH KOREA FIBERGLASS CUTTING ROBOTS MARKET, BY PRODUCT TYPE, 2022-2032 ($THOUSAND)
- TABLE 78. SOUTH KOREA FIBERGLASS CUTTING ROBOTS MARKET, BY APPLICATION, 2022-2032 ($THOUSAND)
- TABLE 79. SOUTH KOREA FIBERGLASS CUTTING ROBOTS MARKET, BY PAYLOAD, 2022-2032 ($THOUSAND)
- TABLE 80. SOUTH KOREA FIBERGLASS CUTTING ROBOTS MARKET, BY REACH, 2022-2032 ($THOUSAND)
- TABLE 81. REST OF ASIA-PACIFIC FIBERGLASS CUTTING ROBOTS MARKET, BY PRODUCT TYPE, 2022-2032 ($THOUSAND)
- TABLE 82. REST OF ASIA-PACIFIC FIBERGLASS CUTTING ROBOTS MARKET, BY APPLICATION, 2022-2032 ($THOUSAND)
- TABLE 83. REST OF ASIA-PACIFIC FIBERGLASS CUTTING ROBOTS MARKET, BY PAYLOAD, 2022-2032 ($THOUSAND)
- TABLE 84. REST OF ASIA-PACIFIC FIBERGLASS CUTTING ROBOTS MARKET, BY REACH, 2022-2032 ($THOUSAND)
- TABLE 85. LAMEA FIBERGLASS CUTTING ROBOTS MARKET, BY PRODUCT TYPE, 2022-2032 ($THOUSAND)
- TABLE 86. LAMEA FIBERGLASS CUTTING ROBOTS MARKET, BY APPLICATION, 2022-2032 ($THOUSAND)
- TABLE 87. LAMEA FIBERGLASS CUTTING ROBOTS MARKET, BY PAYLOAD, 2022-2032 ($THOUSAND)
- TABLE 88. LAMEA FIBERGLASS CUTTING ROBOTS MARKET, BY REACH, 2022-2032 ($THOUSAND)
- TABLE 89. LAMEA FIBERGLASS CUTTING ROBOTS MARKET, BY COUNTRY, 2022-2032 ($THOUSAND)
- TABLE 90. LATIN AMERICA FIBERGLASS CUTTING ROBOTS MARKET, BY PRODUCT TYPE, 2022-2032 ($THOUSAND)
- TABLE 91. LATIN AMERICA FIBERGLASS CUTTING ROBOTS MARKET, BY APPLICATION, 2022-2032 ($THOUSAND)
- TABLE 92. LATIN AMERICA FIBERGLASS CUTTING ROBOTS MARKET, BY PAYLOAD, 2022-2032 ($THOUSAND)
- TABLE 93. LATIN AMERICA FIBERGLASS CUTTING ROBOTS MARKET, BY REACH, 2022-2032 ($THOUSAND)
- TABLE 94. MIDDLE EAST FIBERGLASS CUTTING ROBOTS MARKET, BY PRODUCT TYPE, 2022-2032 ($THOUSAND)
- TABLE 95. MIDDLE EAST FIBERGLASS CUTTING ROBOTS MARKET, BY APPLICATION, 2022-2032 ($THOUSAND)
- TABLE 96. MIDDLE EAST FIBERGLASS CUTTING ROBOTS MARKET, BY PAYLOAD, 2022-2032 ($THOUSAND)
- TABLE 97. MIDDLE EAST FIBERGLASS CUTTING ROBOTS MARKET, BY REACH, 2022-2032 ($THOUSAND)
- TABLE 98. AFRICA FIBERGLASS CUTTING ROBOTS MARKET, BY PRODUCT TYPE, 2022-2032 ($THOUSAND)
- TABLE 99. AFRICA FIBERGLASS CUTTING ROBOTS MARKET, BY APPLICATION, 2022-2032 ($THOUSAND)
- TABLE 100. AFRICA FIBERGLASS CUTTING ROBOTS MARKET, BY PAYLOAD, 2022-2032 ($THOUSAND)
- TABLE 101. AFRICA FIBERGLASS CUTTING ROBOTS MARKET, BY REACH, 2022-2032 ($THOUSAND)
- TABLE 102. KUKA AG: KEY EXECUTIVES
- TABLE 103. KUKA AG: COMPANY SNAPSHOT
- TABLE 104. KUKA AG: PRODUCT SEGMENTS
- TABLE 105. KUKA AG: PRODUCT PORTFOLIO
- TABLE 106. FANUC CORPORATION: KEY EXECUTIVES
- TABLE 107. FANUC CORPORATION: COMPANY SNAPSHOT
- TABLE 108. FANUC CORPORATION: PRODUCT SEGMENTS
- TABLE 109. FANUC CORPORATION: PRODUCT PORTFOLIO
- TABLE 110. FANUC CORPORATION: KEY STRATERGIES
- TABLE 111. KAWASAKI HEAVY INDUSTRIES, LTD.: KEY EXECUTIVES
- TABLE 112. KAWASAKI HEAVY INDUSTRIES, LTD.: COMPANY SNAPSHOT
- TABLE 113. KAWASAKI HEAVY INDUSTRIES, LTD.: PRODUCT SEGMENTS
- TABLE 114. KAWASAKI HEAVY INDUSTRIES, LTD.: PRODUCT PORTFOLIO
- TABLE 115. ABB: KEY EXECUTIVES
- TABLE 116. ABB: COMPANY SNAPSHOT
- TABLE 117. ABB: SERVICE SEGMENTS
- TABLE 118. ABB: PRODUCT PORTFOLIO
- TABLE 119. ABB: KEY STRATERGIES
- TABLE 120. YASKAWA ELECTRIC CORPORATION: KEY EXECUTIVES
- TABLE 121. YASKAWA ELECTRIC CORPORATION: COMPANY SNAPSHOT
- TABLE 122. YASKAWA ELECTRIC CORPORATION: SERVICE SEGMENTS
- TABLE 123. YASKAWA ELECTRIC CORPORATION: PRODUCT PORTFOLIO
- TABLE 124. DENSO CORPORATION: KEY EXECUTIVES
- TABLE 125. DENSO CORPORATION: COMPANY SNAPSHOT
- TABLE 126. DENSO CORPORATION: PRODUCT SEGMENTS
- TABLE 127. DENSO CORPORATION: PRODUCT PORTFOLIO
- TABLE 128. DAIHEN CORPORATION: KEY EXECUTIVES
- TABLE 129. DAIHEN CORPORATION: COMPANY SNAPSHOT
- TABLE 130. DAIHEN CORPORATION: PRODUCT SEGMENTS
- TABLE 131. DAIHEN CORPORATION: PRODUCT PORTFOLIO
- TABLE 132. DAIHEN CORPORATION: KEY STRATERGIES
- TABLE 133. UNIVERSAL ROBOTS A/S: KEY EXECUTIVES
- TABLE 134. UNIVERSAL ROBOTS A/S: COMPANY SNAPSHOT
- TABLE 135. UNIVERSAL ROBOTS A/S: SERVICE SEGMENTS
- TABLE 136. UNIVERSAL ROBOTS A/S: PRODUCT PORTFOLIO
- TABLE 137. COMAU S.P.A.: KEY EXECUTIVES
- TABLE 138. COMAU S.P.A.: COMPANY SNAPSHOT
- TABLE 139. COMAU S.P.A.: SERVICE SEGMENTS
- TABLE 140. COMAU S.P.A.: PRODUCT PORTFOLIO
- TABLE 141. SEIKO EPSON CORPORATION.: KEY EXECUTIVES
- TABLE 142. SEIKO EPSON CORPORATION.: COMPANY SNAPSHOT
- TABLE 143. SEIKO EPSON CORPORATION.: SERVICE SEGMENTS
- TABLE 144. SEIKO EPSON CORPORATION.: PRODUCT PORTFOLIO
LIST OF FIGURES
- FIGURE 01. FIBERGLASS CUTTING ROBOTS MARKET, 2022-2032
- FIGURE 02. SEGMENTATION OF FIBERGLASS CUTTING ROBOTS MARKET,2022-2032
- FIGURE 03. TOP IMPACTING FACTORS IN FIBERGLASS CUTTING ROBOTS MARKET (2022 TO 2032)
- FIGURE 04. TOP INVESTMENT POCKETS IN FIBERGLASS CUTTING ROBOTS MARKET (2023-2032)
- FIGURE 05. LOW BARGAINING POWER OF SUPPLIERS
- FIGURE 06. LOW THREAT OF NEW ENTRANTS
- FIGURE 07. LOW THREAT OF SUBSTITUTES
- FIGURE 08. LOW INTENSITY OF RIVALRY
- FIGURE 09. LOW BARGAINING POWER OF BUYERS
- FIGURE 10. GLOBAL FIBERGLASS CUTTING ROBOTS MARKET:DRIVERS, RESTRAINTS AND OPPORTUNITIES
- FIGURE 11. FIBERGLASS CUTTING ROBOTS MARKET, BY PRODUCT TYPE, 2022 AND 2032(%)
- FIGURE 12. COMPARATIVE SHARE ANALYSIS OF FIBERGLASS CUTTING ROBOTS MARKET FOR 3-AXIS TO 5-AXIS ROBOTS, BY COUNTRY 2022 AND 2032(%)
- FIGURE 13. COMPARATIVE SHARE ANALYSIS OF FIBERGLASS CUTTING ROBOTS MARKET FOR 6-AXIS TO 7-AXIS ROBOTS, BY COUNTRY 2022 AND 2032(%)
- FIGURE 14. FIBERGLASS CUTTING ROBOTS MARKET, BY APPLICATION, 2022 AND 2032(%)
- FIGURE 15. COMPARATIVE SHARE ANALYSIS OF FIBERGLASS CUTTING ROBOTS MARKET FOR CONSTRUCTION, BY COUNTRY 2022 AND 2032(%)
- FIGURE 16. COMPARATIVE SHARE ANALYSIS OF FIBERGLASS CUTTING ROBOTS MARKET FOR AUTOMOTIVE AND TRANSPORTATION, BY COUNTRY 2022 AND 2032(%)
- FIGURE 17. COMPARATIVE SHARE ANALYSIS OF FIBERGLASS CUTTING ROBOTS MARKET FOR PIPE AND TANK, BY COUNTRY 2022 AND 2032(%)
- FIGURE 18. COMPARATIVE SHARE ANALYSIS OF FIBERGLASS CUTTING ROBOTS MARKET FOR WIND ENERGY, BY COUNTRY 2022 AND 2032(%)
- FIGURE 19. COMPARATIVE SHARE ANALYSIS OF FIBERGLASS CUTTING ROBOTS MARKET FOR OTHERS, BY COUNTRY 2022 AND 2032(%)
- FIGURE 20. FIBERGLASS CUTTING ROBOTS MARKET, BY PAYLOAD, 2022 AND 2032(%)
- FIGURE 21. COMPARATIVE SHARE ANALYSIS OF FIBERGLASS CUTTING ROBOTS MARKET FOR LIGHT, BY COUNTRY 2022 AND 2032(%)
- FIGURE 22. COMPARATIVE SHARE ANALYSIS OF FIBERGLASS CUTTING ROBOTS MARKET FOR MEDIUM, BY COUNTRY 2022 AND 2032(%)
- FIGURE 23. COMPARATIVE SHARE ANALYSIS OF FIBERGLASS CUTTING ROBOTS MARKET FOR HEAVY, BY COUNTRY 2022 AND 2032(%)
- FIGURE 24. FIBERGLASS CUTTING ROBOTS MARKET, BY REACH, 2022 AND 2032(%)
- FIGURE 25. COMPARATIVE SHARE ANALYSIS OF FIBERGLASS CUTTING ROBOTS MARKET FOR UP TO 2000 MM, BY COUNTRY 2022 AND 2032(%)
- FIGURE 26. COMPARATIVE SHARE ANALYSIS OF FIBERGLASS CUTTING ROBOTS MARKET FOR MORE THAN 2000 MM, BY COUNTRY 2022 AND 2032(%)
- FIGURE 27. FIBERGLASS CUTTING ROBOTS MARKET BY REGION, 2022 AND 2032(%)
- FIGURE 28. U.S. FIBERGLASS CUTTING ROBOTS MARKET, 2022-2032 ($THOUSAND)
- FIGURE 29. CANADA FIBERGLASS CUTTING ROBOTS MARKET, 2022-2032 ($THOUSAND)
- FIGURE 30. MEXICO FIBERGLASS CUTTING ROBOTS MARKET, 2022-2032 ($THOUSAND)
- FIGURE 31. GERMANY FIBERGLASS CUTTING ROBOTS MARKET, 2022-2032 ($THOUSAND)
- FIGURE 32. FRANCE FIBERGLASS CUTTING ROBOTS MARKET, 2022-2032 ($THOUSAND)
- FIGURE 33. UK FIBERGLASS CUTTING ROBOTS MARKET, 2022-2032 ($THOUSAND)
- FIGURE 34. ITALY FIBERGLASS CUTTING ROBOTS MARKET, 2022-2032 ($THOUSAND)
- FIGURE 35. REST OF EUROPE FIBERGLASS CUTTING ROBOTS MARKET, 2022-2032 ($THOUSAND)
- FIGURE 36. CHINA FIBERGLASS CUTTING ROBOTS MARKET, 2022-2032 ($THOUSAND)
- FIGURE 37. JAPAN FIBERGLASS CUTTING ROBOTS MARKET, 2022-2032 ($THOUSAND)
- FIGURE 38. INDIA FIBERGLASS CUTTING ROBOTS MARKET, 2022-2032 ($THOUSAND)
- FIGURE 39. SOUTH KOREA FIBERGLASS CUTTING ROBOTS MARKET, 2022-2032 ($THOUSAND)
- FIGURE 40. REST OF ASIA-PACIFIC FIBERGLASS CUTTING ROBOTS MARKET, 2022-2032 ($THOUSAND)
- FIGURE 41. LATIN AMERICA FIBERGLASS CUTTING ROBOTS MARKET, 2022-2032 ($THOUSAND)
- FIGURE 42. MIDDLE EAST FIBERGLASS CUTTING ROBOTS MARKET, 2022-2032 ($THOUSAND)
- FIGURE 43. AFRICA FIBERGLASS CUTTING ROBOTS MARKET, 2022-2032 ($THOUSAND)
- FIGURE 44. TOP WINNING STRATEGIES, BY YEAR (2022-2023)
- FIGURE 45. TOP WINNING STRATEGIES, BY DEVELOPMENT (2022-2023)
- FIGURE 46. TOP WINNING STRATEGIES, BY COMPANY (2022-2023)
- FIGURE 47. PRODUCT MAPPING OF TOP 10 PLAYERS
- FIGURE 48. COMPETITIVE DASHBOARD
- FIGURE 49. COMPETITIVE HEATMAP: FIBERGLASS CUTTING ROBOTS MARKET
- FIGURE 50. TOP PLAYER POSITIONING, 2022
- FIGURE 51. KUKA AG: NET REVENUE, 2020-2022 ($MILLION)
- FIGURE 52. KUKA AG: RESEARCH & DEVELOPMENT EXPENDITURE, 2020-2022 ($MILLION)
- FIGURE 53. KUKA AG: REVENUE SHARE BY SEGMENT, 2022 (%)
- FIGURE 54. KUKA AG: REVENUE SHARE BY REGION, 2022 (%)
- FIGURE 55. FANUC CORPORATION: NET SALES, 2020-2022 ($MILLION)
- FIGURE 56. FANUC CORPORATION: REVENUE SHARE BY SEGMENT, 2022 (%)
- FIGURE 57. FANUC CORPORATION: REVENUE SHARE BY REGION, 2022 (%)
- FIGURE 58. KAWASAKI HEAVY INDUSTRIES, LTD.: NET REVENUE, 2020-2022 ($MILLION)
- FIGURE 59. KAWASAKI HEAVY INDUSTRIES, LTD.: RESEARCH & DEVELOPMENT EXPENDITURE, 2020-2022 ($MILLION)
- FIGURE 60. KAWASAKI HEAVY INDUSTRIES, LTD.: REVENUE SHARE BY SEGMENT, 2022 (%)
- FIGURE 61. KAWASAKI HEAVY INDUSTRIES, LTD.: REVENUE SHARE BY REGION, 2022 (%)
- FIGURE 62. ABB: NET REVENUE, 2020-2022 ($MILLION)
- FIGURE 63. ABB: REVENUE SHARE BY SEGMENT, 2022 (%)
- FIGURE 64. ABB: REVENUE SHARE BY REGION, 2022 (%)
- FIGURE 65. YASKAWA ELECTRIC CORPORATION: NET REVENUE, 2020-2022 ($MILLION)
- FIGURE 66. YASKAWA ELECTRIC CORPORATION: REVENUE SHARE BY SEGMENT, 2022 (%)
- FIGURE 67. YASKAWA ELECTRIC CORPORATION: REVENUE SHARE BY REGION, 2022 (%)
- FIGURE 68. DENSO CORPORATION: NET REVENUE, 2020-2022 ($MILLION)
- FIGURE 69. DENSO CORPORATION: REVENUE SHARE BY SEGMENT, 2022 (%)
- FIGURE 70. DENSO CORPORATION: REVENUE SHARE BY REGION, 2022 (%)
- FIGURE 71. DAIHEN CORPORATION: NET SALES, 2019-2021 ($MILLION)
- FIGURE 72. DAIHEN CORPORATION: RESEARCH & DEVELOPMENT EXPENDITURE, 2019-2021 ($MILLION)
- FIGURE 73. DAIHEN CORPORATION: REVENUE SHARE BY SEGMENT, 2021 (%)
- FIGURE 74. UNIVERSAL ROBOTS A/S: NET REVENUE, 2020-2022 ($MILLION)
- FIGURE 75. COMAU S.P.A.: NET REVENUE, 2020-2022 ($MILLION)
- FIGURE 76. COMAU S.P.A.: RESEARCH & DEVELOPMENT EXPENDITURE, 2020-2022 ($MILLION)
- FIGURE 77. COMAU S.P.A.: REVENUE SHARE BY REGION, 2022 (%)
- FIGURE 78. SEIKO EPSON CORPORATION.: NET REVENUE, 2021-2023 ($MILLION)
- FIGURE 79. SEIKO EPSON CORPORATION.: REVENUE SHARE BY SEGMENT, 2021 (%)
- FIGURE 80. SEIKO EPSON CORPORATION.: REVENUE SHARE BY REGION, 2021 (%)

