
PUBLISHER: Allied Market Research | PRODUCT CODE: 1414749

PUBLISHER: Allied Market Research | PRODUCT CODE: 1414749
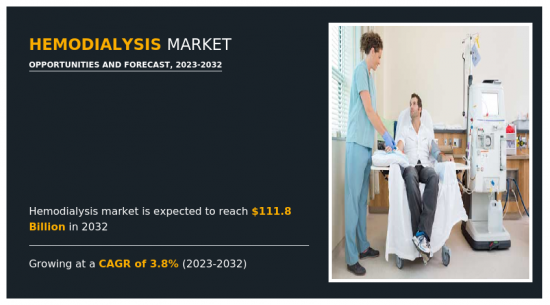
Hemodialysis Market By Product and Service, By Type, By Dialysis Site : Global Opportunity Analysis and Industry Forecast, 2023-2032
According to a new report published by Allied Market Research, titled, "Hemodialysis Market," The hemodialysis market was valued at $76.9 billion in 2022, and is estimated to reach $111.8 billion by 2032, growing at a CAGR of 3.8% from 2023 to 2032. Hemodialysis is a medical procedure used to treat individuals with end-stage renal disease (ESRD) or severe kidney dysfunction. This therapy involves the removal of waste products and excess fluids from the blood when the kidneys are no longer able to perform this vital function adequately.
Possible Customization with this report (with additional cost and timeline, please talk to the sales executive to know more)
- Go To Market Strategy
- Market share analysis of players by products/segments
- New Product Development/ Product Matrix of Key Players
- Additional company profiles with specific to client's interest
- Average Selling Price Analysis / Price Point Analysis
- Brands Share Analysis
- Key player details (including location, contact details, supplier/vendor network etc. in excel format)
- SWOT Analysis
Key Market Segments
By Type
- Conventional Hemodialysis
- Daily Hemodialysis
- Nocturnal Hemodialysis
By Dialysis Site
- In-center dialysis
- Home dialysis
By Product and Service
- Consumables
- Type
- Dialyzers
- Catheters
- Other Hemodialysis Consumables
- Equipments
- Type
- Dialysis Machines
- Hemodialysis Water Treatment Systems
- Others Hemodialysis Equipment
- Drugs
- Services
By Region
- North America
- U.S.
- Canada
- Mexico
- Europe
- Germany
- France
- UK
- Italy
- Spain
- Rest of Europe
- Asia-Pacific
- Japan
- China
- Australia
- India
- South Korea
- Rest of Asia-Pacific
- LAMEA
- Brazil
- Saudi Arabia
- South Africa
- Rest of LAMEA
Key Market Players:
- Baxter International Inc.
- B. Braun Melsungen AG
- Nipro Corporation
- DaVita Inc.
- Fresenius Medical Care AG & Co. KGaA
- Diaverum Holding AB
- Nikkiso Co., Ltd
- TORAY INDUSTRIES, INC.
- Asahi Kasei Corporation.
- Rockwell Medical Technologies Inc.
TABLE OF CONTENTS
CHAPTER 1: INTRODUCTION
- 1.1. Report description
- 1.2. Key market segments
- 1.3. Key benefits to the stakeholders
- 1.4. Research methodology
- 1.4.1. Primary research
- 1.4.2. Secondary research
- 1.4.3. Analyst tools and models
CHAPTER 2: EXECUTIVE SUMMARY
- 2.1. CXO Perspective
CHAPTER 3: MARKET OVERVIEW
- 3.1. Market definition and scope
- 3.2. Key findings
- 3.2.1. Top impacting factors
- 3.2.2. Top investment pockets
- 3.3. Porter's five forces analysis
- 3.3.1. Low bargaining power of suppliers
- 3.3.2. Low threat of new entrants
- 3.3.3. Low threat of substitutes
- 3.3.4. Low intensity of rivalry
- 3.3.5. Low bargaining power of buyers
- 3.4. Market dynamics
- 3.4.1. Drivers
- 3.4.1.1. Rise in prevalence of end stage renal disease (ESRD)
- 3.4.1.2. Rise in awareness regarding hemodialysis
- 3.4.1.3. Rise in incidence of diabetes and hypertension
- 3.4.1.4. Shortage of kidneys for transplantation
- 3.4.2. Restraints
- 3.4.2.1. Risks and complications associated with dialysis
- 3.4.3. Opportunities
- 3.4.3.1. Rise in adoption of key strategy
- 3.4.3.2. Growth opportunities in emerging economies
- 3.4.1. Drivers
CHAPTER 4: HEMODIALYSIS MARKET, BY PRODUCT AND SERVICE
- 4.1. Overview
- 4.1.1. Market size and forecast
- 4.2. Equipments
- 4.2.1. Key market trends, growth factors and opportunities
- 4.2.2. Market size and forecast, by region
- 4.2.3. Market share analysis by country
- 4.2.4. Equipments Hemodialysis Market by Type
- 4.3. Consumables
- 4.3.1. Key market trends, growth factors and opportunities
- 4.3.2. Market size and forecast, by region
- 4.3.3. Market share analysis by country
- 4.3.4. Consumables Hemodialysis Market by Type
- 4.4. Drugs
- 4.4.1. Key market trends, growth factors and opportunities
- 4.4.2. Market size and forecast, by region
- 4.4.3. Market share analysis by country
- 4.5. Services
- 4.5.1. Key market trends, growth factors and opportunities
- 4.5.2. Market size and forecast, by region
- 4.5.3. Market share analysis by country
CHAPTER 5: HEMODIALYSIS MARKET, BY TYPE
- 5.1. Overview
- 5.1.1. Market size and forecast
- 5.2. Conventional Hemodialysis
- 5.2.1. Key market trends, growth factors and opportunities
- 5.2.2. Market size and forecast, by region
- 5.2.3. Market share analysis by country
- 5.3. Daily Hemodialysis
- 5.3.1. Key market trends, growth factors and opportunities
- 5.3.2. Market size and forecast, by region
- 5.3.3. Market share analysis by country
- 5.4. Nocturnal Hemodialysis
- 5.4.1. Key market trends, growth factors and opportunities
- 5.4.2. Market size and forecast, by region
- 5.4.3. Market share analysis by country
CHAPTER 6: HEMODIALYSIS MARKET, BY DIALYSIS SITE
- 6.1. Overview
- 6.1.1. Market size and forecast
- 6.2. In-center dialysis
- 6.2.1. Key market trends, growth factors and opportunities
- 6.2.2. Market size and forecast, by region
- 6.2.3. Market share analysis by country
- 6.3. Home dialysis
- 6.3.1. Key market trends, growth factors and opportunities
- 6.3.2. Market size and forecast, by region
- 6.3.3. Market share analysis by country
CHAPTER 7: HEMODIALYSIS MARKET, BY REGION
- 7.1. Overview
- 7.1.1. Market size and forecast By Region
- 7.2. North America
- 7.2.1. Key market trends, growth factors and opportunities
- 7.2.2. Market size and forecast, by Product and Service
- 7.2.3. Market size and forecast, by Type
- 7.2.4. Market size and forecast, by Dialysis Site
- 7.2.5. Market size and forecast, by country
- 7.2.5.1. U.S.
- 7.2.5.1.1. Market size and forecast, by Product and Service
- 7.2.5.1.2. Market size and forecast, by Type
- 7.2.5.1.3. Market size and forecast, by Dialysis Site
- 7.2.5.2. Canada
- 7.2.5.2.1. Market size and forecast, by Product and Service
- 7.2.5.2.2. Market size and forecast, by Type
- 7.2.5.2.3. Market size and forecast, by Dialysis Site
- 7.2.5.3. Mexico
- 7.2.5.3.1. Market size and forecast, by Product and Service
- 7.2.5.3.2. Market size and forecast, by Type
- 7.2.5.3.3. Market size and forecast, by Dialysis Site
- 7.3. Europe
- 7.3.1. Key market trends, growth factors and opportunities
- 7.3.2. Market size and forecast, by Product and Service
- 7.3.3. Market size and forecast, by Type
- 7.3.4. Market size and forecast, by Dialysis Site
- 7.3.5. Market size and forecast, by country
- 7.3.5.1. Germany
- 7.3.5.1.1. Market size and forecast, by Product and Service
- 7.3.5.1.2. Market size and forecast, by Type
- 7.3.5.1.3. Market size and forecast, by Dialysis Site
- 7.3.5.2. France
- 7.3.5.2.1. Market size and forecast, by Product and Service
- 7.3.5.2.2. Market size and forecast, by Type
- 7.3.5.2.3. Market size and forecast, by Dialysis Site
- 7.3.5.3. UK
- 7.3.5.3.1. Market size and forecast, by Product and Service
- 7.3.5.3.2. Market size and forecast, by Type
- 7.3.5.3.3. Market size and forecast, by Dialysis Site
- 7.3.5.4. Italy
- 7.3.5.4.1. Market size and forecast, by Product and Service
- 7.3.5.4.2. Market size and forecast, by Type
- 7.3.5.4.3. Market size and forecast, by Dialysis Site
- 7.3.5.5. Spain
- 7.3.5.5.1. Market size and forecast, by Product and Service
- 7.3.5.5.2. Market size and forecast, by Type
- 7.3.5.5.3. Market size and forecast, by Dialysis Site
- 7.3.5.6. Rest of Europe
- 7.3.5.6.1. Market size and forecast, by Product and Service
- 7.3.5.6.2. Market size and forecast, by Type
- 7.3.5.6.3. Market size and forecast, by Dialysis Site
- 7.4. Asia-Pacific
- 7.4.1. Key market trends, growth factors and opportunities
- 7.4.2. Market size and forecast, by Product and Service
- 7.4.3. Market size and forecast, by Type
- 7.4.4. Market size and forecast, by Dialysis Site
- 7.4.5. Market size and forecast, by country
- 7.4.5.1. Japan
- 7.4.5.1.1. Market size and forecast, by Product and Service
- 7.4.5.1.2. Market size and forecast, by Type
- 7.4.5.1.3. Market size and forecast, by Dialysis Site
- 7.4.5.2. China
- 7.4.5.2.1. Market size and forecast, by Product and Service
- 7.4.5.2.2. Market size and forecast, by Type
- 7.4.5.2.3. Market size and forecast, by Dialysis Site
- 7.4.5.3. Australia
- 7.4.5.3.1. Market size and forecast, by Product and Service
- 7.4.5.3.2. Market size and forecast, by Type
- 7.4.5.3.3. Market size and forecast, by Dialysis Site
- 7.4.5.4. India
- 7.4.5.4.1. Market size and forecast, by Product and Service
- 7.4.5.4.2. Market size and forecast, by Type
- 7.4.5.4.3. Market size and forecast, by Dialysis Site
- 7.4.5.5. South Korea
- 7.4.5.5.1. Market size and forecast, by Product and Service
- 7.4.5.5.2. Market size and forecast, by Type
- 7.4.5.5.3. Market size and forecast, by Dialysis Site
- 7.4.5.6. Rest of Asia-Pacific
- 7.4.5.6.1. Market size and forecast, by Product and Service
- 7.4.5.6.2. Market size and forecast, by Type
- 7.4.5.6.3. Market size and forecast, by Dialysis Site
- 7.5. LAMEA
- 7.5.1. Key market trends, growth factors and opportunities
- 7.5.2. Market size and forecast, by Product and Service
- 7.5.3. Market size and forecast, by Type
- 7.5.4. Market size and forecast, by Dialysis Site
- 7.5.5. Market size and forecast, by country
- 7.5.5.1. Brazil
- 7.5.5.1.1. Market size and forecast, by Product and Service
- 7.5.5.1.2. Market size and forecast, by Type
- 7.5.5.1.3. Market size and forecast, by Dialysis Site
- 7.5.5.2. Saudi Arabia
- 7.5.5.2.1. Market size and forecast, by Product and Service
- 7.5.5.2.2. Market size and forecast, by Type
- 7.5.5.2.3. Market size and forecast, by Dialysis Site
- 7.5.5.3. South Africa
- 7.5.5.3.1. Market size and forecast, by Product and Service
- 7.5.5.3.2. Market size and forecast, by Type
- 7.5.5.3.3. Market size and forecast, by Dialysis Site
- 7.5.5.4. Rest of LAMEA
- 7.5.5.4.1. Market size and forecast, by Product and Service
- 7.5.5.4.2. Market size and forecast, by Type
- 7.5.5.4.3. Market size and forecast, by Dialysis Site
CHAPTER 8: COMPETITIVE LANDSCAPE
- 8.1. Introduction
- 8.2. Top winning strategies
- 8.3. Product mapping of top 10 player
- 8.4. Competitive dashboard
- 8.5. Competitive heatmap
- 8.6. Top player positioning, 2022
CHAPTER 9: COMPANY PROFILES
- 9.1. Baxter International Inc.
- 9.1.1. Company overview
- 9.1.2. Key executives
- 9.1.3. Company snapshot
- 9.1.4. Operating business segments
- 9.1.5. Product portfolio
- 9.1.6. Business performance
- 9.1.7. Key strategic moves and developments
- 9.2. B. Braun Melsungen AG
- 9.2.1. Company overview
- 9.2.2. Key executives
- 9.2.3. Company snapshot
- 9.2.4. Operating business segments
- 9.2.5. Product portfolio
- 9.2.6. Business performance
- 9.2.7. Key strategic moves and developments
- 9.3. Asahi Kasei Corporation.
- 9.3.1. Company overview
- 9.3.2. Key executives
- 9.3.3. Company snapshot
- 9.3.4. Operating business segments
- 9.3.5. Product portfolio
- 9.3.6. Business performance
- 9.4. DaVita Inc.
- 9.4.1. Company overview
- 9.4.2. Key executives
- 9.4.3. Company snapshot
- 9.4.4. Operating business segments
- 9.4.5. Product portfolio
- 9.4.6. Business performance
- 9.4.7. Key strategic moves and developments
- 9.5. Nikkiso Co., Ltd
- 9.5.1. Company overview
- 9.5.2. Key executives
- 9.5.3. Company snapshot
- 9.5.4. Operating business segments
- 9.5.5. Product portfolio
- 9.5.6. Business performance
- 9.6. Nipro Corporation
- 9.6.1. Company overview
- 9.6.2. Key executives
- 9.6.3. Company snapshot
- 9.6.4. Operating business segments
- 9.6.5. Product portfolio
- 9.6.6. Business performance
- 9.6.7. Key strategic moves and developments
- 9.7. Fresenius Medical Care AG & Co. KGaA
- 9.7.1. Company overview
- 9.7.2. Key executives
- 9.7.3. Company snapshot
- 9.7.4. Operating business segments
- 9.7.5. Product portfolio
- 9.7.6. Business performance
- 9.7.7. Key strategic moves and developments
- 9.8. Diaverum Holding AB
- 9.8.1. Company overview
- 9.8.2. Key executives
- 9.8.3. Company snapshot
- 9.8.4. Operating business segments
- 9.8.5. Product portfolio
- 9.8.6. Key strategic moves and developments
- 9.9. Rockwell Medical Technologies Inc.
- 9.9.1. Company overview
- 9.9.2. Key executives
- 9.9.3. Company snapshot
- 9.9.4. Operating business segments
- 9.9.5. Product portfolio
- 9.9.6. Business performance
- 9.9.7. Key strategic moves and developments
- 9.10. TORAY INDUSTRIES, INC.
- 9.10.1. Company overview
- 9.10.2. Key executives
- 9.10.3. Company snapshot
- 9.10.4. Operating business segments
- 9.10.5. Product portfolio
- 9.10.6. Business performance
- 9.10.7. Key strategic moves and developments
LIST OF TABLES
- TABLE 01. GLOBAL HEMODIALYSIS MARKET, BY PRODUCT AND SERVICE, 2022-2032 ($MILLION)
- TABLE 02. HEMODIALYSIS MARKET FOR EQUIPMENTS, BY REGION, 2022-2032 ($MILLION)
- TABLE 03. GLOBAL EQUIPMENTS HEMODIALYSIS MARKET, BY TYPE, 2022-2032 ($MILLION)
- TABLE 04. HEMODIALYSIS MARKET FOR CONSUMABLES, BY REGION, 2022-2032 ($MILLION)
- TABLE 05. GLOBAL CONSUMABLES HEMODIALYSIS MARKET, BY TYPE, 2022-2032 ($MILLION)
- TABLE 06. HEMODIALYSIS MARKET FOR DRUGS, BY REGION, 2022-2032 ($MILLION)
- TABLE 07. HEMODIALYSIS MARKET FOR SERVICES, BY REGION, 2022-2032 ($MILLION)
- TABLE 08. GLOBAL HEMODIALYSIS MARKET, BY TYPE, 2022-2032 ($MILLION)
- TABLE 09. HEMODIALYSIS MARKET FOR CONVENTIONAL HEMODIALYSIS, BY REGION, 2022-2032 ($MILLION)
- TABLE 10. HEMODIALYSIS MARKET FOR DAILY HEMODIALYSIS, BY REGION, 2022-2032 ($MILLION)
- TABLE 11. HEMODIALYSIS MARKET FOR NOCTURNAL HEMODIALYSIS, BY REGION, 2022-2032 ($MILLION)
- TABLE 12. GLOBAL HEMODIALYSIS MARKET, BY DIALYSIS SITE, 2022-2032 ($MILLION)
- TABLE 13. HEMODIALYSIS MARKET FOR IN-CENTER DIALYSIS, BY REGION, 2022-2032 ($MILLION)
- TABLE 14. HEMODIALYSIS MARKET FOR HOME DIALYSIS, BY REGION, 2022-2032 ($MILLION)
- TABLE 15. HEMODIALYSIS MARKET, BY REGION, 2022-2032 ($MILLION)
- TABLE 16. NORTH AMERICA HEMODIALYSIS MARKET, BY PRODUCT AND SERVICE, 2022-2032 ($MILLION)
- TABLE 17. NORTH AMERICA HEMODIALYSIS MARKET, BY TYPE, 2022-2032 ($MILLION)
- TABLE 18. NORTH AMERICA HEMODIALYSIS MARKET, BY DIALYSIS SITE, 2022-2032 ($MILLION)
- TABLE 19. NORTH AMERICA HEMODIALYSIS MARKET, BY COUNTRY, 2022-2032 ($MILLION)
- TABLE 20. U.S. HEMODIALYSIS MARKET, BY PRODUCT AND SERVICE, 2022-2032 ($MILLION)
- TABLE 21. U.S. HEMODIALYSIS MARKET, BY TYPE, 2022-2032 ($MILLION)
- TABLE 22. U.S. HEMODIALYSIS MARKET, BY DIALYSIS SITE, 2022-2032 ($MILLION)
- TABLE 23. CANADA HEMODIALYSIS MARKET, BY PRODUCT AND SERVICE, 2022-2032 ($MILLION)
- TABLE 24. CANADA HEMODIALYSIS MARKET, BY TYPE, 2022-2032 ($MILLION)
- TABLE 25. CANADA HEMODIALYSIS MARKET, BY DIALYSIS SITE, 2022-2032 ($MILLION)
- TABLE 26. MEXICO HEMODIALYSIS MARKET, BY PRODUCT AND SERVICE, 2022-2032 ($MILLION)
- TABLE 27. MEXICO HEMODIALYSIS MARKET, BY TYPE, 2022-2032 ($MILLION)
- TABLE 28. MEXICO HEMODIALYSIS MARKET, BY DIALYSIS SITE, 2022-2032 ($MILLION)
- TABLE 29. EUROPE HEMODIALYSIS MARKET, BY PRODUCT AND SERVICE, 2022-2032 ($MILLION)
- TABLE 30. EUROPE HEMODIALYSIS MARKET, BY TYPE, 2022-2032 ($MILLION)
- TABLE 31. EUROPE HEMODIALYSIS MARKET, BY DIALYSIS SITE, 2022-2032 ($MILLION)
- TABLE 32. EUROPE HEMODIALYSIS MARKET, BY COUNTRY, 2022-2032 ($MILLION)
- TABLE 33. GERMANY HEMODIALYSIS MARKET, BY PRODUCT AND SERVICE, 2022-2032 ($MILLION)
- TABLE 34. GERMANY HEMODIALYSIS MARKET, BY TYPE, 2022-2032 ($MILLION)
- TABLE 35. GERMANY HEMODIALYSIS MARKET, BY DIALYSIS SITE, 2022-2032 ($MILLION)
- TABLE 36. FRANCE HEMODIALYSIS MARKET, BY PRODUCT AND SERVICE, 2022-2032 ($MILLION)
- TABLE 37. FRANCE HEMODIALYSIS MARKET, BY TYPE, 2022-2032 ($MILLION)
- TABLE 38. FRANCE HEMODIALYSIS MARKET, BY DIALYSIS SITE, 2022-2032 ($MILLION)
- TABLE 39. UK HEMODIALYSIS MARKET, BY PRODUCT AND SERVICE, 2022-2032 ($MILLION)
- TABLE 40. UK HEMODIALYSIS MARKET, BY TYPE, 2022-2032 ($MILLION)
- TABLE 41. UK HEMODIALYSIS MARKET, BY DIALYSIS SITE, 2022-2032 ($MILLION)
- TABLE 42. ITALY HEMODIALYSIS MARKET, BY PRODUCT AND SERVICE, 2022-2032 ($MILLION)
- TABLE 43. ITALY HEMODIALYSIS MARKET, BY TYPE, 2022-2032 ($MILLION)
- TABLE 44. ITALY HEMODIALYSIS MARKET, BY DIALYSIS SITE, 2022-2032 ($MILLION)
- TABLE 45. SPAIN HEMODIALYSIS MARKET, BY PRODUCT AND SERVICE, 2022-2032 ($MILLION)
- TABLE 46. SPAIN HEMODIALYSIS MARKET, BY TYPE, 2022-2032 ($MILLION)
- TABLE 47. SPAIN HEMODIALYSIS MARKET, BY DIALYSIS SITE, 2022-2032 ($MILLION)
- TABLE 48. REST OF EUROPE HEMODIALYSIS MARKET, BY PRODUCT AND SERVICE, 2022-2032 ($MILLION)
- TABLE 49. REST OF EUROPE HEMODIALYSIS MARKET, BY TYPE, 2022-2032 ($MILLION)
- TABLE 50. REST OF EUROPE HEMODIALYSIS MARKET, BY DIALYSIS SITE, 2022-2032 ($MILLION)
- TABLE 51. ASIA-PACIFIC HEMODIALYSIS MARKET, BY PRODUCT AND SERVICE, 2022-2032 ($MILLION)
- TABLE 52. ASIA-PACIFIC HEMODIALYSIS MARKET, BY TYPE, 2022-2032 ($MILLION)
- TABLE 53. ASIA-PACIFIC HEMODIALYSIS MARKET, BY DIALYSIS SITE, 2022-2032 ($MILLION)
- TABLE 54. ASIA-PACIFIC HEMODIALYSIS MARKET, BY COUNTRY, 2022-2032 ($MILLION)
- TABLE 55. JAPAN HEMODIALYSIS MARKET, BY PRODUCT AND SERVICE, 2022-2032 ($MILLION)
- TABLE 56. JAPAN HEMODIALYSIS MARKET, BY TYPE, 2022-2032 ($MILLION)
- TABLE 57. JAPAN HEMODIALYSIS MARKET, BY DIALYSIS SITE, 2022-2032 ($MILLION)
- TABLE 58. CHINA HEMODIALYSIS MARKET, BY PRODUCT AND SERVICE, 2022-2032 ($MILLION)
- TABLE 59. CHINA HEMODIALYSIS MARKET, BY TYPE, 2022-2032 ($MILLION)
- TABLE 60. CHINA HEMODIALYSIS MARKET, BY DIALYSIS SITE, 2022-2032 ($MILLION)
- TABLE 61. AUSTRALIA HEMODIALYSIS MARKET, BY PRODUCT AND SERVICE, 2022-2032 ($MILLION)
- TABLE 62. AUSTRALIA HEMODIALYSIS MARKET, BY TYPE, 2022-2032 ($MILLION)
- TABLE 63. AUSTRALIA HEMODIALYSIS MARKET, BY DIALYSIS SITE, 2022-2032 ($MILLION)
- TABLE 64. INDIA HEMODIALYSIS MARKET, BY PRODUCT AND SERVICE, 2022-2032 ($MILLION)
- TABLE 65. INDIA HEMODIALYSIS MARKET, BY TYPE, 2022-2032 ($MILLION)
- TABLE 66. INDIA HEMODIALYSIS MARKET, BY DIALYSIS SITE, 2022-2032 ($MILLION)
- TABLE 67. SOUTH KOREA HEMODIALYSIS MARKET, BY PRODUCT AND SERVICE, 2022-2032 ($MILLION)
- TABLE 68. SOUTH KOREA HEMODIALYSIS MARKET, BY TYPE, 2022-2032 ($MILLION)
- TABLE 69. SOUTH KOREA HEMODIALYSIS MARKET, BY DIALYSIS SITE, 2022-2032 ($MILLION)
- TABLE 70. REST OF ASIA-PACIFIC HEMODIALYSIS MARKET, BY PRODUCT AND SERVICE, 2022-2032 ($MILLION)
- TABLE 71. REST OF ASIA-PACIFIC HEMODIALYSIS MARKET, BY TYPE, 2022-2032 ($MILLION)
- TABLE 72. REST OF ASIA-PACIFIC HEMODIALYSIS MARKET, BY DIALYSIS SITE, 2022-2032 ($MILLION)
- TABLE 73. LAMEA HEMODIALYSIS MARKET, BY PRODUCT AND SERVICE, 2022-2032 ($MILLION)
- TABLE 74. LAMEA HEMODIALYSIS MARKET, BY TYPE, 2022-2032 ($MILLION)
- TABLE 75. LAMEA HEMODIALYSIS MARKET, BY DIALYSIS SITE, 2022-2032 ($MILLION)
- TABLE 76. LAMEA HEMODIALYSIS MARKET, BY COUNTRY, 2022-2032 ($MILLION)
- TABLE 77. BRAZIL HEMODIALYSIS MARKET, BY PRODUCT AND SERVICE, 2022-2032 ($MILLION)
- TABLE 78. BRAZIL HEMODIALYSIS MARKET, BY TYPE, 2022-2032 ($MILLION)
- TABLE 79. BRAZIL HEMODIALYSIS MARKET, BY DIALYSIS SITE, 2022-2032 ($MILLION)
- TABLE 80. SAUDI ARABIA HEMODIALYSIS MARKET, BY PRODUCT AND SERVICE, 2022-2032 ($MILLION)
- TABLE 81. SAUDI ARABIA HEMODIALYSIS MARKET, BY TYPE, 2022-2032 ($MILLION)
- TABLE 82. SAUDI ARABIA HEMODIALYSIS MARKET, BY DIALYSIS SITE, 2022-2032 ($MILLION)
- TABLE 83. SOUTH AFRICA HEMODIALYSIS MARKET, BY PRODUCT AND SERVICE, 2022-2032 ($MILLION)
- TABLE 84. SOUTH AFRICA HEMODIALYSIS MARKET, BY TYPE, 2022-2032 ($MILLION)
- TABLE 85. SOUTH AFRICA HEMODIALYSIS MARKET, BY DIALYSIS SITE, 2022-2032 ($MILLION)
- TABLE 86. REST OF LAMEA HEMODIALYSIS MARKET, BY PRODUCT AND SERVICE, 2022-2032 ($MILLION)
- TABLE 87. REST OF LAMEA HEMODIALYSIS MARKET, BY TYPE, 2022-2032 ($MILLION)
- TABLE 88. REST OF LAMEA HEMODIALYSIS MARKET, BY DIALYSIS SITE, 2022-2032 ($MILLION)
- TABLE 89. BAXTER INTERNATIONAL INC.: KEY EXECUTIVES
- TABLE 90. BAXTER INTERNATIONAL INC.: COMPANY SNAPSHOT
- TABLE 91. BAXTER INTERNATIONAL INC.: PRODUCT SEGMENTS
- TABLE 92. BAXTER INTERNATIONAL INC.: PRODUCT PORTFOLIO
- TABLE 93. BAXTER INTERNATIONAL INC.: KEY STRATERGIES
- TABLE 94. B. BRAUN MELSUNGEN AG: KEY EXECUTIVES
- TABLE 95. B. BRAUN MELSUNGEN AG: COMPANY SNAPSHOT
- TABLE 96. B. BRAUN MELSUNGEN AG: PRODUCT SEGMENTS
- TABLE 97. B. BRAUN MELSUNGEN AG: PRODUCT PORTFOLIO
- TABLE 98. B. BRAUN MELSUNGEN AG: KEY STRATERGIES
- TABLE 99. ASAHI KASEI CORPORATION.: KEY EXECUTIVES
- TABLE 100. ASAHI KASEI CORPORATION.: COMPANY SNAPSHOT
- TABLE 101. ASAHI KASEI CORPORATION.: PRODUCT SEGMENTS
- TABLE 102. ASAHI KASEI CORPORATION.: PRODUCT PORTFOLIO
- TABLE 103. DAVITA INC.: KEY EXECUTIVES
- TABLE 104. DAVITA INC.: COMPANY SNAPSHOT
- TABLE 105. DAVITA INC.: SERVICE SEGMENTS
- TABLE 106. DAVITA INC.: PRODUCT PORTFOLIO
- TABLE 107. DAVITA INC.: KEY STRATERGIES
- TABLE 108. NIKKISO CO., LTD: KEY EXECUTIVES
- TABLE 109. NIKKISO CO., LTD: COMPANY SNAPSHOT
- TABLE 110. NIKKISO CO., LTD: PRODUCT SEGMENTS
- TABLE 111. NIKKISO CO., LTD: PRODUCT PORTFOLIO
- TABLE 112. NIPRO CORPORATION: KEY EXECUTIVES
- TABLE 113. NIPRO CORPORATION: COMPANY SNAPSHOT
- TABLE 114. NIPRO CORPORATION: PRODUCT SEGMENTS
- TABLE 115. NIPRO CORPORATION: PRODUCT PORTFOLIO
- TABLE 116. NIPRO CORPORATION: KEY STRATERGIES
- TABLE 117. FRESENIUS MEDICAL CARE AG & CO. KGAA: KEY EXECUTIVES
- TABLE 118. FRESENIUS MEDICAL CARE AG & CO. KGAA: COMPANY SNAPSHOT
- TABLE 119. FRESENIUS MEDICAL CARE AG & CO. KGAA: PRODUCT SEGMENTS
- TABLE 120. FRESENIUS MEDICAL CARE AG & CO. KGAA: PRODUCT PORTFOLIO
- TABLE 121. FRESENIUS MEDICAL CARE AG & CO. KGAA: KEY STRATERGIES
- TABLE 122. DIAVERUM HOLDING AB: KEY EXECUTIVES
- TABLE 123. DIAVERUM HOLDING AB: COMPANY SNAPSHOT
- TABLE 124. DIAVERUM HOLDING AB: PRODUCT SEGMENTS
- TABLE 125. DIAVERUM HOLDING AB: PRODUCT PORTFOLIO
- TABLE 126. DIAVERUM HOLDING AB: KEY STRATERGIES
- TABLE 127. ROCKWELL MEDICAL TECHNOLOGIES INC.: KEY EXECUTIVES
- TABLE 128. ROCKWELL MEDICAL TECHNOLOGIES INC.: COMPANY SNAPSHOT
- TABLE 129. ROCKWELL MEDICAL TECHNOLOGIES INC.: PRODUCT SEGMENTS
- TABLE 130. ROCKWELL MEDICAL TECHNOLOGIES INC.: SERVICE SEGMENTS
- TABLE 131. ROCKWELL MEDICAL TECHNOLOGIES INC.: PRODUCT PORTFOLIO
- TABLE 132. ROCKWELL MEDICAL TECHNOLOGIES INC.: KEY STRATERGIES
- TABLE 133. TORAY INDUSTRIES, INC.: KEY EXECUTIVES
- TABLE 134. TORAY INDUSTRIES, INC.: COMPANY SNAPSHOT
- TABLE 135. TORAY INDUSTRIES, INC.: PRODUCT SEGMENTS
- TABLE 136. TORAY INDUSTRIES, INC.: PRODUCT PORTFOLIO
- TABLE 137. TORAY INDUSTRIES, INC.: KEY STRATERGIES
LIST OF FIGURES
- FIGURE 01. HEMODIALYSIS MARKET, 2022-2032
- FIGURE 02. SEGMENTATION OF HEMODIALYSIS MARKET,2022-2032
- FIGURE 03. TOP IMPACTING FACTORS IN HEMODIALYSIS MARKET (2022 TO 2032)
- FIGURE 04. TOP INVESTMENT POCKETS IN HEMODIALYSIS MARKET (2023-2032)
- FIGURE 05. LOW BARGAINING POWER OF SUPPLIERS
- FIGURE 06. LOW THREAT OF NEW ENTRANTS
- FIGURE 07. LOW THREAT OF SUBSTITUTES
- FIGURE 08. LOW INTENSITY OF RIVALRY
- FIGURE 09. LOW BARGAINING POWER OF BUYERS
- FIGURE 10. GLOBAL HEMODIALYSIS MARKET:DRIVERS, RESTRAINTS AND OPPORTUNITIES
- FIGURE 11. HEMODIALYSIS MARKET, BY PRODUCT AND SERVICE, 2022 AND 2032(%)
- FIGURE 12. COMPARATIVE SHARE ANALYSIS OF HEMODIALYSIS MARKET FOR EQUIPMENTS, BY COUNTRY 2022 AND 2032(%)
- FIGURE 13. COMPARATIVE SHARE ANALYSIS OF HEMODIALYSIS MARKET FOR CONSUMABLES, BY COUNTRY 2022 AND 2032(%)
- FIGURE 14. COMPARATIVE SHARE ANALYSIS OF HEMODIALYSIS MARKET FOR DRUGS, BY COUNTRY 2022 AND 2032(%)
- FIGURE 15. COMPARATIVE SHARE ANALYSIS OF HEMODIALYSIS MARKET FOR SERVICES, BY COUNTRY 2022 AND 2032(%)
- FIGURE 16. HEMODIALYSIS MARKET, BY TYPE, 2022 AND 2032(%)
- FIGURE 17. COMPARATIVE SHARE ANALYSIS OF HEMODIALYSIS MARKET FOR CONVENTIONAL HEMODIALYSIS, BY COUNTRY 2022 AND 2032(%)
- FIGURE 18. COMPARATIVE SHARE ANALYSIS OF HEMODIALYSIS MARKET FOR DAILY HEMODIALYSIS, BY COUNTRY 2022 AND 2032(%)
- FIGURE 19. COMPARATIVE SHARE ANALYSIS OF HEMODIALYSIS MARKET FOR NOCTURNAL HEMODIALYSIS, BY COUNTRY 2022 AND 2032(%)
- FIGURE 20. HEMODIALYSIS MARKET, BY DIALYSIS SITE, 2022 AND 2032(%)
- FIGURE 21. COMPARATIVE SHARE ANALYSIS OF HEMODIALYSIS MARKET FOR IN-CENTER DIALYSIS, BY COUNTRY 2022 AND 2032(%)
- FIGURE 22. COMPARATIVE SHARE ANALYSIS OF HEMODIALYSIS MARKET FOR HOME DIALYSIS, BY COUNTRY 2022 AND 2032(%)
- FIGURE 23. HEMODIALYSIS MARKET BY REGION, 2022 AND 2032(%)
- FIGURE 24. U.S. HEMODIALYSIS MARKET, 2022-2032 ($MILLION)
- FIGURE 25. CANADA HEMODIALYSIS MARKET, 2022-2032 ($MILLION)
- FIGURE 26. MEXICO HEMODIALYSIS MARKET, 2022-2032 ($MILLION)
- FIGURE 27. GERMANY HEMODIALYSIS MARKET, 2022-2032 ($MILLION)
- FIGURE 28. FRANCE HEMODIALYSIS MARKET, 2022-2032 ($MILLION)
- FIGURE 29. UK HEMODIALYSIS MARKET, 2022-2032 ($MILLION)
- FIGURE 30. ITALY HEMODIALYSIS MARKET, 2022-2032 ($MILLION)
- FIGURE 31. SPAIN HEMODIALYSIS MARKET, 2022-2032 ($MILLION)
- FIGURE 32. REST OF EUROPE HEMODIALYSIS MARKET, 2022-2032 ($MILLION)
- FIGURE 33. JAPAN HEMODIALYSIS MARKET, 2022-2032 ($MILLION)
- FIGURE 34. CHINA HEMODIALYSIS MARKET, 2022-2032 ($MILLION)
- FIGURE 35. AUSTRALIA HEMODIALYSIS MARKET, 2022-2032 ($MILLION)
- FIGURE 36. INDIA HEMODIALYSIS MARKET, 2022-2032 ($MILLION)
- FIGURE 37. SOUTH KOREA HEMODIALYSIS MARKET, 2022-2032 ($MILLION)
- FIGURE 38. REST OF ASIA-PACIFIC HEMODIALYSIS MARKET, 2022-2032 ($MILLION)
- FIGURE 39. BRAZIL HEMODIALYSIS MARKET, 2022-2032 ($MILLION)
- FIGURE 40. SAUDI ARABIA HEMODIALYSIS MARKET, 2022-2032 ($MILLION)
- FIGURE 41. SOUTH AFRICA HEMODIALYSIS MARKET, 2022-2032 ($MILLION)
- FIGURE 42. REST OF LAMEA HEMODIALYSIS MARKET, 2022-2032 ($MILLION)
- FIGURE 43. TOP WINNING STRATEGIES, BY YEAR (2020-2023)
- FIGURE 44. TOP WINNING STRATEGIES, BY DEVELOPMENT (2020-2023)
- FIGURE 45. TOP WINNING STRATEGIES, BY COMPANY (2020-2023)
- FIGURE 46. PRODUCT MAPPING OF TOP 10 PLAYERS
- FIGURE 47. COMPETITIVE DASHBOARD
- FIGURE 48. COMPETITIVE HEATMAP: HEMODIALYSIS MARKET
- FIGURE 49. TOP PLAYER POSITIONING, 2022
- FIGURE 50. BAXTER INTERNATIONAL INC.: NET SALES, 2020-2022 ($MILLION)
- FIGURE 51. BAXTER INTERNATIONAL INC.: REVENUE SHARE BY SEGMENT, 2022 (%)
- FIGURE 52. BAXTER INTERNATIONAL INC.: REVENUE SHARE BY REGION, 2022 (%)
- FIGURE 53. B. BRAUN MELSUNGEN AG: NET SALES, 2020-2022 ($MILLION)
- FIGURE 54. B. BRAUN MELSUNGEN AG: REVENUE SHARE BY REGION, 2022 (%)
- FIGURE 55. B. BRAUN MELSUNGEN AG: REVENUE SHARE BY SEGMENT, 2022 (%)
- FIGURE 56. ASAHI KASEI CORPORATION.: NET REVENUE, 2020-2022 ($MILLION)
- FIGURE 57. ASAHI KASEI CORPORATION.: REVENUE SHARE BY REGION, 2022 (%)
- FIGURE 58. DAVITA INC.: SALES REVENUE, 2020-2022 ($BILLION)
- FIGURE 59. DAVITA INC.: REVENUE SHARE BY SEGMENT, 2022 (%)
- FIGURE 60. NIKKISO CO., LTD: NET REVENUE, 2020-2022 ($MILLION)
- FIGURE 61. NIKKISO CO., LTD: REVENUE SHARE BY SEGMENT, 2022 (%)
- FIGURE 62. NIKKISO CO., LTD: REVENUE SHARE BY REGION, 2022 (%)
- FIGURE 63. NIPRO CORPORATION: NET SALES, 2020-2022 ($MILLION)
- FIGURE 64. NIPRO CORPORATION: REVENUE SHARE BY SEGMENT, 2022 (%)
- FIGURE 65. NIPRO CORPORATION: REVENUE SHARE BY REGION, 2022 (%)
- FIGURE 66. FRESENIUS MEDICAL CARE AG & CO. KGAA: NET REVENUE, 2020-2022 ($MILLION)
- FIGURE 67. FRESENIUS MEDICAL CARE AG & CO. KGAA: REVENUE SHARE BY SEGMENT, 2022 (%)
- FIGURE 68. ROCKWELL MEDICAL TECHNOLOGIES INC.: NET SALES, 2020-2022 ($MILLION)
- FIGURE 69. ROCKWELL MEDICAL TECHNOLOGIES INC.: REVENUE SHARE BY REGION, 2022 (%)
- FIGURE 70. TORAY INDUSTRIES, INC.: NET SALES, 2020-2022 ($MILLION)
- FIGURE 71. TORAY INDUSTRIES, INC.: REVENUE SHARE BY SEGMENT, 2022 (%)
- FIGURE 72. TORAY INDUSTRIES, INC.: REVENUE SHARE BY REGION, 2022 (%)

