
PUBLISHER: Allied Market Research | PRODUCT CODE: 1414768

PUBLISHER: Allied Market Research | PRODUCT CODE: 1414768
Dram Market By Type (SDRAM, DDR SDRAM, DDR5 SDRAM, LPDDR, Others), By Application (Smartphones and Tablets, PC and Laptop, Data Center, Others): Global Opportunity Analysis and Industry Forecast, 2023-2032
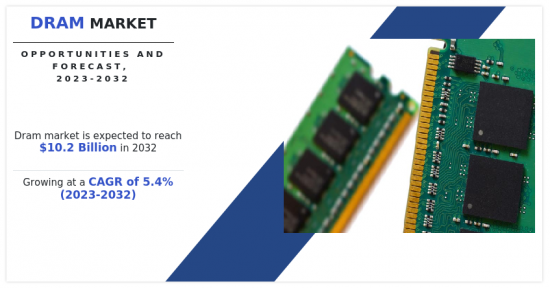
According to a new report published by Allied Market Research, titled, "Dram Market," The dram market was valued at $6.2 billion in 2022, and is estimated to reach $10.2 billion by 2032, growing at a CAGR of 5.4% from 2023 to 2032.
Random-access memory that stores data in bit form on a separate capacitor is called DRAM. When data is stored in static RAM (SRAM), input to the memory chip keeps the data unchanged as it is stored in a static manner. As a result, compared to an SRAM chip of the same size, a DRAM retains or stores more data. Because DRAM uses fewer chips than statically stored data to store the same amount of information, it stores data more effectively. There are several types of DRAMS, including synchronous DRAM (SDRAM), burst extended data output (BEDO), external data output (EDO), fast page mode (FPM), and asynchronous DRAM.
When compared to SRAM, DRAM is more efficient in storing data because it requires fewer transistors a type of component to store each bit. DRAM can efficiently store more information with fewer chips thanks to this design's increased storage density. Various types of DRAMs have been created to fulfil distinct demands for performance. While Burst Extended Data Output (BEDO), External Data Output (EDO), Fast Page Mode (FPM), and Asynchronous DRAM address various needs and application circumstances, Synchronous DRAM (SDRAM) synchronizes data transfers with the system clock for improved performance. The needs of the system and financial concerns determine which type of DRAM is used.
The DRAM market is segmented into type, application, and region. By type, the market is classified into SDRAM, DDR SDRAM, DDR5 SDRAM, LPDDR, and others. In 2022, the SDRAM segment dominated the market, and it is expected to acquire a major market share by 2032. By application, it is bifurcated into smartphones and tablets, PC and laptop, data centers, and others. Region wise, the market is analyzed across North America, Europe, Asia-Pacific, and LAMEA along with their prominent countries.
Region wise, the DRAM market trends are analyzed across North America (the U.S., Canada, and Mexico), Europe (the UK, Germany, France, and rest of Europe), Asia-Pacific (China, Japan, India, South Korea, and rest of Asia-Pacific), and LAMEA (Latin America, the Middle East, and Africa).
On the basis of region, the DRAM market trends are analyzed across North America (the U.S., Canada, and Mexico), Europe (the UK, Germany, France, and rest of Europe), Asia-Pacific (China, Japan, India, South Korea, and rest of Asia-Pacific), and LAMEA (Latin America, Middle East, and Africa).
Competitive analysis and profiles of the major global DRAM market players that have been provided in the report include Samsung Electronics, Micron Technology Inc., SK HYNIX INC., Nanya Technology Corporation, Winbond Electronics Corporation, Powerchip Technology Corporation, Transcend Information, Kingston Technology, Integrated Silicon Solutions, and Intel Corporation. The key strategies adopted by the major players of the DRAM market are product launch.
Key Benefits For Stakeholders
- This report provides a quantitative analysis of the market segments, current trends, estimations, and dynamics of the dram market analysis from 2022 to 2032 to identify the prevailing dram market opportunities.
- The market research is offered along with information related to key drivers, restraints, and opportunities.
- Porter's five forces analysis highlights the potency of buyers and suppliers to enable stakeholders make profit-oriented business decisions and strengthen their supplier-buyer network.
- In-depth analysis of the dram market segmentation assists to determine the prevailing market opportunities.
- Major countries in each region are mapped according to their revenue contribution to the global market.
- Market player positioning facilitates benchmarking and provides a clear understanding of the present position of the market players.
- The report includes the analysis of the regional as well as global dram market trends, key players, market segments, application areas, and market growth strategies.
Additional benefits you will get with this purchase are:
- Quarterly Update and* (only available with a corporate license, on listed price)
- 5 additional Company Profile of client Choice pre- or Post-purchase, as a free update.
- Free Upcoming Version on the Purchase of Five and Enterprise User License.
- 16 analyst hours of support* (post-purchase, if you find additional data requirements upon review of the report, you may receive support amounting to 16 analyst hours to solve questions, and post-sale queries)
- 15% Free Customization* (in case the scope or segment of the report does not match your requirements, 15% is equivalent to 3 working days of free work, applicable once)
- Free data Pack on the Five and Enterprise User License. (Excel version of the report)
- Free Updated report if the report is 6-12 months old or older.
- 24-hour priority response*
- Free Industry updates and white papers.
Possible Customization with this report (with additional cost and timeline, please talk to the sales executive to know more)
- Manufacturing Capacity
- Product Benchmarking / Product specification and applications
- Market share analysis of players by products/segments
- Regulatory Guidelines
- Import Export Analysis/Data
Key Market Segments
By Type
- SDRAM
- DDR SDRAM
- DDR5 SDRAM
- LPDDR
- Others
By Application
- Smartphones and Tablets
- PC and Laptop
- Data Center
- Others
By Region
- North America
- U.S.
- Canada
- Mexico
- Europe
- UK
- Germany
- France
- Rest of Europe
- Asia-Pacific
- China
- Japan
- India
- South Korea
- Rest of Asia-Pacific
- LAMEA
- Latin America
- Middle East
- Africa
Key Market Players:
- Winbond
- Transcend Information
- Kingston Technology
- Samsung Electronics
- Micron Technology Inc.
- Nanya Technology Corporation
- SK HYNIX INC.
- Intel Corporation
- Integrated Silicon Solution Inc.
- Powerchip Semiconductor Manufacturing Corporation
TABLE OF CONTENTS
CHAPTER 1: INTRODUCTION
- 1.1. Report description
- 1.2. Key market segments
- 1.3. Key benefits to the stakeholders
- 1.4. Research methodology
- 1.4.1. Primary research
- 1.4.2. Secondary research
- 1.4.3. Analyst tools and models
CHAPTER 2: EXECUTIVE SUMMARY
- 2.1. CXO Perspective
CHAPTER 3: MARKET OVERVIEW
- 3.1. Market definition and scope
- 3.2. Key findings
- 3.2.1. Top impacting factors
- 3.2.2. Top investment pockets
- 3.3. Porter's five forces analysis
- 3.3.1. High bargaining power of suppliers
- 3.3.2. Moderate to high threat of new entrants
- 3.3.3. Low to moderate threat of substitutes
- 3.3.4. Low intensity of rivalry
- 3.3.5. High bargaining power of buyers
- 3.4. Market dynamics
- 3.4.1. Drivers
- 3.4.1.1. Surge in demand for smartphones
- 3.4.1.2. Increasing number of data center installation
- 3.4.2. Restraints
- 3.4.2.1. Manufacturing process of DRAM is complex which may hamper the market growth
- 3.4.3. Opportunities
- 3.4.3.1. Rise in bitcoin mining and demanding gaming consoles are driving up the market demand.
- 3.4.1. Drivers
CHAPTER 4: DRAM MARKET, BY TYPE
- 4.1. Overview
- 4.1.1. Market size and forecast
- 4.2. SDRAM
- 4.2.1. Key market trends, growth factors and opportunities
- 4.2.2. Market size and forecast, by region
- 4.2.3. Market share analysis by country
- 4.3. DDR SDRAM
- 4.3.1. Key market trends, growth factors and opportunities
- 4.3.2. Market size and forecast, by region
- 4.3.3. Market share analysis by country
- 4.4. DDR5 SDRAM
- 4.4.1. Key market trends, growth factors and opportunities
- 4.4.2. Market size and forecast, by region
- 4.4.3. Market share analysis by country
- 4.5. LPDDR
- 4.5.1. Key market trends, growth factors and opportunities
- 4.5.2. Market size and forecast, by region
- 4.5.3. Market share analysis by country
- 4.6. Others
- 4.6.1. Key market trends, growth factors and opportunities
- 4.6.2. Market size and forecast, by region
- 4.6.3. Market share analysis by country
CHAPTER 5: DRAM MARKET, BY APPLICATION
- 5.1. Overview
- 5.1.1. Market size and forecast
- 5.2. Smartphones and Tablets
- 5.2.1. Key market trends, growth factors and opportunities
- 5.2.2. Market size and forecast, by region
- 5.2.3. Market share analysis by country
- 5.3. PC and Laptop
- 5.3.1. Key market trends, growth factors and opportunities
- 5.3.2. Market size and forecast, by region
- 5.3.3. Market share analysis by country
- 5.4. Data Center
- 5.4.1. Key market trends, growth factors and opportunities
- 5.4.2. Market size and forecast, by region
- 5.4.3. Market share analysis by country
- 5.5. Others
- 5.5.1. Key market trends, growth factors and opportunities
- 5.5.2. Market size and forecast, by region
- 5.5.3. Market share analysis by country
CHAPTER 6: DRAM MARKET, BY REGION
- 6.1. Overview
- 6.1.1. Market size and forecast By Region
- 6.2. North America
- 6.2.1. Key market trends, growth factors and opportunities
- 6.2.2. Market size and forecast, by Type
- 6.2.3. Market size and forecast, by Application
- 6.2.4. Market size and forecast, by country
- 6.2.4.1. U.S.
- 6.2.4.1.1. Market size and forecast, by Type
- 6.2.4.1.2. Market size and forecast, by Application
- 6.2.4.2. Canada
- 6.2.4.2.1. Market size and forecast, by Type
- 6.2.4.2.2. Market size and forecast, by Application
- 6.2.4.3. Mexico
- 6.2.4.3.1. Market size and forecast, by Type
- 6.2.4.3.2. Market size and forecast, by Application
- 6.3. Europe
- 6.3.1. Key market trends, growth factors and opportunities
- 6.3.2. Market size and forecast, by Type
- 6.3.3. Market size and forecast, by Application
- 6.3.4. Market size and forecast, by country
- 6.3.4.1. UK
- 6.3.4.1.1. Market size and forecast, by Type
- 6.3.4.1.2. Market size and forecast, by Application
- 6.3.4.2. Germany
- 6.3.4.2.1. Market size and forecast, by Type
- 6.3.4.2.2. Market size and forecast, by Application
- 6.3.4.3. France
- 6.3.4.3.1. Market size and forecast, by Type
- 6.3.4.3.2. Market size and forecast, by Application
- 6.3.4.4. Rest of Europe
- 6.3.4.4.1. Market size and forecast, by Type
- 6.3.4.4.2. Market size and forecast, by Application
- 6.4. Asia-Pacific
- 6.4.1. Key market trends, growth factors and opportunities
- 6.4.2. Market size and forecast, by Type
- 6.4.3. Market size and forecast, by Application
- 6.4.4. Market size and forecast, by country
- 6.4.4.1. China
- 6.4.4.1.1. Market size and forecast, by Type
- 6.4.4.1.2. Market size and forecast, by Application
- 6.4.4.2. Japan
- 6.4.4.2.1. Market size and forecast, by Type
- 6.4.4.2.2. Market size and forecast, by Application
- 6.4.4.3. India
- 6.4.4.3.1. Market size and forecast, by Type
- 6.4.4.3.2. Market size and forecast, by Application
- 6.4.4.4. South Korea
- 6.4.4.4.1. Market size and forecast, by Type
- 6.4.4.4.2. Market size and forecast, by Application
- 6.4.4.5. Rest of Asia-Pacific
- 6.4.4.5.1. Market size and forecast, by Type
- 6.4.4.5.2. Market size and forecast, by Application
- 6.5. LAMEA
- 6.5.1. Key market trends, growth factors and opportunities
- 6.5.2. Market size and forecast, by Type
- 6.5.3. Market size and forecast, by Application
- 6.5.4. Market size and forecast, by country
- 6.5.4.1. Latin America
- 6.5.4.1.1. Market size and forecast, by Type
- 6.5.4.1.2. Market size and forecast, by Application
- 6.5.4.2. Middle East
- 6.5.4.2.1. Market size and forecast, by Type
- 6.5.4.2.2. Market size and forecast, by Application
- 6.5.4.3. Africa
- 6.5.4.3.1. Market size and forecast, by Type
- 6.5.4.3.2. Market size and forecast, by Application
CHAPTER 7: COMPETITIVE LANDSCAPE
- 7.1. Introduction
- 7.2. Top winning strategies
- 7.3. Product mapping of top 10 player
- 7.4. Competitive dashboard
- 7.5. Competitive heatmap
- 7.6. Top player positioning, 2022
CHAPTER 8: COMPANY PROFILES
- 8.1. Samsung Electronics
- 8.1.1. Company overview
- 8.1.2. Key executives
- 8.1.3. Company snapshot
- 8.1.4. Operating business segments
- 8.1.5. Product portfolio
- 8.1.6. Business performance
- 8.1.7. Key strategic moves and developments
- 8.2. Micron Technology Inc.
- 8.2.1. Company overview
- 8.2.2. Key executives
- 8.2.3. Company snapshot
- 8.2.4. Operating business segments
- 8.2.5. Product portfolio
- 8.2.6. Business performance
- 8.3. SK HYNIX INC.
- 8.3.1. Company overview
- 8.3.2. Key executives
- 8.3.3. Company snapshot
- 8.3.4. Operating business segments
- 8.3.5. Product portfolio
- 8.3.6. Business performance
- 8.3.7. Key strategic moves and developments
- 8.4. Nanya Technology Corporation
- 8.4.1. Company overview
- 8.4.2. Key executives
- 8.4.3. Company snapshot
- 8.4.4. Operating business segments
- 8.4.5. Product portfolio
- 8.4.6. Business performance
- 8.5. Winbond
- 8.5.1. Company overview
- 8.5.2. Key executives
- 8.5.3. Company snapshot
- 8.5.4. Operating business segments
- 8.5.5. Product portfolio
- 8.5.6. Business performance
- 8.6. Powerchip Semiconductor Manufacturing Corporation
- 8.6.1. Company overview
- 8.6.2. Key executives
- 8.6.3. Company snapshot
- 8.6.4. Operating business segments
- 8.6.5. Product portfolio
- 8.6.6. Business performance
- 8.6.7. Key strategic moves and developments
- 8.7. Transcend Information
- 8.7.1. Company overview
- 8.7.2. Key executives
- 8.7.3. Company snapshot
- 8.7.4. Operating business segments
- 8.7.5. Product portfolio
- 8.7.6. Business performance
- 8.7.7. Key strategic moves and developments
- 8.8. Kingston Technology
- 8.8.1. Company overview
- 8.8.2. Key executives
- 8.8.3. Company snapshot
- 8.8.4. Operating business segments
- 8.8.5. Product portfolio
- 8.8.6. Business performance
- 8.9. Integrated Silicon Solution Inc.
- 8.9.1. Company overview
- 8.9.2. Key executives
- 8.9.3. Company snapshot
- 8.9.4. Operating business segments
- 8.9.5. Product portfolio
- 8.10. Intel Corporation
- 8.10.1. Company overview
- 8.10.2. Key executives
- 8.10.3. Company snapshot
- 8.10.4. Operating business segments
- 8.10.5. Product portfolio
- 8.10.6. Business performance
LIST OF TABLES
- TABLE 01. GLOBAL DRAM MARKET, BY TYPE, 2022-2032 ($MILLION)
- TABLE 02. DRAM MARKET FOR SDRAM, BY REGION, 2022-2032 ($MILLION)
- TABLE 03. DRAM MARKET FOR DDR SDRAM, BY REGION, 2022-2032 ($MILLION)
- TABLE 04. DRAM MARKET FOR DDR5 SDRAM, BY REGION, 2022-2032 ($MILLION)
- TABLE 05. DRAM MARKET FOR LPDDR, BY REGION, 2022-2032 ($MILLION)
- TABLE 06. DRAM MARKET FOR OTHERS, BY REGION, 2022-2032 ($MILLION)
- TABLE 07. GLOBAL DRAM MARKET, BY APPLICATION, 2022-2032 ($MILLION)
- TABLE 08. DRAM MARKET FOR SMARTPHONES AND TABLETS, BY REGION, 2022-2032 ($MILLION)
- TABLE 09. DRAM MARKET FOR PC AND LAPTOP, BY REGION, 2022-2032 ($MILLION)
- TABLE 10. DRAM MARKET FOR DATA CENTER, BY REGION, 2022-2032 ($MILLION)
- TABLE 11. DRAM MARKET FOR OTHERS, BY REGION, 2022-2032 ($MILLION)
- TABLE 12. DRAM MARKET, BY REGION, 2022-2032 ($MILLION)
- TABLE 13. NORTH AMERICA DRAM MARKET, BY TYPE, 2022-2032 ($MILLION)
- TABLE 14. NORTH AMERICA DRAM MARKET, BY APPLICATION, 2022-2032 ($MILLION)
- TABLE 15. NORTH AMERICA DRAM MARKET, BY COUNTRY, 2022-2032 ($MILLION)
- TABLE 16. U.S. DRAM MARKET, BY TYPE, 2022-2032 ($MILLION)
- TABLE 17. U.S. DRAM MARKET, BY APPLICATION, 2022-2032 ($MILLION)
- TABLE 18. CANADA DRAM MARKET, BY TYPE, 2022-2032 ($MILLION)
- TABLE 19. CANADA DRAM MARKET, BY APPLICATION, 2022-2032 ($MILLION)
- TABLE 20. MEXICO DRAM MARKET, BY TYPE, 2022-2032 ($MILLION)
- TABLE 21. MEXICO DRAM MARKET, BY APPLICATION, 2022-2032 ($MILLION)
- TABLE 22. EUROPE DRAM MARKET, BY TYPE, 2022-2032 ($MILLION)
- TABLE 23. EUROPE DRAM MARKET, BY APPLICATION, 2022-2032 ($MILLION)
- TABLE 24. EUROPE DRAM MARKET, BY COUNTRY, 2022-2032 ($MILLION)
- TABLE 25. UK DRAM MARKET, BY TYPE, 2022-2032 ($MILLION)
- TABLE 26. UK DRAM MARKET, BY APPLICATION, 2022-2032 ($MILLION)
- TABLE 27. GERMANY DRAM MARKET, BY TYPE, 2022-2032 ($MILLION)
- TABLE 28. GERMANY DRAM MARKET, BY APPLICATION, 2022-2032 ($MILLION)
- TABLE 29. FRANCE DRAM MARKET, BY TYPE, 2022-2032 ($MILLION)
- TABLE 30. FRANCE DRAM MARKET, BY APPLICATION, 2022-2032 ($MILLION)
- TABLE 31. REST OF EUROPE DRAM MARKET, BY TYPE, 2022-2032 ($MILLION)
- TABLE 32. REST OF EUROPE DRAM MARKET, BY APPLICATION, 2022-2032 ($MILLION)
- TABLE 33. ASIA-PACIFIC DRAM MARKET, BY TYPE, 2022-2032 ($MILLION)
- TABLE 34. ASIA-PACIFIC DRAM MARKET, BY APPLICATION, 2022-2032 ($MILLION)
- TABLE 35. ASIA-PACIFIC DRAM MARKET, BY COUNTRY, 2022-2032 ($MILLION)
- TABLE 36. CHINA DRAM MARKET, BY TYPE, 2022-2032 ($MILLION)
- TABLE 37. CHINA DRAM MARKET, BY APPLICATION, 2022-2032 ($MILLION)
- TABLE 38. JAPAN DRAM MARKET, BY TYPE, 2022-2032 ($MILLION)
- TABLE 39. JAPAN DRAM MARKET, BY APPLICATION, 2022-2032 ($MILLION)
- TABLE 40. INDIA DRAM MARKET, BY TYPE, 2022-2032 ($MILLION)
- TABLE 41. INDIA DRAM MARKET, BY APPLICATION, 2022-2032 ($MILLION)
- TABLE 42. SOUTH KOREA DRAM MARKET, BY TYPE, 2022-2032 ($MILLION)
- TABLE 43. SOUTH KOREA DRAM MARKET, BY APPLICATION, 2022-2032 ($MILLION)
- TABLE 44. REST OF ASIA-PACIFIC DRAM MARKET, BY TYPE, 2022-2032 ($MILLION)
- TABLE 45. REST OF ASIA-PACIFIC DRAM MARKET, BY APPLICATION, 2022-2032 ($MILLION)
- TABLE 46. LAMEA DRAM MARKET, BY TYPE, 2022-2032 ($MILLION)
- TABLE 47. LAMEA DRAM MARKET, BY APPLICATION, 2022-2032 ($MILLION)
- TABLE 48. LAMEA DRAM MARKET, BY COUNTRY, 2022-2032 ($MILLION)
- TABLE 49. LATIN AMERICA DRAM MARKET, BY TYPE, 2022-2032 ($MILLION)
- TABLE 50. LATIN AMERICA DRAM MARKET, BY APPLICATION, 2022-2032 ($MILLION)
- TABLE 51. MIDDLE EAST DRAM MARKET, BY TYPE, 2022-2032 ($MILLION)
- TABLE 52. MIDDLE EAST DRAM MARKET, BY APPLICATION, 2022-2032 ($MILLION)
- TABLE 53. AFRICA DRAM MARKET, BY TYPE, 2022-2032 ($MILLION)
- TABLE 54. AFRICA DRAM MARKET, BY APPLICATION, 2022-2032 ($MILLION)
- TABLE 55. SAMSUNG ELECTRONICS: KEY EXECUTIVES
- TABLE 56. SAMSUNG ELECTRONICS: COMPANY SNAPSHOT
- TABLE 57. SAMSUNG ELECTRONICS: PRODUCT SEGMENTS
- TABLE 58. SAMSUNG ELECTRONICS: PRODUCT PORTFOLIO
- TABLE 59. SAMSUNG ELECTRONICS: KEY STRATERGIES
- TABLE 60. MICRON TECHNOLOGY INC.: KEY EXECUTIVES
- TABLE 61. MICRON TECHNOLOGY INC.: COMPANY SNAPSHOT
- TABLE 62. MICRON TECHNOLOGY INC.: SERVICE SEGMENTS
- TABLE 63. MICRON TECHNOLOGY INC.: PRODUCT PORTFOLIO
- TABLE 64. SK HYNIX INC.: KEY EXECUTIVES
- TABLE 65. SK HYNIX INC.: COMPANY SNAPSHOT
- TABLE 66. SK HYNIX INC.: SERVICE SEGMENTS
- TABLE 67. SK HYNIX INC.: PRODUCT PORTFOLIO
- TABLE 68. SK HYNIX INC.: KEY STRATERGIES
- TABLE 69. NANYA TECHNOLOGY CORPORATION: KEY EXECUTIVES
- TABLE 70. NANYA TECHNOLOGY CORPORATION: COMPANY SNAPSHOT
- TABLE 71. NANYA TECHNOLOGY CORPORATION: PRODUCT SEGMENTS
- TABLE 72. NANYA TECHNOLOGY CORPORATION: PRODUCT PORTFOLIO
- TABLE 73. WINBOND: KEY EXECUTIVES
- TABLE 74. WINBOND: COMPANY SNAPSHOT
- TABLE 75. WINBOND: PRODUCT SEGMENTS
- TABLE 76. WINBOND: PRODUCT PORTFOLIO
- TABLE 77. POWERCHIP SEMICONDUCTOR MANUFACTURING CORPORATION: KEY EXECUTIVES
- TABLE 78. POWERCHIP SEMICONDUCTOR MANUFACTURING CORPORATION: COMPANY SNAPSHOT
- TABLE 79. POWERCHIP SEMICONDUCTOR MANUFACTURING CORPORATION: PRODUCT SEGMENTS
- TABLE 80. POWERCHIP SEMICONDUCTOR MANUFACTURING CORPORATION: PRODUCT PORTFOLIO
- TABLE 81. POWERCHIP SEMICONDUCTOR MANUFACTURING CORPORATION: KEY STRATERGIES
- TABLE 82. TRANSCEND INFORMATION: KEY EXECUTIVES
- TABLE 83. TRANSCEND INFORMATION: COMPANY SNAPSHOT
- TABLE 84. TRANSCEND INFORMATION: PRODUCT SEGMENTS
- TABLE 85. TRANSCEND INFORMATION: PRODUCT PORTFOLIO
- TABLE 86. TRANSCEND INFORMATION: KEY STRATERGIES
- TABLE 87. KINGSTON TECHNOLOGY: KEY EXECUTIVES
- TABLE 88. KINGSTON TECHNOLOGY: COMPANY SNAPSHOT
- TABLE 89. KINGSTON TECHNOLOGY: PRODUCT SEGMENTS
- TABLE 90. KINGSTON TECHNOLOGY: PRODUCT PORTFOLIO
- TABLE 91. INTEGRATED SILICON SOLUTION INC.: KEY EXECUTIVES
- TABLE 92. INTEGRATED SILICON SOLUTION INC.: COMPANY SNAPSHOT
- TABLE 93. INTEGRATED SILICON SOLUTION INC.: PRODUCT SEGMENTS
- TABLE 94. INTEGRATED SILICON SOLUTION INC.: PRODUCT PORTFOLIO
- TABLE 95. INTEL CORPORATION: KEY EXECUTIVES
- TABLE 96. INTEL CORPORATION: COMPANY SNAPSHOT
- TABLE 97. INTEL CORPORATION: PRODUCT SEGMENTS
- TABLE 98. INTEL CORPORATION: PRODUCT PORTFOLIO
LIST OF FIGURES
- FIGURE 01. DRAM MARKET, 2022-2032
- FIGURE 02. SEGMENTATION OF DRAM MARKET,2022-2032
- FIGURE 03. TOP IMPACTING FACTORS IN DRAM MARKET (2022 TO 2032)
- FIGURE 04. TOP INVESTMENT POCKETS IN DRAM MARKET (2023-2032)
- FIGURE 05. HIGH BARGAINING POWER OF SUPPLIERS
- FIGURE 06. MODERATE TO HIGH THREAT OF NEW ENTRANTS
- FIGURE 07. LOW TO MODERATE THREAT OF SUBSTITUTES
- FIGURE 08. LOW INTENSITY OF RIVALRY
- FIGURE 09. HIGH BARGAINING POWER OF BUYERS
- FIGURE 10. GLOBAL DRAM MARKET:DRIVERS, RESTRAINTS AND OPPORTUNITIES
- FIGURE 11. DRAM MARKET, BY TYPE, 2022 AND 2032(%)
- FIGURE 12. COMPARATIVE SHARE ANALYSIS OF DRAM MARKET FOR SDRAM, BY COUNTRY 2022 AND 2032(%)
- FIGURE 13. COMPARATIVE SHARE ANALYSIS OF DRAM MARKET FOR DDR SDRAM, BY COUNTRY 2022 AND 2032(%)
- FIGURE 14. COMPARATIVE SHARE ANALYSIS OF DRAM MARKET FOR DDR5 SDRAM, BY COUNTRY 2022 AND 2032(%)
- FIGURE 15. COMPARATIVE SHARE ANALYSIS OF DRAM MARKET FOR LPDDR, BY COUNTRY 2022 AND 2032(%)
- FIGURE 16. COMPARATIVE SHARE ANALYSIS OF DRAM MARKET FOR OTHERS, BY COUNTRY 2022 AND 2032(%)
- FIGURE 17. DRAM MARKET, BY APPLICATION, 2022 AND 2032(%)
- FIGURE 18. COMPARATIVE SHARE ANALYSIS OF DRAM MARKET FOR SMARTPHONES AND TABLETS, BY COUNTRY 2022 AND 2032(%)
- FIGURE 19. COMPARATIVE SHARE ANALYSIS OF DRAM MARKET FOR PC AND LAPTOP, BY COUNTRY 2022 AND 2032(%)
- FIGURE 20. COMPARATIVE SHARE ANALYSIS OF DRAM MARKET FOR DATA CENTER, BY COUNTRY 2022 AND 2032(%)
- FIGURE 21. COMPARATIVE SHARE ANALYSIS OF DRAM MARKET FOR OTHERS, BY COUNTRY 2022 AND 2032(%)
- FIGURE 22. DRAM MARKET BY REGION, 2022 AND 2032(%)
- FIGURE 23. U.S. DRAM MARKET, 2022-2032 ($MILLION)
- FIGURE 24. CANADA DRAM MARKET, 2022-2032 ($MILLION)
- FIGURE 25. MEXICO DRAM MARKET, 2022-2032 ($MILLION)
- FIGURE 26. UK DRAM MARKET, 2022-2032 ($MILLION)
- FIGURE 27. GERMANY DRAM MARKET, 2022-2032 ($MILLION)
- FIGURE 28. FRANCE DRAM MARKET, 2022-2032 ($MILLION)
- FIGURE 29. REST OF EUROPE DRAM MARKET, 2022-2032 ($MILLION)
- FIGURE 30. CHINA DRAM MARKET, 2022-2032 ($MILLION)
- FIGURE 31. JAPAN DRAM MARKET, 2022-2032 ($MILLION)
- FIGURE 32. INDIA DRAM MARKET, 2022-2032 ($MILLION)
- FIGURE 33. SOUTH KOREA DRAM MARKET, 2022-2032 ($MILLION)
- FIGURE 34. REST OF ASIA-PACIFIC DRAM MARKET, 2022-2032 ($MILLION)
- FIGURE 35. LATIN AMERICA DRAM MARKET, 2022-2032 ($MILLION)
- FIGURE 36. MIDDLE EAST DRAM MARKET, 2022-2032 ($MILLION)
- FIGURE 37. AFRICA DRAM MARKET, 2022-2032 ($MILLION)
- FIGURE 38. TOP WINNING STRATEGIES, BY YEAR (2022-2023)
- FIGURE 39. TOP WINNING STRATEGIES, BY DEVELOPMENT (2022-2023)
- FIGURE 40. TOP WINNING STRATEGIES, BY COMPANY (2022-2023)
- FIGURE 41. PRODUCT MAPPING OF TOP 10 PLAYERS
- FIGURE 42. COMPETITIVE DASHBOARD
- FIGURE 43. COMPETITIVE HEATMAP: DRAM MARKET
- FIGURE 44. TOP PLAYER POSITIONING, 2022
- FIGURE 45. SAMSUNG ELECTRONICS: NET SALES, 2020-2022 ($MILLION)
- FIGURE 46. SAMSUNG ELECTRONICS: REVENUE SHARE BY SEGMENT, 2022 (%)
- FIGURE 47. SAMSUNG ELECTRONICS: REVENUE SHARE BY REGION, 2022 (%)
- FIGURE 48. MICRON TECHNOLOGY INC.: NET REVENUE, 2018-2020 ($MILLION)
- FIGURE 49. MICRON TECHNOLOGY INC.: RESEARCH & DEVELOPMENT EXPENDITURE, 2018-2020 ($MILLION)
- FIGURE 50. MICRON TECHNOLOGY INC.: REVENUE SHARE BY SEGMENT, 2020 (%)
- FIGURE 51. SK HYNIX INC.: NET REVENUE, 2020-2022 ($MILLION)
- FIGURE 52. SK HYNIX INC.: REVENUE SHARE BY REGION, 2022 (%)
- FIGURE 53. NANYA TECHNOLOGY CORPORATION: NET REVENUE, 2020-2022 ($MILLION)
- FIGURE 54. NANYA TECHNOLOGY CORPORATION: REVENUE SHARE BY REGION, 2022 (%)
- FIGURE 55. NANYA TECHNOLOGY CORPORATION: REVENUE SHARE BY SEGMENT, 2022 (%)
- FIGURE 56. WINBOND: NET REVENUE, 2020-2022 ($MILLION)
- FIGURE 57. WINBOND: REVENUE SHARE BY SEGMENT, 2022 (%)
- FIGURE 58. WINBOND: REVENUE SHARE BY REGION, 2022 (%)
- FIGURE 59. POWERCHIP SEMICONDUCTOR MANUFACTURING CORPORATION: NET REVENUE, 2020-2022 ($MILLION)
- FIGURE 60. POWERCHIP SEMICONDUCTOR MANUFACTURING CORPORATION: REVENUE SHARE BY SEGMENT, 2022 (%)
- FIGURE 61. POWERCHIP SEMICONDUCTOR MANUFACTURING CORPORATION: REVENUE SHARE BY REGION, 2022 (%)
- FIGURE 62. TRANSCEND INFORMATION: NET REVENUE, 2019-2021 ($MILLION)
- FIGURE 63. TRANSCEND INFORMATION: RESEARCH & DEVELOPMENT EXPENDITURE, 2019-2021
- FIGURE 64. TRANSCEND INFORMATION: REVENUE SHARE BY REGION, 2021 (%)
- FIGURE 65. KINGSTON TECHNOLOGY: NET REVENUE, 2020-2022 ($MILLION)
- FIGURE 66. KINGSTON TECHNOLOGY: RESEARCH & DEVELOPMENT EXPENDITURE, 2020-2022 ($MILLION)
- FIGURE 67. INTEL CORPORATION: NET REVENUE, 2020-2022 ($MILLION)
- FIGURE 68. INTEL CORPORATION: RESEARCH & DEVELOPMENT EXPENDITURE, 2020-2022 ($MILLION)
- FIGURE 69. INTEL CORPORATION: REVENUE SHARE BY REGION, 2022 (%)
- FIGURE 70. INTEL CORPORATION: REVENUE SHARE BY SEGMENT, 2022 (%)

