
PUBLISHER: Allied Market Research | PRODUCT CODE: 1414870

PUBLISHER: Allied Market Research | PRODUCT CODE: 1414870
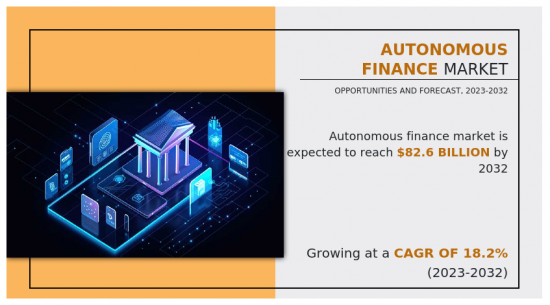
Autonomous Finance Market By Solution, By End User : Global Opportunity Analysis and Industry Forecast, 2023-2032
According to a new report published by Allied Market Research, titled, "Autonomous Finance Market," The autonomous finance market was valued at $15.8 billion in 2022, and is estimated to reach $82.6 billion by 2032, growing at a CAGR of 18.2% from 2023 to 2032.
One of the key drivers of the autonomous finance market is the advancements in artificial intelligence (AI). Furthermore, consumer demand for convenient and personalized financial services is a key driver behind the rapid growth of the autonomous finance market. In addition, cost efficiency and risk management of autonomous finance systems are significant drivers of the growth of the autonomous finance market. Financial institutions and businesses are increasingly turning to autonomous finance solutions to streamline their operations and reduce operational costs. Automation can handle repetitive and time-consuming tasks, such as data analysis and processing, with precision and speed, leading to substantial cost savings. However, data privacy and security concerns have emerged as significant barriers for the growth of the autonomous finance market. The autonomous finance market relies heavily on collecting and analyzing vast amounts of personal and financial data to provide tailored financial recommendations and services. The abundance of sensitive information makes it a prime target for cyberattacks and data breaches, thus hampering the market growth. However, the increase in the adoption of FinTech is expected to offer lucrative growth opportunities to the autonomous finance market in the upcoming years. FinTech innovations have transformed the way consumers manage and interact with their finances, from mobile banking apps to digital payment platforms. These technologies create a seamless and interconnected financial ecosystem, and autonomous finance can seamlessly integrate with these systems.
The autonomous finance market is segmented into solution, end user, and region. On the basis of solution, the market is differentiated into asset management, auto payments, digital identity management system, liquidity management, loan application processing, and others. By end user, the market is divided into banks, financial institutions, insurance companies, and others. Region-wise, the market is segmented into North America, Europe, Asia-Pacific, and LAMEA.
The key players operating in the autonomous finance market include Signzy Technologies Private Limited, Roots Automation, ReGov Technologies Sdn Bhd, Fennech Financial, HighRadius, Oracle, Auditoria.AI, Vic.ai, Emagia, and NICE Actimize. These players have adopted various strategies to increase their market penetration and strengthen their position in the autonomous finance industry.
Key Benefits for Stakeholders
- The study provides in-depth analysis of the autonomous finance market along with current trends and future estimations to illustrate the imminent investment pockets.
- Information about key drivers, restrains, & opportunities and their impact analysis on the autonomous finance market size are provided in the report.
- The Porter's five forces analysis illustrates the potency of buyers and suppliers operating in the industry.
- The quantitative analysis of the autonomous finance market from 2022 to 2032 is provided to determine the market potential.
Additional benefits you will get with this purchase are:
- Quarterly Update and* (only available with a corporate license, on listed price)
- 5 additional Company Profile of client Choice pre- or Post-purchase, as a free update.
- Free Upcoming Version on the Purchase of Five and Enterprise User License.
- 16 analyst hours of support* (post-purchase, if you find additional data requirements upon review of the report, you may receive support amounting to 16 analyst hours to solve questions, and post-sale queries)
- 15% Free Customization* (in case the scope or segment of the report does not match your requirements, 15% is equivalent to 3 working days of free work, applicable once)
- Free data Pack on the Five and Enterprise User License. (Excel version of the report)
- Free Updated report if the report is 6-12 months old or older.
- 24-hour priority response*
- Free Industry updates and white papers.
Possible Customization with this report (with additional cost and timeline, please talk to the sales executive to know more)
- Investment Opportunities
- Market share analysis of players by products/segments
- Regulatory Guidelines
- Additional company profiles with specific to client's interest
- Additional country or region analysis- market size and forecast
- Expanded list for Company Profiles
- Market share analysis of players at global/region/country level
Key Market Segments
By Solution
- Asset Management
- Auto Payments
- Digital Identity Management System
- Liquidity Management
- Loan Application Processing
- Others
By End User
- Banks
- Financial Institutions
- Insurance Companies
- Others
By Region
- North America
- U.S.
- Canada
- Europe
- UK
- Germany
- France
- Italy
- Spain
- Rest of Europe
- Asia-Pacific
- China
- Japan
- India
- Australia
- South Korea
- Rest of Asia-Pacific
- LAMEA
- Latin America
- Middle East
- Africa
Key Market Players:
- Roots Automation
- ReGov Technologies Sdn Bhd
- HighRadius
- Auditoria.AI
- NICE Actimize
- Signzy Technologies Private Limited
- Emagia
- Oracle Corporation
- Fennech Financial
- Vic.ai
TABLE OF CONTENTS
CHAPTER 1: INTRODUCTION
- 1.1. Report description
- 1.2. Key market segments
- 1.3. Key benefits to the stakeholders
- 1.4. Research methodology
- 1.4.1. Primary research
- 1.4.2. Secondary research
- 1.4.3. Analyst tools and models
CHAPTER 2: EXECUTIVE SUMMARY
- 2.1. CXO Perspective
CHAPTER 3: MARKET OVERVIEW
- 3.1. Market definition and scope
- 3.2. Key findings
- 3.2.1. Top impacting factors
- 3.2.2. Top investment pockets
- 3.3. Porter's five forces analysis
- 3.3.1. Low bargaining power of suppliers
- 3.3.2. Low threat of new entrants
- 3.3.3. Low threat of substitutes
- 3.3.4. Low intensity of rivalry
- 3.3.5. Low bargaining power of buyers
- 3.4. Market dynamics
- 3.4.1. Drivers
- 3.4.1.1. Advancements in artificial intelligence
- 3.4.1.2. Consumer demand for convenient and personalized financial services
- 3.4.1.3. Cost efficiency and risk management
- 3.4.2. Restraints
- 3.4.2.1. Data privacy and security concerns
- 3.4.3. Opportunities
- 3.4.3.1. Increase in adoption of FinTech
- 3.4.1. Drivers
CHAPTER 4: AUTONOMOUS FINANCE MARKET, BY SOLUTION
- 4.1. Overview
- 4.1.1. Market size and forecast
- 4.2. Asset Management
- 4.2.1. Key market trends, growth factors and opportunities
- 4.2.2. Market size and forecast, by region
- 4.2.3. Market share analysis by country
- 4.3. Auto Payments
- 4.3.1. Key market trends, growth factors and opportunities
- 4.3.2. Market size and forecast, by region
- 4.3.3. Market share analysis by country
- 4.4. Digital Identity Management System
- 4.4.1. Key market trends, growth factors and opportunities
- 4.4.2. Market size and forecast, by region
- 4.4.3. Market share analysis by country
- 4.5. Liquidity Management
- 4.5.1. Key market trends, growth factors and opportunities
- 4.5.2. Market size and forecast, by region
- 4.5.3. Market share analysis by country
- 4.6. Loan Application Processing
- 4.6.1. Key market trends, growth factors and opportunities
- 4.6.2. Market size and forecast, by region
- 4.6.3. Market share analysis by country
- 4.7. Others
- 4.7.1. Key market trends, growth factors and opportunities
- 4.7.2. Market size and forecast, by region
- 4.7.3. Market share analysis by country
CHAPTER 5: AUTONOMOUS FINANCE MARKET, BY END USER
- 5.1. Overview
- 5.1.1. Market size and forecast
- 5.2. Banks
- 5.2.1. Key market trends, growth factors and opportunities
- 5.2.2. Market size and forecast, by region
- 5.2.3. Market share analysis by country
- 5.3. Financial Institutions
- 5.3.1. Key market trends, growth factors and opportunities
- 5.3.2. Market size and forecast, by region
- 5.3.3. Market share analysis by country
- 5.4. Insurance Companies
- 5.4.1. Key market trends, growth factors and opportunities
- 5.4.2. Market size and forecast, by region
- 5.4.3. Market share analysis by country
- 5.5. Others
- 5.5.1. Key market trends, growth factors and opportunities
- 5.5.2. Market size and forecast, by region
- 5.5.3. Market share analysis by country
CHAPTER 6: AUTONOMOUS FINANCE MARKET, BY REGION
- 6.1. Overview
- 6.1.1. Market size and forecast By Region
- 6.2. North America
- 6.2.1. Key market trends, growth factors and opportunities
- 6.2.2. Market size and forecast, by Solution
- 6.2.3. Market size and forecast, by End User
- 6.2.4. Market size and forecast, by country
- 6.2.4.1. U.S.
- 6.2.4.1.1. Market size and forecast, by Solution
- 6.2.4.1.2. Market size and forecast, by End User
- 6.2.4.2. Canada
- 6.2.4.2.1. Market size and forecast, by Solution
- 6.2.4.2.2. Market size and forecast, by End User
- 6.3. Europe
- 6.3.1. Key market trends, growth factors and opportunities
- 6.3.2. Market size and forecast, by Solution
- 6.3.3. Market size and forecast, by End User
- 6.3.4. Market size and forecast, by country
- 6.3.4.1. UK
- 6.3.4.1.1. Market size and forecast, by Solution
- 6.3.4.1.2. Market size and forecast, by End User
- 6.3.4.2. Germany
- 6.3.4.2.1. Market size and forecast, by Solution
- 6.3.4.2.2. Market size and forecast, by End User
- 6.3.4.3. France
- 6.3.4.3.1. Market size and forecast, by Solution
- 6.3.4.3.2. Market size and forecast, by End User
- 6.3.4.4. Italy
- 6.3.4.4.1. Market size and forecast, by Solution
- 6.3.4.4.2. Market size and forecast, by End User
- 6.3.4.5. Spain
- 6.3.4.5.1. Market size and forecast, by Solution
- 6.3.4.5.2. Market size and forecast, by End User
- 6.3.4.6. Rest of Europe
- 6.3.4.6.1. Market size and forecast, by Solution
- 6.3.4.6.2. Market size and forecast, by End User
- 6.4. Asia-Pacific
- 6.4.1. Key market trends, growth factors and opportunities
- 6.4.2. Market size and forecast, by Solution
- 6.4.3. Market size and forecast, by End User
- 6.4.4. Market size and forecast, by country
- 6.4.4.1. China
- 6.4.4.1.1. Market size and forecast, by Solution
- 6.4.4.1.2. Market size and forecast, by End User
- 6.4.4.2. Japan
- 6.4.4.2.1. Market size and forecast, by Solution
- 6.4.4.2.2. Market size and forecast, by End User
- 6.4.4.3. India
- 6.4.4.3.1. Market size and forecast, by Solution
- 6.4.4.3.2. Market size and forecast, by End User
- 6.4.4.4. Australia
- 6.4.4.4.1. Market size and forecast, by Solution
- 6.4.4.4.2. Market size and forecast, by End User
- 6.4.4.5. South Korea
- 6.4.4.5.1. Market size and forecast, by Solution
- 6.4.4.5.2. Market size and forecast, by End User
- 6.4.4.6. Rest of Asia-Pacific
- 6.4.4.6.1. Market size and forecast, by Solution
- 6.4.4.6.2. Market size and forecast, by End User
- 6.5. LAMEA
- 6.5.1. Key market trends, growth factors and opportunities
- 6.5.2. Market size and forecast, by Solution
- 6.5.3. Market size and forecast, by End User
- 6.5.4. Market size and forecast, by country
- 6.5.4.1. Latin America
- 6.5.4.1.1. Market size and forecast, by Solution
- 6.5.4.1.2. Market size and forecast, by End User
- 6.5.4.2. Middle East
- 6.5.4.2.1. Market size and forecast, by Solution
- 6.5.4.2.2. Market size and forecast, by End User
- 6.5.4.3. Africa
- 6.5.4.3.1. Market size and forecast, by Solution
- 6.5.4.3.2. Market size and forecast, by End User
CHAPTER 7: COMPETITIVE LANDSCAPE
- 7.1. Introduction
- 7.2. Top winning strategies
- 7.3. Product mapping of top 10 player
- 7.4. Competitive dashboard
- 7.5. Competitive heatmap
- 7.6. Top player positioning, 2022
CHAPTER 8: COMPANY PROFILES
- 8.1. Signzy Technologies Private Limited
- 8.1.1. Company overview
- 8.1.2. Key executives
- 8.1.3. Company snapshot
- 8.1.4. Operating business segments
- 8.1.5. Product portfolio
- 8.2. Roots Automation
- 8.2.1. Company overview
- 8.2.2. Key executives
- 8.2.3. Company snapshot
- 8.2.4. Operating business segments
- 8.2.5. Product portfolio
- 8.3. ReGov Technologies Sdn Bhd
- 8.3.1. Company overview
- 8.3.2. Key executives
- 8.3.3. Company snapshot
- 8.3.4. Operating business segments
- 8.3.5. Product portfolio
- 8.4. Fennech Financial
- 8.4.1. Company overview
- 8.4.2. Key executives
- 8.4.3. Company snapshot
- 8.4.4. Operating business segments
- 8.4.5. Product portfolio
- 8.4.6. Key strategic moves and developments
- 8.5. HighRadius
- 8.5.1. Company overview
- 8.5.2. Key executives
- 8.5.3. Company snapshot
- 8.5.4. Operating business segments
- 8.5.5. Product portfolio
- 8.5.6. Key strategic moves and developments
- 8.6. Oracle Corporation
- 8.6.1. Company overview
- 8.6.2. Key executives
- 8.6.3. Company snapshot
- 8.6.4. Operating business segments
- 8.6.5. Product portfolio
- 8.6.6. Business performance
- 8.6.7. Key strategic moves and developments
- 8.7. Auditoria.AI
- 8.7.1. Company overview
- 8.7.2. Key executives
- 8.7.3. Company snapshot
- 8.7.4. Operating business segments
- 8.7.5. Product portfolio
- 8.7.6. Key strategic moves and developments
- 8.8. Vic.ai
- 8.8.1. Company overview
- 8.8.2. Key executives
- 8.8.3. Company snapshot
- 8.8.4. Operating business segments
- 8.8.5. Product portfolio
- 8.8.6. Key strategic moves and developments
- 8.9. NICE Actimize
- 8.9.1. Company overview
- 8.9.2. Key executives
- 8.9.3. Company snapshot
- 8.9.4. Operating business segments
- 8.9.5. Product portfolio
- 8.9.6. Business performance
- 8.9.7. Key strategic moves and developments
- 8.10. Emagia
- 8.10.1. Company overview
- 8.10.2. Key executives
- 8.10.3. Company snapshot
- 8.10.4. Operating business segments
- 8.10.5. Product portfolio
- 8.10.6. Key strategic moves and developments
LIST OF TABLES
- TABLE 01. GLOBAL AUTONOMOUS FINANCE MARKET, BY SOLUTION, 2022-2032 ($MILLION)
- TABLE 02. AUTONOMOUS FINANCE MARKET FOR ASSET MANAGEMENT, BY REGION, 2022-2032 ($MILLION)
- TABLE 03. AUTONOMOUS FINANCE MARKET FOR AUTO PAYMENTS, BY REGION, 2022-2032 ($MILLION)
- TABLE 04. AUTONOMOUS FINANCE MARKET FOR DIGITAL IDENTITY MANAGEMENT SYSTEM, BY REGION, 2022-2032 ($MILLION)
- TABLE 05. AUTONOMOUS FINANCE MARKET FOR LIQUIDITY MANAGEMENT, BY REGION, 2022-2032 ($MILLION)
- TABLE 06. AUTONOMOUS FINANCE MARKET FOR LOAN APPLICATION PROCESSING, BY REGION, 2022-2032 ($MILLION)
- TABLE 07. AUTONOMOUS FINANCE MARKET FOR OTHERS, BY REGION, 2022-2032 ($MILLION)
- TABLE 08. GLOBAL AUTONOMOUS FINANCE MARKET, BY END USER, 2022-2032 ($MILLION)
- TABLE 09. AUTONOMOUS FINANCE MARKET FOR BANKS, BY REGION, 2022-2032 ($MILLION)
- TABLE 10. AUTONOMOUS FINANCE MARKET FOR FINANCIAL INSTITUTIONS, BY REGION, 2022-2032 ($MILLION)
- TABLE 11. AUTONOMOUS FINANCE MARKET FOR INSURANCE COMPANIES, BY REGION, 2022-2032 ($MILLION)
- TABLE 12. AUTONOMOUS FINANCE MARKET FOR OTHERS, BY REGION, 2022-2032 ($MILLION)
- TABLE 13. AUTONOMOUS FINANCE MARKET, BY REGION, 2022-2032 ($MILLION)
- TABLE 14. NORTH AMERICA AUTONOMOUS FINANCE MARKET, BY SOLUTION, 2022-2032 ($MILLION)
- TABLE 15. NORTH AMERICA AUTONOMOUS FINANCE MARKET, BY END USER, 2022-2032 ($MILLION)
- TABLE 16. NORTH AMERICA AUTONOMOUS FINANCE MARKET, BY COUNTRY, 2022-2032 ($MILLION)
- TABLE 17. U.S. AUTONOMOUS FINANCE MARKET, BY SOLUTION, 2022-2032 ($MILLION)
- TABLE 18. U.S. AUTONOMOUS FINANCE MARKET, BY END USER, 2022-2032 ($MILLION)
- TABLE 19. CANADA AUTONOMOUS FINANCE MARKET, BY SOLUTION, 2022-2032 ($MILLION)
- TABLE 20. CANADA AUTONOMOUS FINANCE MARKET, BY END USER, 2022-2032 ($MILLION)
- TABLE 21. EUROPE AUTONOMOUS FINANCE MARKET, BY SOLUTION, 2022-2032 ($MILLION)
- TABLE 22. EUROPE AUTONOMOUS FINANCE MARKET, BY END USER, 2022-2032 ($MILLION)
- TABLE 23. EUROPE AUTONOMOUS FINANCE MARKET, BY COUNTRY, 2022-2032 ($MILLION)
- TABLE 24. UK AUTONOMOUS FINANCE MARKET, BY SOLUTION, 2022-2032 ($MILLION)
- TABLE 25. UK AUTONOMOUS FINANCE MARKET, BY END USER, 2022-2032 ($MILLION)
- TABLE 26. GERMANY AUTONOMOUS FINANCE MARKET, BY SOLUTION, 2022-2032 ($MILLION)
- TABLE 27. GERMANY AUTONOMOUS FINANCE MARKET, BY END USER, 2022-2032 ($MILLION)
- TABLE 28. FRANCE AUTONOMOUS FINANCE MARKET, BY SOLUTION, 2022-2032 ($MILLION)
- TABLE 29. FRANCE AUTONOMOUS FINANCE MARKET, BY END USER, 2022-2032 ($MILLION)
- TABLE 30. ITALY AUTONOMOUS FINANCE MARKET, BY SOLUTION, 2022-2032 ($MILLION)
- TABLE 31. ITALY AUTONOMOUS FINANCE MARKET, BY END USER, 2022-2032 ($MILLION)
- TABLE 32. SPAIN AUTONOMOUS FINANCE MARKET, BY SOLUTION, 2022-2032 ($MILLION)
- TABLE 33. SPAIN AUTONOMOUS FINANCE MARKET, BY END USER, 2022-2032 ($MILLION)
- TABLE 34. REST OF EUROPE AUTONOMOUS FINANCE MARKET, BY SOLUTION, 2022-2032 ($MILLION)
- TABLE 35. REST OF EUROPE AUTONOMOUS FINANCE MARKET, BY END USER, 2022-2032 ($MILLION)
- TABLE 36. ASIA-PACIFIC AUTONOMOUS FINANCE MARKET, BY SOLUTION, 2022-2032 ($MILLION)
- TABLE 37. ASIA-PACIFIC AUTONOMOUS FINANCE MARKET, BY END USER, 2022-2032 ($MILLION)
- TABLE 38. ASIA-PACIFIC AUTONOMOUS FINANCE MARKET, BY COUNTRY, 2022-2032 ($MILLION)
- TABLE 39. CHINA AUTONOMOUS FINANCE MARKET, BY SOLUTION, 2022-2032 ($MILLION)
- TABLE 40. CHINA AUTONOMOUS FINANCE MARKET, BY END USER, 2022-2032 ($MILLION)
- TABLE 41. JAPAN AUTONOMOUS FINANCE MARKET, BY SOLUTION, 2022-2032 ($MILLION)
- TABLE 42. JAPAN AUTONOMOUS FINANCE MARKET, BY END USER, 2022-2032 ($MILLION)
- TABLE 43. INDIA AUTONOMOUS FINANCE MARKET, BY SOLUTION, 2022-2032 ($MILLION)
- TABLE 44. INDIA AUTONOMOUS FINANCE MARKET, BY END USER, 2022-2032 ($MILLION)
- TABLE 45. AUSTRALIA AUTONOMOUS FINANCE MARKET, BY SOLUTION, 2022-2032 ($MILLION)
- TABLE 46. AUSTRALIA AUTONOMOUS FINANCE MARKET, BY END USER, 2022-2032 ($MILLION)
- TABLE 47. SOUTH KOREA AUTONOMOUS FINANCE MARKET, BY SOLUTION, 2022-2032 ($MILLION)
- TABLE 48. SOUTH KOREA AUTONOMOUS FINANCE MARKET, BY END USER, 2022-2032 ($MILLION)
- TABLE 49. REST OF ASIA-PACIFIC AUTONOMOUS FINANCE MARKET, BY SOLUTION, 2022-2032 ($MILLION)
- TABLE 50. REST OF ASIA-PACIFIC AUTONOMOUS FINANCE MARKET, BY END USER, 2022-2032 ($MILLION)
- TABLE 51. LAMEA AUTONOMOUS FINANCE MARKET, BY SOLUTION, 2022-2032 ($MILLION)
- TABLE 52. LAMEA AUTONOMOUS FINANCE MARKET, BY END USER, 2022-2032 ($MILLION)
- TABLE 53. LAMEA AUTONOMOUS FINANCE MARKET, BY COUNTRY, 2022-2032 ($MILLION)
- TABLE 54. LATIN AMERICA AUTONOMOUS FINANCE MARKET, BY SOLUTION, 2022-2032 ($MILLION)
- TABLE 55. LATIN AMERICA AUTONOMOUS FINANCE MARKET, BY END USER, 2022-2032 ($MILLION)
- TABLE 56. MIDDLE EAST AUTONOMOUS FINANCE MARKET, BY SOLUTION, 2022-2032 ($MILLION)
- TABLE 57. MIDDLE EAST AUTONOMOUS FINANCE MARKET, BY END USER, 2022-2032 ($MILLION)
- TABLE 58. AFRICA AUTONOMOUS FINANCE MARKET, BY SOLUTION, 2022-2032 ($MILLION)
- TABLE 59. AFRICA AUTONOMOUS FINANCE MARKET, BY END USER, 2022-2032 ($MILLION)
- TABLE 60. SIGNZY TECHNOLOGIES PRIVATE LIMITED: KEY EXECUTIVES
- TABLE 61. SIGNZY TECHNOLOGIES PRIVATE LIMITED: COMPANY SNAPSHOT
- TABLE 62. SIGNZY TECHNOLOGIES PRIVATE LIMITED: SERVICE SEGMENTS
- TABLE 63. SIGNZY TECHNOLOGIES PRIVATE LIMITED: PRODUCT PORTFOLIO
- TABLE 64. ROOTS AUTOMATION: KEY EXECUTIVES
- TABLE 65. ROOTS AUTOMATION: COMPANY SNAPSHOT
- TABLE 66. ROOTS AUTOMATION: SERVICE SEGMENTS
- TABLE 67. ROOTS AUTOMATION: PRODUCT PORTFOLIO
- TABLE 68. REGOV TECHNOLOGIES SDN BHD: KEY EXECUTIVES
- TABLE 69. REGOV TECHNOLOGIES SDN BHD: COMPANY SNAPSHOT
- TABLE 70. REGOV TECHNOLOGIES SDN BHD: SERVICE SEGMENTS
- TABLE 71. REGOV TECHNOLOGIES SDN BHD: PRODUCT PORTFOLIO
- TABLE 72. FENNECH FINANCIAL: KEY EXECUTIVES
- TABLE 73. FENNECH FINANCIAL: COMPANY SNAPSHOT
- TABLE 74. FENNECH FINANCIAL: SERVICE SEGMENTS
- TABLE 75. FENNECH FINANCIAL: PRODUCT PORTFOLIO
- TABLE 76. FENNECH FINANCIAL: KEY STRATERGIES
- TABLE 77. HIGHRADIUS: KEY EXECUTIVES
- TABLE 78. HIGHRADIUS: COMPANY SNAPSHOT
- TABLE 79. HIGHRADIUS: SERVICE SEGMENTS
- TABLE 80. HIGHRADIUS: PRODUCT PORTFOLIO
- TABLE 81. HIGHRADIUS: KEY STRATERGIES
- TABLE 82. ORACLE CORPORATION: KEY EXECUTIVES
- TABLE 83. ORACLE CORPORATION: COMPANY SNAPSHOT
- TABLE 84. ORACLE CORPORATION: SERVICE SEGMENTS
- TABLE 85. ORACLE CORPORATION: PRODUCT PORTFOLIO
- TABLE 86. ORACLE CORPORATION: KEY STRATERGIES
- TABLE 87. AUDITORIA.AI: KEY EXECUTIVES
- TABLE 88. AUDITORIA.AI: COMPANY SNAPSHOT
- TABLE 89. AUDITORIA.AI: SERVICE SEGMENTS
- TABLE 90. AUDITORIA.AI: PRODUCT PORTFOLIO
- TABLE 91. AUDITORIA.AI: KEY STRATERGIES
- TABLE 92. VIC.AI: KEY EXECUTIVES
- TABLE 93. VIC.AI: COMPANY SNAPSHOT
- TABLE 94. VIC.AI: SERVICE SEGMENTS
- TABLE 95. VIC.AI: PRODUCT PORTFOLIO
- TABLE 96. VIC.AI: KEY STRATERGIES
- TABLE 97. NICE ACTIMIZE: KEY EXECUTIVES
- TABLE 98. NICE ACTIMIZE: COMPANY SNAPSHOT
- TABLE 99. NICE ACTIMIZE: SERVICE SEGMENTS
- TABLE 100. NICE ACTIMIZE: PRODUCT PORTFOLIO
- TABLE 101. NICE ACTIMIZE: KEY STRATERGIES
- TABLE 102. EMAGIA: KEY EXECUTIVES
- TABLE 103. EMAGIA: COMPANY SNAPSHOT
- TABLE 104. EMAGIA: SERVICE SEGMENTS
- TABLE 105. EMAGIA: PRODUCT PORTFOLIO
- TABLE 106. EMAGIA: KEY STRATERGIES
LIST OF FIGURES
- FIGURE 01. AUTONOMOUS FINANCE MARKET, 2022-2032
- FIGURE 02. SEGMENTATION OF AUTONOMOUS FINANCE MARKET,2022-2032
- FIGURE 03. TOP IMPACTING FACTORS IN AUTONOMOUS FINANCE MARKET (2022 TO 2032)
- FIGURE 04. TOP INVESTMENT POCKETS IN AUTONOMOUS FINANCE MARKET (2023-2032)
- FIGURE 05. LOW BARGAINING POWER OF SUPPLIERS
- FIGURE 06. LOW THREAT OF NEW ENTRANTS
- FIGURE 07. LOW THREAT OF SUBSTITUTES
- FIGURE 08. LOW INTENSITY OF RIVALRY
- FIGURE 09. LOW BARGAINING POWER OF BUYERS
- FIGURE 10. GLOBAL AUTONOMOUS FINANCE MARKET:DRIVERS, RESTRAINTS AND OPPORTUNITIES
- FIGURE 11. AUTONOMOUS FINANCE MARKET, BY SOLUTION, 2022 AND 2032(%)
- FIGURE 12. COMPARATIVE SHARE ANALYSIS OF AUTONOMOUS FINANCE MARKET FOR ASSET MANAGEMENT, BY COUNTRY 2022 AND 2032(%)
- FIGURE 13. COMPARATIVE SHARE ANALYSIS OF AUTONOMOUS FINANCE MARKET FOR AUTO PAYMENTS, BY COUNTRY 2022 AND 2032(%)
- FIGURE 14. COMPARATIVE SHARE ANALYSIS OF AUTONOMOUS FINANCE MARKET FOR DIGITAL IDENTITY MANAGEMENT SYSTEM, BY COUNTRY 2022 AND 2032(%)
- FIGURE 15. COMPARATIVE SHARE ANALYSIS OF AUTONOMOUS FINANCE MARKET FOR LIQUIDITY MANAGEMENT, BY COUNTRY 2022 AND 2032(%)
- FIGURE 16. COMPARATIVE SHARE ANALYSIS OF AUTONOMOUS FINANCE MARKET FOR LOAN APPLICATION PROCESSING, BY COUNTRY 2022 AND 2032(%)
- FIGURE 17. COMPARATIVE SHARE ANALYSIS OF AUTONOMOUS FINANCE MARKET FOR OTHERS, BY COUNTRY 2022 AND 2032(%)
- FIGURE 18. AUTONOMOUS FINANCE MARKET, BY END USER, 2022 AND 2032(%)
- FIGURE 19. COMPARATIVE SHARE ANALYSIS OF AUTONOMOUS FINANCE MARKET FOR BANKS, BY COUNTRY 2022 AND 2032(%)
- FIGURE 20. COMPARATIVE SHARE ANALYSIS OF AUTONOMOUS FINANCE MARKET FOR FINANCIAL INSTITUTIONS, BY COUNTRY 2022 AND 2032(%)
- FIGURE 21. COMPARATIVE SHARE ANALYSIS OF AUTONOMOUS FINANCE MARKET FOR INSURANCE COMPANIES, BY COUNTRY 2022 AND 2032(%)
- FIGURE 22. COMPARATIVE SHARE ANALYSIS OF AUTONOMOUS FINANCE MARKET FOR OTHERS, BY COUNTRY 2022 AND 2032(%)
- FIGURE 23. AUTONOMOUS FINANCE MARKET BY REGION, 2022 AND 2032(%)
- FIGURE 24. U.S. AUTONOMOUS FINANCE MARKET, 2022-2032 ($MILLION)
- FIGURE 25. CANADA AUTONOMOUS FINANCE MARKET, 2022-2032 ($MILLION)
- FIGURE 26. UK AUTONOMOUS FINANCE MARKET, 2022-2032 ($MILLION)
- FIGURE 27. GERMANY AUTONOMOUS FINANCE MARKET, 2022-2032 ($MILLION)
- FIGURE 28. FRANCE AUTONOMOUS FINANCE MARKET, 2022-2032 ($MILLION)
- FIGURE 29. ITALY AUTONOMOUS FINANCE MARKET, 2022-2032 ($MILLION)
- FIGURE 30. SPAIN AUTONOMOUS FINANCE MARKET, 2022-2032 ($MILLION)
- FIGURE 31. REST OF EUROPE AUTONOMOUS FINANCE MARKET, 2022-2032 ($MILLION)
- FIGURE 32. CHINA AUTONOMOUS FINANCE MARKET, 2022-2032 ($MILLION)
- FIGURE 33. JAPAN AUTONOMOUS FINANCE MARKET, 2022-2032 ($MILLION)
- FIGURE 34. INDIA AUTONOMOUS FINANCE MARKET, 2022-2032 ($MILLION)
- FIGURE 35. AUSTRALIA AUTONOMOUS FINANCE MARKET, 2022-2032 ($MILLION)
- FIGURE 36. SOUTH KOREA AUTONOMOUS FINANCE MARKET, 2022-2032 ($MILLION)
- FIGURE 37. REST OF ASIA-PACIFIC AUTONOMOUS FINANCE MARKET, 2022-2032 ($MILLION)
- FIGURE 38. LATIN AMERICA AUTONOMOUS FINANCE MARKET, 2022-2032 ($MILLION)
- FIGURE 39. MIDDLE EAST AUTONOMOUS FINANCE MARKET, 2022-2032 ($MILLION)
- FIGURE 40. AFRICA AUTONOMOUS FINANCE MARKET, 2022-2032 ($MILLION)
- FIGURE 41. TOP WINNING STRATEGIES, BY YEAR (2020-2023)
- FIGURE 42. TOP WINNING STRATEGIES, BY DEVELOPMENT (2020-2023)
- FIGURE 43. TOP WINNING STRATEGIES, BY COMPANY (2020-2023)
- FIGURE 44. PRODUCT MAPPING OF TOP 10 PLAYERS
- FIGURE 45. COMPETITIVE DASHBOARD
- FIGURE 46. COMPETITIVE HEATMAP: AUTONOMOUS FINANCE MARKET
- FIGURE 47. TOP PLAYER POSITIONING, 2022
- FIGURE 48. ORACLE CORPORATION: NET REVENUE, 2020-2022 ($MILLION)
- FIGURE 49. ORACLE CORPORATION: REVENUE SHARE BY SEGMENT, 2022 (%)
- FIGURE 50. ORACLE CORPORATION: REVENUE SHARE BY REGION, 2022 (%)
- FIGURE 51. NICE ACTIMIZE: NET REVENUE, 2020-2022 ($MILLION)
- FIGURE 52. NICE ACTIMIZE: REVENUE SHARE BY SEGMENT, 2022 (%)
- FIGURE 53. NICE ACTIMIZE: REVENUE SHARE BY REGION, 2022 (%)

