
PUBLISHER: Allied Market Research | PRODUCT CODE: 1414930

PUBLISHER: Allied Market Research | PRODUCT CODE: 1414930
Security as a Service Market By Component, By Application, By Organization Size, By Industry Vertical : Global Opportunity Analysis and Industry Forecast, 2023-2032
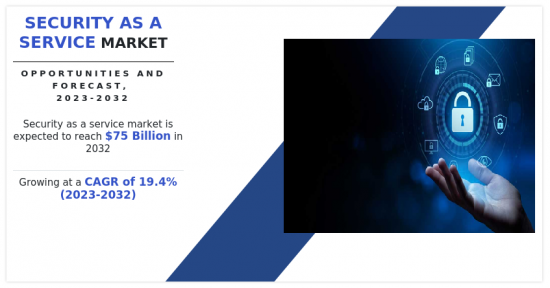
According to a new report published by Allied Market Research, titled, "Security as a Service Market," The security as a service market was valued at $13 billion in 2022, and is estimated to reach $75 billion by 2032, growing at a CAGR of 19.4% from 2023 to 2032.
The surge in cyber threats has raised the demand for security services, providing a boost to the security as a service market. As more businesses and individuals connect online, the risk of cyber-attacks has grown substantially. This escalating threat landscape has led to higher adoption of security as a service solution, where organizations outsource their security needs to specialized providers. Furthermore, with the rising complexity of cyber threats, there is a growing demand for advanced security solutions, propelling the expansion of the security as a service market. Traditional security measures are often insufficient to protect against the evolving tactics of cybercriminals, prompting businesses to seek more sophisticated and dynamic approaches. In addition, the rising adoption of cloud-based services is a significant driver behind the increasing growth of the security as a service market. As businesses migrate their operations to the cloud for enhanced flexibility and efficiency, they are faced with new security challenges. Cloud environments introduce unique vulnerabilities that require specialized protection against data breaches and cyber threats, which drives the need for advanced security measures. However, data privacy and security concerns in outsourcing models are significantly impacting the growth of the security as a service market. Moreover, the complexity of seamlessly incorporating SECaaS into existing IT infrastructure is limiting the growth of the security as a service market. Many organizations face difficulties in integrating these security solutions with their current systems, leading to operational disruptions and compatibility issues. On the contrary, the increase in demand for advanced threat intelligence and analytics solutions is anticipated to significantly boost the growth of the security as a service market in the upcoming years.
The security as a service market is segmented into component, application, organization size, industry vertical, and region. On the basis of component, the market is classified into solution and service. By application, the market is segregated into network security, endpoint security, application security, cloud security, and others. On the basis of organization size, the market is categorized into large enterprises, and small & medium-sized enterprises. By industry vertical, the market is divided into BFSI, government & defense, retail & e-commerce, healthcare & life sciences, IT & telecom, energy & utilities, manufacturing, and others. Region-wise, the market is analyzed across North America, Europe, Asia-Pacific, and LAMEA.
The key players operating in the security as a service market include Oracle Corporation, Proofpoint, Inc., Qualys, Inc., Okta, Sophos Ltd., Microsoft Corporation, IBM Corporation, Trend Micro Incorporated, Cisco Systems, Inc., and Forcepoint. These players have adopted various strategies to increase their market penetration and strengthen their position in the security as a service industry.
Key Benefits for Stakeholders
- The study provides in-depth analysis of the security as a service market along with current trends and future estimations to illustrate the imminent investment pockets.
- Information about key drivers, restrains, & opportunities and their impact analysis on the security as a service market size are provided in the report.
- The Porter's five forces analysis illustrates the potency of buyers and suppliers operating in the industry.
- The quantitative analysis of the security as a service market from 2022 to 2032 is provided to determine the market potential.
Additional benefits you will get with this purchase are:
- Quarterly Update and* (only available with a corporate license, on listed price)
- 5 additional Company Profile of client Choice pre- or Post-purchase, as a free update.
- Free Upcoming Version on the Purchase of Five and Enterprise User License.
- 16 analyst hours of support* (post-purchase, if you find additional data requirements upon review of the report, you may receive support amounting to 16 analyst hours to solve questions, and post-sale queries)
- 15% Free Customization* (in case the scope or segment of the report does not match your requirements, 15% is equivalent to 3 working days of free work, applicable once)
- Free data Pack on the Five and Enterprise User License. (Excel version of the report)
- Free Updated report if the report is 6-12 months old or older.
- 24-hour priority response*
- Free Industry updates and white papers.
Possible Customization with this report (with additional cost and timeline, please talk to the sales executive to know more)
- Investment Opportunities
- Market share analysis of players by products/segments
- Regulatory Guidelines
- Additional company profiles with specific to client's interest
- Additional country or region analysis- market size and forecast
- Expanded list for Company Profiles
- Market share analysis of players at global/region/country level
Key Market Segments
By Component
- Solution
- Service
By Application
- Network Security
- Endpoint Security
- Application Security
- Cloud Security
- Others
By Organization Size
- Large Enterprises
- Small and Medium-sized Enterprises
By Industry Vertical
- BFSI
- Government and Defense
- Retail and E-commerce
- Healthcare and Life Sciences
- IT and Telecom
- Energy and Utilities
- Manufacturing
- Others
By Region
- North America
- U.S.
- Canada
- Europe
- UK
- Germany
- France
- Italy
- Spain
- Rest of Europe
- Asia-Pacific
- China
- Japan
- India
- Australia
- South Korea
- Rest of Asia-Pacific
- LAMEA
- Latin America
- Middle East
- Africa
Key Market Players:
- Oracle Corporation
- Proofpoint, Inc.
- Microsoft Corporation
- IBM Corporation
- Qualys, Inc.
- Okta
- Sophos Ltd.
- Trend Micro Incorporated
- Cisco Systems, Inc.
- Forcepoint
TABLE OF CONTENTS
CHAPTER 1: INTRODUCTION
- 1.1. Report description
- 1.2. Key market segments
- 1.3. Key benefits to the stakeholders
- 1.4. Research methodology
- 1.4.1. Primary research
- 1.4.2. Secondary research
- 1.4.3. Analyst tools and models
CHAPTER 2: EXECUTIVE SUMMARY
- 2.1. CXO Perspective
CHAPTER 3: MARKET OVERVIEW
- 3.1. Market definition and scope
- 3.2. Key findings
- 3.2.1. Top impacting factors
- 3.2.2. Top investment pockets
- 3.3. Porter's five forces analysis
- 3.3.1. Low bargaining power of suppliers
- 3.3.2. Low threat of new entrants
- 3.3.3. Low threat of substitutes
- 3.3.4. Low intensity of rivalry
- 3.3.5. Low bargaining power of buyers
- 3.4. Market dynamics
- 3.4.1. Drivers
- 3.4.1.1. Increase in cyber threats
- 3.4.1.2. The need for advanced security solutions
- 3.4.1.3. Rising adoption of cloud-based services
- 3.4.2. Restraints
- 3.4.2.1. Data privacy and security concerns in outsourcing models
- 3.4.2.2. Challenges associated with integrating SECaaS solutions
- 3.4.3. Opportunities
- 3.4.3.1. Rise in demand for advanced threat intelligence and analytics solutions
- 3.4.1. Drivers
CHAPTER 4: SECURITY AS A SERVICE MARKET, BY COMPONENT
- 4.1. Overview
- 4.1.1. Market size and forecast
- 4.2. Solution
- 4.2.1. Key market trends, growth factors and opportunities
- 4.2.2. Market size and forecast, by region
- 4.2.3. Market share analysis by country
- 4.3. Service
- 4.3.1. Key market trends, growth factors and opportunities
- 4.3.2. Market size and forecast, by region
- 4.3.3. Market share analysis by country
CHAPTER 5: SECURITY AS A SERVICE MARKET, BY APPLICATION
- 5.1. Overview
- 5.1.1. Market size and forecast
- 5.2. Network Security
- 5.2.1. Key market trends, growth factors and opportunities
- 5.2.2. Market size and forecast, by region
- 5.2.3. Market share analysis by country
- 5.3. Endpoint Security
- 5.3.1. Key market trends, growth factors and opportunities
- 5.3.2. Market size and forecast, by region
- 5.3.3. Market share analysis by country
- 5.4. Application Security
- 5.4.1. Key market trends, growth factors and opportunities
- 5.4.2. Market size and forecast, by region
- 5.4.3. Market share analysis by country
- 5.5. Cloud Security
- 5.5.1. Key market trends, growth factors and opportunities
- 5.5.2. Market size and forecast, by region
- 5.5.3. Market share analysis by country
- 5.6. Others
- 5.6.1. Key market trends, growth factors and opportunities
- 5.6.2. Market size and forecast, by region
- 5.6.3. Market share analysis by country
CHAPTER 6: SECURITY AS A SERVICE MARKET, BY ORGANIZATION SIZE
- 6.1. Overview
- 6.1.1. Market size and forecast
- 6.2. Large Enterprises
- 6.2.1. Key market trends, growth factors and opportunities
- 6.2.2. Market size and forecast, by region
- 6.2.3. Market share analysis by country
- 6.3. Small and Medium-sized Enterprises
- 6.3.1. Key market trends, growth factors and opportunities
- 6.3.2. Market size and forecast, by region
- 6.3.3. Market share analysis by country
CHAPTER 7: SECURITY AS A SERVICE MARKET, BY INDUSTRY VERTICAL
- 7.1. Overview
- 7.1.1. Market size and forecast
- 7.2. BFSI
- 7.2.1. Key market trends, growth factors and opportunities
- 7.2.2. Market size and forecast, by region
- 7.2.3. Market share analysis by country
- 7.3. Government and Defense
- 7.3.1. Key market trends, growth factors and opportunities
- 7.3.2. Market size and forecast, by region
- 7.3.3. Market share analysis by country
- 7.4. Retail and E-commerce
- 7.4.1. Key market trends, growth factors and opportunities
- 7.4.2. Market size and forecast, by region
- 7.4.3. Market share analysis by country
- 7.5. Healthcare and Life Sciences
- 7.5.1. Key market trends, growth factors and opportunities
- 7.5.2. Market size and forecast, by region
- 7.5.3. Market share analysis by country
- 7.6. IT and Telecom
- 7.6.1. Key market trends, growth factors and opportunities
- 7.6.2. Market size and forecast, by region
- 7.6.3. Market share analysis by country
- 7.7. Energy and Utilities
- 7.7.1. Key market trends, growth factors and opportunities
- 7.7.2. Market size and forecast, by region
- 7.7.3. Market share analysis by country
- 7.8. Manufacturing
- 7.8.1. Key market trends, growth factors and opportunities
- 7.8.2. Market size and forecast, by region
- 7.8.3. Market share analysis by country
- 7.9. Others
- 7.9.1. Key market trends, growth factors and opportunities
- 7.9.2. Market size and forecast, by region
- 7.9.3. Market share analysis by country
CHAPTER 8: SECURITY AS A SERVICE MARKET, BY REGION
- 8.1. Overview
- 8.1.1. Market size and forecast By Region
- 8.2. North America
- 8.2.1. Key market trends, growth factors and opportunities
- 8.2.2. Market size and forecast, by Component
- 8.2.3. Market size and forecast, by Application
- 8.2.4. Market size and forecast, by Organization Size
- 8.2.5. Market size and forecast, by Industry Vertical
- 8.2.6. Market size and forecast, by country
- 8.2.6.1. U.S.
- 8.2.6.1.1. Market size and forecast, by Component
- 8.2.6.1.2. Market size and forecast, by Application
- 8.2.6.1.3. Market size and forecast, by Organization Size
- 8.2.6.1.4. Market size and forecast, by Industry Vertical
- 8.2.6.2. Canada
- 8.2.6.2.1. Market size and forecast, by Component
- 8.2.6.2.2. Market size and forecast, by Application
- 8.2.6.2.3. Market size and forecast, by Organization Size
- 8.2.6.2.4. Market size and forecast, by Industry Vertical
- 8.3. Europe
- 8.3.1. Key market trends, growth factors and opportunities
- 8.3.2. Market size and forecast, by Component
- 8.3.3. Market size and forecast, by Application
- 8.3.4. Market size and forecast, by Organization Size
- 8.3.5. Market size and forecast, by Industry Vertical
- 8.3.6. Market size and forecast, by country
- 8.3.6.1. UK
- 8.3.6.1.1. Market size and forecast, by Component
- 8.3.6.1.2. Market size and forecast, by Application
- 8.3.6.1.3. Market size and forecast, by Organization Size
- 8.3.6.1.4. Market size and forecast, by Industry Vertical
- 8.3.6.2. Germany
- 8.3.6.2.1. Market size and forecast, by Component
- 8.3.6.2.2. Market size and forecast, by Application
- 8.3.6.2.3. Market size and forecast, by Organization Size
- 8.3.6.2.4. Market size and forecast, by Industry Vertical
- 8.3.6.3. France
- 8.3.6.3.1. Market size and forecast, by Component
- 8.3.6.3.2. Market size and forecast, by Application
- 8.3.6.3.3. Market size and forecast, by Organization Size
- 8.3.6.3.4. Market size and forecast, by Industry Vertical
- 8.3.6.4. Italy
- 8.3.6.4.1. Market size and forecast, by Component
- 8.3.6.4.2. Market size and forecast, by Application
- 8.3.6.4.3. Market size and forecast, by Organization Size
- 8.3.6.4.4. Market size and forecast, by Industry Vertical
- 8.3.6.5. Spain
- 8.3.6.5.1. Market size and forecast, by Component
- 8.3.6.5.2. Market size and forecast, by Application
- 8.3.6.5.3. Market size and forecast, by Organization Size
- 8.3.6.5.4. Market size and forecast, by Industry Vertical
- 8.3.6.6. Rest of Europe
- 8.3.6.6.1. Market size and forecast, by Component
- 8.3.6.6.2. Market size and forecast, by Application
- 8.3.6.6.3. Market size and forecast, by Organization Size
- 8.3.6.6.4. Market size and forecast, by Industry Vertical
- 8.4. Asia-Pacific
- 8.4.1. Key market trends, growth factors and opportunities
- 8.4.2. Market size and forecast, by Component
- 8.4.3. Market size and forecast, by Application
- 8.4.4. Market size and forecast, by Organization Size
- 8.4.5. Market size and forecast, by Industry Vertical
- 8.4.6. Market size and forecast, by country
- 8.4.6.1. China
- 8.4.6.1.1. Market size and forecast, by Component
- 8.4.6.1.2. Market size and forecast, by Application
- 8.4.6.1.3. Market size and forecast, by Organization Size
- 8.4.6.1.4. Market size and forecast, by Industry Vertical
- 8.4.6.2. Japan
- 8.4.6.2.1. Market size and forecast, by Component
- 8.4.6.2.2. Market size and forecast, by Application
- 8.4.6.2.3. Market size and forecast, by Organization Size
- 8.4.6.2.4. Market size and forecast, by Industry Vertical
- 8.4.6.3. India
- 8.4.6.3.1. Market size and forecast, by Component
- 8.4.6.3.2. Market size and forecast, by Application
- 8.4.6.3.3. Market size and forecast, by Organization Size
- 8.4.6.3.4. Market size and forecast, by Industry Vertical
- 8.4.6.4. Australia
- 8.4.6.4.1. Market size and forecast, by Component
- 8.4.6.4.2. Market size and forecast, by Application
- 8.4.6.4.3. Market size and forecast, by Organization Size
- 8.4.6.4.4. Market size and forecast, by Industry Vertical
- 8.4.6.5. South Korea
- 8.4.6.5.1. Market size and forecast, by Component
- 8.4.6.5.2. Market size and forecast, by Application
- 8.4.6.5.3. Market size and forecast, by Organization Size
- 8.4.6.5.4. Market size and forecast, by Industry Vertical
- 8.4.6.6. Rest of Asia-Pacific
- 8.4.6.6.1. Market size and forecast, by Component
- 8.4.6.6.2. Market size and forecast, by Application
- 8.4.6.6.3. Market size and forecast, by Organization Size
- 8.4.6.6.4. Market size and forecast, by Industry Vertical
- 8.5. LAMEA
- 8.5.1. Key market trends, growth factors and opportunities
- 8.5.2. Market size and forecast, by Component
- 8.5.3. Market size and forecast, by Application
- 8.5.4. Market size and forecast, by Organization Size
- 8.5.5. Market size and forecast, by Industry Vertical
- 8.5.6. Market size and forecast, by country
- 8.5.6.1. Latin America
- 8.5.6.1.1. Market size and forecast, by Component
- 8.5.6.1.2. Market size and forecast, by Application
- 8.5.6.1.3. Market size and forecast, by Organization Size
- 8.5.6.1.4. Market size and forecast, by Industry Vertical
- 8.5.6.2. Middle East
- 8.5.6.2.1. Market size and forecast, by Component
- 8.5.6.2.2. Market size and forecast, by Application
- 8.5.6.2.3. Market size and forecast, by Organization Size
- 8.5.6.2.4. Market size and forecast, by Industry Vertical
- 8.5.6.3. Africa
- 8.5.6.3.1. Market size and forecast, by Component
- 8.5.6.3.2. Market size and forecast, by Application
- 8.5.6.3.3. Market size and forecast, by Organization Size
- 8.5.6.3.4. Market size and forecast, by Industry Vertical
CHAPTER 9: COMPETITIVE LANDSCAPE
- 9.1. Introduction
- 9.2. Top winning strategies
- 9.3. Product mapping of top 10 player
- 9.4. Competitive dashboard
- 9.5. Competitive heatmap
- 9.6. Top player positioning, 2022
CHAPTER 10: COMPANY PROFILES
- 10.1. Oracle Corporation
- 10.1.1. Company overview
- 10.1.2. Key executives
- 10.1.3. Company snapshot
- 10.1.4. Operating business segments
- 10.1.5. Product portfolio
- 10.1.6. Business performance
- 10.1.7. Key strategic moves and developments
- 10.2. Proofpoint, Inc.
- 10.2.1. Company overview
- 10.2.2. Key executives
- 10.2.3. Company snapshot
- 10.2.4. Operating business segments
- 10.2.5. Product portfolio
- 10.2.6. Key strategic moves and developments
- 10.3. Qualys, Inc.
- 10.3.1. Company overview
- 10.3.2. Key executives
- 10.3.3. Company snapshot
- 10.3.4. Operating business segments
- 10.3.5. Product portfolio
- 10.3.6. Business performance
- 10.3.7. Key strategic moves and developments
- 10.4. Okta
- 10.4.1. Company overview
- 10.4.2. Key executives
- 10.4.3. Company snapshot
- 10.4.4. Operating business segments
- 10.4.5. Product portfolio
- 10.4.6. Business performance
- 10.5. Sophos Ltd.
- 10.5.1. Company overview
- 10.5.2. Key executives
- 10.5.3. Company snapshot
- 10.5.4. Operating business segments
- 10.5.5. Product portfolio
- 10.5.6. Key strategic moves and developments
- 10.6. Microsoft Corporation
- 10.6.1. Company overview
- 10.6.2. Key executives
- 10.6.3. Company snapshot
- 10.6.4. Operating business segments
- 10.6.5. Product portfolio
- 10.6.6. Business performance
- 10.6.7. Key strategic moves and developments
- 10.7. IBM Corporation
- 10.7.1. Company overview
- 10.7.2. Key executives
- 10.7.3. Company snapshot
- 10.7.4. Operating business segments
- 10.7.5. Product portfolio
- 10.7.6. Business performance
- 10.7.7. Key strategic moves and developments
- 10.8. Trend Micro Incorporated
- 10.8.1. Company overview
- 10.8.2. Key executives
- 10.8.3. Company snapshot
- 10.8.4. Operating business segments
- 10.8.5. Product portfolio
- 10.8.6. Business performance
- 10.8.7. Key strategic moves and developments
- 10.9. Cisco Systems, Inc.
- 10.9.1. Company overview
- 10.9.2. Key executives
- 10.9.3. Company snapshot
- 10.9.4. Operating business segments
- 10.9.5. Product portfolio
- 10.9.6. Business performance
- 10.9.7. Key strategic moves and developments
- 10.10. Forcepoint
- 10.10.1. Company overview
- 10.10.2. Key executives
- 10.10.3. Company snapshot
- 10.10.4. Operating business segments
- 10.10.5. Product portfolio
- 10.10.6. Key strategic moves and developments
LIST OF TABLES
- TABLE 01. GLOBAL SECURITY AS A SERVICE MARKET, BY COMPONENT, 2022-2032 ($MILLION)
- TABLE 02. SECURITY AS A SERVICE MARKET FOR SOLUTION, BY REGION, 2022-2032 ($MILLION)
- TABLE 03. SECURITY AS A SERVICE MARKET FOR SERVICE, BY REGION, 2022-2032 ($MILLION)
- TABLE 04. GLOBAL SECURITY AS A SERVICE MARKET, BY APPLICATION, 2022-2032 ($MILLION)
- TABLE 05. SECURITY AS A SERVICE MARKET FOR NETWORK SECURITY, BY REGION, 2022-2032 ($MILLION)
- TABLE 06. SECURITY AS A SERVICE MARKET FOR ENDPOINT SECURITY, BY REGION, 2022-2032 ($MILLION)
- TABLE 07. SECURITY AS A SERVICE MARKET FOR APPLICATION SECURITY, BY REGION, 2022-2032 ($MILLION)
- TABLE 08. SECURITY AS A SERVICE MARKET FOR CLOUD SECURITY, BY REGION, 2022-2032 ($MILLION)
- TABLE 09. SECURITY AS A SERVICE MARKET FOR OTHERS, BY REGION, 2022-2032 ($MILLION)
- TABLE 10. GLOBAL SECURITY AS A SERVICE MARKET, BY ORGANIZATION SIZE, 2022-2032 ($MILLION)
- TABLE 11. SECURITY AS A SERVICE MARKET FOR LARGE ENTERPRISES, BY REGION, 2022-2032 ($MILLION)
- TABLE 12. SECURITY AS A SERVICE MARKET FOR SMALL AND MEDIUM-SIZED ENTERPRISES, BY REGION, 2022-2032 ($MILLION)
- TABLE 13. GLOBAL SECURITY AS A SERVICE MARKET, BY INDUSTRY VERTICAL, 2022-2032 ($MILLION)
- TABLE 14. SECURITY AS A SERVICE MARKET FOR BFSI, BY REGION, 2022-2032 ($MILLION)
- TABLE 15. SECURITY AS A SERVICE MARKET FOR GOVERNMENT AND DEFENSE, BY REGION, 2022-2032 ($MILLION)
- TABLE 16. SECURITY AS A SERVICE MARKET FOR RETAIL AND E-COMMERCE, BY REGION, 2022-2032 ($MILLION)
- TABLE 17. SECURITY AS A SERVICE MARKET FOR HEALTHCARE AND LIFE SCIENCES, BY REGION, 2022-2032 ($MILLION)
- TABLE 18. SECURITY AS A SERVICE MARKET FOR IT AND TELECOM, BY REGION, 2022-2032 ($MILLION)
- TABLE 19. SECURITY AS A SERVICE MARKET FOR ENERGY AND UTILITIES, BY REGION, 2022-2032 ($MILLION)
- TABLE 20. SECURITY AS A SERVICE MARKET FOR MANUFACTURING, BY REGION, 2022-2032 ($MILLION)
- TABLE 21. SECURITY AS A SERVICE MARKET FOR OTHERS, BY REGION, 2022-2032 ($MILLION)
- TABLE 22. SECURITY AS A SERVICE MARKET, BY REGION, 2022-2032 ($MILLION)
- TABLE 23. NORTH AMERICA SECURITY AS A SERVICE MARKET, BY COMPONENT, 2022-2032 ($MILLION)
- TABLE 24. NORTH AMERICA SECURITY AS A SERVICE MARKET, BY APPLICATION, 2022-2032 ($MILLION)
- TABLE 25. NORTH AMERICA SECURITY AS A SERVICE MARKET, BY ORGANIZATION SIZE, 2022-2032 ($MILLION)
- TABLE 26. NORTH AMERICA SECURITY AS A SERVICE MARKET, BY INDUSTRY VERTICAL, 2022-2032 ($MILLION)
- TABLE 27. NORTH AMERICA SECURITY AS A SERVICE MARKET, BY COUNTRY, 2022-2032 ($MILLION)
- TABLE 28. U.S. SECURITY AS A SERVICE MARKET, BY COMPONENT, 2022-2032 ($MILLION)
- TABLE 29. U.S. SECURITY AS A SERVICE MARKET, BY APPLICATION, 2022-2032 ($MILLION)
- TABLE 30. U.S. SECURITY AS A SERVICE MARKET, BY ORGANIZATION SIZE, 2022-2032 ($MILLION)
- TABLE 31. U.S. SECURITY AS A SERVICE MARKET, BY INDUSTRY VERTICAL, 2022-2032 ($MILLION)
- TABLE 32. CANADA SECURITY AS A SERVICE MARKET, BY COMPONENT, 2022-2032 ($MILLION)
- TABLE 33. CANADA SECURITY AS A SERVICE MARKET, BY APPLICATION, 2022-2032 ($MILLION)
- TABLE 34. CANADA SECURITY AS A SERVICE MARKET, BY ORGANIZATION SIZE, 2022-2032 ($MILLION)
- TABLE 35. CANADA SECURITY AS A SERVICE MARKET, BY INDUSTRY VERTICAL, 2022-2032 ($MILLION)
- TABLE 36. EUROPE SECURITY AS A SERVICE MARKET, BY COMPONENT, 2022-2032 ($MILLION)
- TABLE 37. EUROPE SECURITY AS A SERVICE MARKET, BY APPLICATION, 2022-2032 ($MILLION)
- TABLE 38. EUROPE SECURITY AS A SERVICE MARKET, BY ORGANIZATION SIZE, 2022-2032 ($MILLION)
- TABLE 39. EUROPE SECURITY AS A SERVICE MARKET, BY INDUSTRY VERTICAL, 2022-2032 ($MILLION)
- TABLE 40. EUROPE SECURITY AS A SERVICE MARKET, BY COUNTRY, 2022-2032 ($MILLION)
- TABLE 41. UK SECURITY AS A SERVICE MARKET, BY COMPONENT, 2022-2032 ($MILLION)
- TABLE 42. UK SECURITY AS A SERVICE MARKET, BY APPLICATION, 2022-2032 ($MILLION)
- TABLE 43. UK SECURITY AS A SERVICE MARKET, BY ORGANIZATION SIZE, 2022-2032 ($MILLION)
- TABLE 44. UK SECURITY AS A SERVICE MARKET, BY INDUSTRY VERTICAL, 2022-2032 ($MILLION)
- TABLE 45. GERMANY SECURITY AS A SERVICE MARKET, BY COMPONENT, 2022-2032 ($MILLION)
- TABLE 46. GERMANY SECURITY AS A SERVICE MARKET, BY APPLICATION, 2022-2032 ($MILLION)
- TABLE 47. GERMANY SECURITY AS A SERVICE MARKET, BY ORGANIZATION SIZE, 2022-2032 ($MILLION)
- TABLE 48. GERMANY SECURITY AS A SERVICE MARKET, BY INDUSTRY VERTICAL, 2022-2032 ($MILLION)
- TABLE 49. FRANCE SECURITY AS A SERVICE MARKET, BY COMPONENT, 2022-2032 ($MILLION)
- TABLE 50. FRANCE SECURITY AS A SERVICE MARKET, BY APPLICATION, 2022-2032 ($MILLION)
- TABLE 51. FRANCE SECURITY AS A SERVICE MARKET, BY ORGANIZATION SIZE, 2022-2032 ($MILLION)
- TABLE 52. FRANCE SECURITY AS A SERVICE MARKET, BY INDUSTRY VERTICAL, 2022-2032 ($MILLION)
- TABLE 53. ITALY SECURITY AS A SERVICE MARKET, BY COMPONENT, 2022-2032 ($MILLION)
- TABLE 54. ITALY SECURITY AS A SERVICE MARKET, BY APPLICATION, 2022-2032 ($MILLION)
- TABLE 55. ITALY SECURITY AS A SERVICE MARKET, BY ORGANIZATION SIZE, 2022-2032 ($MILLION)
- TABLE 56. ITALY SECURITY AS A SERVICE MARKET, BY INDUSTRY VERTICAL, 2022-2032 ($MILLION)
- TABLE 57. SPAIN SECURITY AS A SERVICE MARKET, BY COMPONENT, 2022-2032 ($MILLION)
- TABLE 58. SPAIN SECURITY AS A SERVICE MARKET, BY APPLICATION, 2022-2032 ($MILLION)
- TABLE 59. SPAIN SECURITY AS A SERVICE MARKET, BY ORGANIZATION SIZE, 2022-2032 ($MILLION)
- TABLE 60. SPAIN SECURITY AS A SERVICE MARKET, BY INDUSTRY VERTICAL, 2022-2032 ($MILLION)
- TABLE 61. REST OF EUROPE SECURITY AS A SERVICE MARKET, BY COMPONENT, 2022-2032 ($MILLION)
- TABLE 62. REST OF EUROPE SECURITY AS A SERVICE MARKET, BY APPLICATION, 2022-2032 ($MILLION)
- TABLE 63. REST OF EUROPE SECURITY AS A SERVICE MARKET, BY ORGANIZATION SIZE, 2022-2032 ($MILLION)
- TABLE 64. REST OF EUROPE SECURITY AS A SERVICE MARKET, BY INDUSTRY VERTICAL, 2022-2032 ($MILLION)
- TABLE 65. ASIA-PACIFIC SECURITY AS A SERVICE MARKET, BY COMPONENT, 2022-2032 ($MILLION)
- TABLE 66. ASIA-PACIFIC SECURITY AS A SERVICE MARKET, BY APPLICATION, 2022-2032 ($MILLION)
- TABLE 67. ASIA-PACIFIC SECURITY AS A SERVICE MARKET, BY ORGANIZATION SIZE, 2022-2032 ($MILLION)
- TABLE 68. ASIA-PACIFIC SECURITY AS A SERVICE MARKET, BY INDUSTRY VERTICAL, 2022-2032 ($MILLION)
- TABLE 69. ASIA-PACIFIC SECURITY AS A SERVICE MARKET, BY COUNTRY, 2022-2032 ($MILLION)
- TABLE 70. CHINA SECURITY AS A SERVICE MARKET, BY COMPONENT, 2022-2032 ($MILLION)
- TABLE 71. CHINA SECURITY AS A SERVICE MARKET, BY APPLICATION, 2022-2032 ($MILLION)
- TABLE 72. CHINA SECURITY AS A SERVICE MARKET, BY ORGANIZATION SIZE, 2022-2032 ($MILLION)
- TABLE 73. CHINA SECURITY AS A SERVICE MARKET, BY INDUSTRY VERTICAL, 2022-2032 ($MILLION)
- TABLE 74. JAPAN SECURITY AS A SERVICE MARKET, BY COMPONENT, 2022-2032 ($MILLION)
- TABLE 75. JAPAN SECURITY AS A SERVICE MARKET, BY APPLICATION, 2022-2032 ($MILLION)
- TABLE 76. JAPAN SECURITY AS A SERVICE MARKET, BY ORGANIZATION SIZE, 2022-2032 ($MILLION)
- TABLE 77. JAPAN SECURITY AS A SERVICE MARKET, BY INDUSTRY VERTICAL, 2022-2032 ($MILLION)
- TABLE 78. INDIA SECURITY AS A SERVICE MARKET, BY COMPONENT, 2022-2032 ($MILLION)
- TABLE 79. INDIA SECURITY AS A SERVICE MARKET, BY APPLICATION, 2022-2032 ($MILLION)
- TABLE 80. INDIA SECURITY AS A SERVICE MARKET, BY ORGANIZATION SIZE, 2022-2032 ($MILLION)
- TABLE 81. INDIA SECURITY AS A SERVICE MARKET, BY INDUSTRY VERTICAL, 2022-2032 ($MILLION)
- TABLE 82. AUSTRALIA SECURITY AS A SERVICE MARKET, BY COMPONENT, 2022-2032 ($MILLION)
- TABLE 83. AUSTRALIA SECURITY AS A SERVICE MARKET, BY APPLICATION, 2022-2032 ($MILLION)
- TABLE 84. AUSTRALIA SECURITY AS A SERVICE MARKET, BY ORGANIZATION SIZE, 2022-2032 ($MILLION)
- TABLE 85. AUSTRALIA SECURITY AS A SERVICE MARKET, BY INDUSTRY VERTICAL, 2022-2032 ($MILLION)
- TABLE 86. SOUTH KOREA SECURITY AS A SERVICE MARKET, BY COMPONENT, 2022-2032 ($MILLION)
- TABLE 87. SOUTH KOREA SECURITY AS A SERVICE MARKET, BY APPLICATION, 2022-2032 ($MILLION)
- TABLE 88. SOUTH KOREA SECURITY AS A SERVICE MARKET, BY ORGANIZATION SIZE, 2022-2032 ($MILLION)
- TABLE 89. SOUTH KOREA SECURITY AS A SERVICE MARKET, BY INDUSTRY VERTICAL, 2022-2032 ($MILLION)
- TABLE 90. REST OF ASIA-PACIFIC SECURITY AS A SERVICE MARKET, BY COMPONENT, 2022-2032 ($MILLION)
- TABLE 91. REST OF ASIA-PACIFIC SECURITY AS A SERVICE MARKET, BY APPLICATION, 2022-2032 ($MILLION)
- TABLE 92. REST OF ASIA-PACIFIC SECURITY AS A SERVICE MARKET, BY ORGANIZATION SIZE, 2022-2032 ($MILLION)
- TABLE 93. REST OF ASIA-PACIFIC SECURITY AS A SERVICE MARKET, BY INDUSTRY VERTICAL, 2022-2032 ($MILLION)
- TABLE 94. LAMEA SECURITY AS A SERVICE MARKET, BY COMPONENT, 2022-2032 ($MILLION)
- TABLE 95. LAMEA SECURITY AS A SERVICE MARKET, BY APPLICATION, 2022-2032 ($MILLION)
- TABLE 96. LAMEA SECURITY AS A SERVICE MARKET, BY ORGANIZATION SIZE, 2022-2032 ($MILLION)
- TABLE 97. LAMEA SECURITY AS A SERVICE MARKET, BY INDUSTRY VERTICAL, 2022-2032 ($MILLION)
- TABLE 98. LAMEA SECURITY AS A SERVICE MARKET, BY COUNTRY, 2022-2032 ($MILLION)
- TABLE 99. LATIN AMERICA SECURITY AS A SERVICE MARKET, BY COMPONENT, 2022-2032 ($MILLION)
- TABLE 100. LATIN AMERICA SECURITY AS A SERVICE MARKET, BY APPLICATION, 2022-2032 ($MILLION)
- TABLE 101. LATIN AMERICA SECURITY AS A SERVICE MARKET, BY ORGANIZATION SIZE, 2022-2032 ($MILLION)
- TABLE 102. LATIN AMERICA SECURITY AS A SERVICE MARKET, BY INDUSTRY VERTICAL, 2022-2032 ($MILLION)
- TABLE 103. MIDDLE EAST SECURITY AS A SERVICE MARKET, BY COMPONENT, 2022-2032 ($MILLION)
- TABLE 104. MIDDLE EAST SECURITY AS A SERVICE MARKET, BY APPLICATION, 2022-2032 ($MILLION)
- TABLE 105. MIDDLE EAST SECURITY AS A SERVICE MARKET, BY ORGANIZATION SIZE, 2022-2032 ($MILLION)
- TABLE 106. MIDDLE EAST SECURITY AS A SERVICE MARKET, BY INDUSTRY VERTICAL, 2022-2032 ($MILLION)
- TABLE 107. AFRICA SECURITY AS A SERVICE MARKET, BY COMPONENT, 2022-2032 ($MILLION)
- TABLE 108. AFRICA SECURITY AS A SERVICE MARKET, BY APPLICATION, 2022-2032 ($MILLION)
- TABLE 109. AFRICA SECURITY AS A SERVICE MARKET, BY ORGANIZATION SIZE, 2022-2032 ($MILLION)
- TABLE 110. AFRICA SECURITY AS A SERVICE MARKET, BY INDUSTRY VERTICAL, 2022-2032 ($MILLION)
- TABLE 111. ORACLE CORPORATION: KEY EXECUTIVES
- TABLE 112. ORACLE CORPORATION: COMPANY SNAPSHOT
- TABLE 113. ORACLE CORPORATION: SERVICE SEGMENTS
- TABLE 114. ORACLE CORPORATION: PRODUCT PORTFOLIO
- TABLE 115. ORACLE CORPORATION: KEY STRATERGIES
- TABLE 116. PROOFPOINT, INC.: KEY EXECUTIVES
- TABLE 117. PROOFPOINT, INC.: COMPANY SNAPSHOT
- TABLE 118. PROOFPOINT, INC.: SERVICE SEGMENTS
- TABLE 119. PROOFPOINT, INC.: PRODUCT PORTFOLIO
- TABLE 120. PROOFPOINT, INC.: KEY STRATERGIES
- TABLE 121. QUALYS, INC.: KEY EXECUTIVES
- TABLE 122. QUALYS, INC.: COMPANY SNAPSHOT
- TABLE 123. QUALYS, INC.: PRODUCT SEGMENTS
- TABLE 124. QUALYS, INC.: PRODUCT PORTFOLIO
- TABLE 125. QUALYS, INC.: KEY STRATERGIES
- TABLE 126. OKTA: KEY EXECUTIVES
- TABLE 127. OKTA: COMPANY SNAPSHOT
- TABLE 128. OKTA: PRODUCT SEGMENTS
- TABLE 129. OKTA: PRODUCT PORTFOLIO
- TABLE 130. SOPHOS LTD.: KEY EXECUTIVES
- TABLE 131. SOPHOS LTD.: COMPANY SNAPSHOT
- TABLE 132. SOPHOS LTD.: SERVICE SEGMENTS
- TABLE 133. SOPHOS LTD.: PRODUCT PORTFOLIO
- TABLE 134. SOPHOS LTD.: KEY STRATERGIES
- TABLE 135. MICROSOFT CORPORATION: KEY EXECUTIVES
- TABLE 136. MICROSOFT CORPORATION: COMPANY SNAPSHOT
- TABLE 137. MICROSOFT CORPORATION: SERVICE SEGMENTS
- TABLE 138. MICROSOFT CORPORATION: PRODUCT PORTFOLIO
- TABLE 139. MICROSOFT CORPORATION: KEY STRATERGIES
- TABLE 140. IBM CORPORATION: KEY EXECUTIVES
- TABLE 141. IBM CORPORATION: COMPANY SNAPSHOT
- TABLE 142. IBM CORPORATION: PRODUCT SEGMENTS
- TABLE 143. IBM CORPORATION: PRODUCT PORTFOLIO
- TABLE 144. IBM CORPORATION: KEY STRATERGIES
- TABLE 145. TREND MICRO INCORPORATED: KEY EXECUTIVES
- TABLE 146. TREND MICRO INCORPORATED: COMPANY SNAPSHOT
- TABLE 147. TREND MICRO INCORPORATED: SERVICE SEGMENTS
- TABLE 148. TREND MICRO INCORPORATED: PRODUCT PORTFOLIO
- TABLE 149. TREND MICRO INCORPORATED: KEY STRATERGIES
- TABLE 150. CISCO SYSTEMS, INC.: KEY EXECUTIVES
- TABLE 151. CISCO SYSTEMS, INC.: COMPANY SNAPSHOT
- TABLE 152. CISCO SYSTEMS, INC.: SERVICE SEGMENTS
- TABLE 153. CISCO SYSTEMS, INC.: PRODUCT PORTFOLIO
- TABLE 154. CISCO SYSTEMS, INC.: KEY STRATERGIES
- TABLE 155. FORCEPOINT: KEY EXECUTIVES
- TABLE 156. FORCEPOINT: COMPANY SNAPSHOT
- TABLE 157. FORCEPOINT: SERVICE SEGMENTS
- TABLE 158. FORCEPOINT: PRODUCT PORTFOLIO
- TABLE 159. FORCEPOINT: KEY STRATERGIES
LIST OF FIGURES
- FIGURE 01. SECURITY AS A SERVICE MARKET, 2022-2032
- FIGURE 02. SEGMENTATION OF SECURITY AS A SERVICE MARKET,2022-2032
- FIGURE 03. TOP IMPACTING FACTORS IN SECURITY AS A SERVICE MARKET (2022 TO 2032)
- FIGURE 04. TOP INVESTMENT POCKETS IN SECURITY AS A SERVICE MARKET (2023-2032)
- FIGURE 05. LOW BARGAINING POWER OF SUPPLIERS
- FIGURE 06. LOW THREAT OF NEW ENTRANTS
- FIGURE 07. LOW THREAT OF SUBSTITUTES
- FIGURE 08. LOW INTENSITY OF RIVALRY
- FIGURE 09. LOW BARGAINING POWER OF BUYERS
- FIGURE 10. GLOBAL SECURITY AS A SERVICE MARKET:DRIVERS, RESTRAINTS AND OPPORTUNITIES
- FIGURE 11. SECURITY AS A SERVICE MARKET, BY COMPONENT, 2022 AND 2032(%)
- FIGURE 12. COMPARATIVE SHARE ANALYSIS OF SECURITY AS A SERVICE MARKET FOR SOLUTION, BY COUNTRY 2022 AND 2032(%)
- FIGURE 13. COMPARATIVE SHARE ANALYSIS OF SECURITY AS A SERVICE MARKET FOR SERVICE, BY COUNTRY 2022 AND 2032(%)
- FIGURE 14. SECURITY AS A SERVICE MARKET, BY APPLICATION, 2022 AND 2032(%)
- FIGURE 15. COMPARATIVE SHARE ANALYSIS OF SECURITY AS A SERVICE MARKET FOR NETWORK SECURITY, BY COUNTRY 2022 AND 2032(%)
- FIGURE 16. COMPARATIVE SHARE ANALYSIS OF SECURITY AS A SERVICE MARKET FOR ENDPOINT SECURITY, BY COUNTRY 2022 AND 2032(%)
- FIGURE 17. COMPARATIVE SHARE ANALYSIS OF SECURITY AS A SERVICE MARKET FOR APPLICATION SECURITY, BY COUNTRY 2022 AND 2032(%)
- FIGURE 18. COMPARATIVE SHARE ANALYSIS OF SECURITY AS A SERVICE MARKET FOR CLOUD SECURITY, BY COUNTRY 2022 AND 2032(%)
- FIGURE 19. COMPARATIVE SHARE ANALYSIS OF SECURITY AS A SERVICE MARKET FOR OTHERS, BY COUNTRY 2022 AND 2032(%)
- FIGURE 20. SECURITY AS A SERVICE MARKET, BY ORGANIZATION SIZE, 2022 AND 2032(%)
- FIGURE 21. COMPARATIVE SHARE ANALYSIS OF SECURITY AS A SERVICE MARKET FOR LARGE ENTERPRISES, BY COUNTRY 2022 AND 2032(%)
- FIGURE 22. COMPARATIVE SHARE ANALYSIS OF SECURITY AS A SERVICE MARKET FOR SMALL AND MEDIUM-SIZED ENTERPRISES, BY COUNTRY 2022 AND 2032(%)
- FIGURE 23. SECURITY AS A SERVICE MARKET, BY INDUSTRY VERTICAL, 2022 AND 2032(%)
- FIGURE 24. COMPARATIVE SHARE ANALYSIS OF SECURITY AS A SERVICE MARKET FOR BFSI, BY COUNTRY 2022 AND 2032(%)
- FIGURE 25. COMPARATIVE SHARE ANALYSIS OF SECURITY AS A SERVICE MARKET FOR GOVERNMENT AND DEFENSE, BY COUNTRY 2022 AND 2032(%)
- FIGURE 26. COMPARATIVE SHARE ANALYSIS OF SECURITY AS A SERVICE MARKET FOR RETAIL AND E-COMMERCE, BY COUNTRY 2022 AND 2032(%)
- FIGURE 27. COMPARATIVE SHARE ANALYSIS OF SECURITY AS A SERVICE MARKET FOR HEALTHCARE AND LIFE SCIENCES, BY COUNTRY 2022 AND 2032(%)
- FIGURE 28. COMPARATIVE SHARE ANALYSIS OF SECURITY AS A SERVICE MARKET FOR IT AND TELECOM, BY COUNTRY 2022 AND 2032(%)
- FIGURE 29. COMPARATIVE SHARE ANALYSIS OF SECURITY AS A SERVICE MARKET FOR ENERGY AND UTILITIES, BY COUNTRY 2022 AND 2032(%)
- FIGURE 30. COMPARATIVE SHARE ANALYSIS OF SECURITY AS A SERVICE MARKET FOR MANUFACTURING, BY COUNTRY 2022 AND 2032(%)
- FIGURE 31. COMPARATIVE SHARE ANALYSIS OF SECURITY AS A SERVICE MARKET FOR OTHERS, BY COUNTRY 2022 AND 2032(%)
- FIGURE 32. SECURITY AS A SERVICE MARKET BY REGION, 2022 AND 2032(%)
- FIGURE 33. U.S. SECURITY AS A SERVICE MARKET, 2022-2032 ($MILLION)
- FIGURE 34. CANADA SECURITY AS A SERVICE MARKET, 2022-2032 ($MILLION)
- FIGURE 35. UK SECURITY AS A SERVICE MARKET, 2022-2032 ($MILLION)
- FIGURE 36. GERMANY SECURITY AS A SERVICE MARKET, 2022-2032 ($MILLION)
- FIGURE 37. FRANCE SECURITY AS A SERVICE MARKET, 2022-2032 ($MILLION)
- FIGURE 38. ITALY SECURITY AS A SERVICE MARKET, 2022-2032 ($MILLION)
- FIGURE 39. SPAIN SECURITY AS A SERVICE MARKET, 2022-2032 ($MILLION)
- FIGURE 40. REST OF EUROPE SECURITY AS A SERVICE MARKET, 2022-2032 ($MILLION)
- FIGURE 41. CHINA SECURITY AS A SERVICE MARKET, 2022-2032 ($MILLION)
- FIGURE 42. JAPAN SECURITY AS A SERVICE MARKET, 2022-2032 ($MILLION)
- FIGURE 43. INDIA SECURITY AS A SERVICE MARKET, 2022-2032 ($MILLION)
- FIGURE 44. AUSTRALIA SECURITY AS A SERVICE MARKET, 2022-2032 ($MILLION)
- FIGURE 45. SOUTH KOREA SECURITY AS A SERVICE MARKET, 2022-2032 ($MILLION)
- FIGURE 46. REST OF ASIA-PACIFIC SECURITY AS A SERVICE MARKET, 2022-2032 ($MILLION)
- FIGURE 47. LATIN AMERICA SECURITY AS A SERVICE MARKET, 2022-2032 ($MILLION)
- FIGURE 48. MIDDLE EAST SECURITY AS A SERVICE MARKET, 2022-2032 ($MILLION)
- FIGURE 49. AFRICA SECURITY AS A SERVICE MARKET, 2022-2032 ($MILLION)
- FIGURE 50. TOP WINNING STRATEGIES, BY YEAR (2021-2023)
- FIGURE 51. TOP WINNING STRATEGIES, BY DEVELOPMENT (2021-2023)
- FIGURE 52. TOP WINNING STRATEGIES, BY COMPANY (2021-2023)
- FIGURE 53. PRODUCT MAPPING OF TOP 10 PLAYERS
- FIGURE 54. COMPETITIVE DASHBOARD
- FIGURE 55. COMPETITIVE HEATMAP: SECURITY AS A SERVICE MARKET
- FIGURE 56. TOP PLAYER POSITIONING, 2022
- FIGURE 57. ORACLE CORPORATION: NET REVENUE, 2020-2022 ($MILLION)
- FIGURE 58. ORACLE CORPORATION: REVENUE SHARE BY SEGMENT, 2022 (%)
- FIGURE 59. ORACLE CORPORATION: REVENUE SHARE BY REGION, 2022 (%)
- FIGURE 60. QUALYS, INC.: NET REVENUE, 2020-2022 ($MILLION)
- FIGURE 61. QUALYS, INC.: REVENUE SHARE BY REGION, 2022 (%)
- FIGURE 62. OKTA: NET REVENUE, 2020-2022 ($MILLION)
- FIGURE 63. OKTA: REVENUE SHARE BY REGION, 2022 (%)
- FIGURE 64. MICROSOFT CORPORATION: NET REVENUE, 2020-2022 ($MILLION)
- FIGURE 65. MICROSOFT CORPORATION: RESEARCH & DEVELOPMENT EXPENDITURE, 2020-2022 ($MILLION)
- FIGURE 66. MICROSOFT CORPORATION: REVENUE SHARE BY SEGMENT, 2022 (%)
- FIGURE 67. MICROSOFT CORPORATION: REVENUE SHARE BY REGION, 2022 (%)
- FIGURE 68. IBM CORPORATION: NET REVENUE, 2020-2022 ($MILLION)
- FIGURE 69. IBM CORPORATION: RESEARCH & DEVELOPMENT EXPENDITURE, 2020-2022 ($MILLION)
- FIGURE 70. IBM CORPORATION: REVENUE SHARE BY SEGMENT, 2022 (%)
- FIGURE 71. IBM CORPORATION: REVENUE SHARE BY REGION, 2022 (%)
- FIGURE 72. TREND MICRO INCORPORATED: NET REVENUE, 2020-2022 ($MILLION)
- FIGURE 73. TREND MICRO INCORPORATED: REVENUE SHARE BY REGION, 2022 (%)
- FIGURE 74. CISCO SYSTEMS, INC.: NET REVENUE, 2020-2022 ($MILLION)
- FIGURE 75. CISCO SYSTEMS, INC.: RESEARCH & DEVELOPMENT EXPENDITURE, 2020-2022 ($MILLION)
- FIGURE 76. CISCO SYSTEMS, INC.: REVENUE SHARE BY SEGMENT, 2022 (%)
- FIGURE 77. CISCO SYSTEMS, INC.: REVENUE SHARE BY REGION, 2022 (%)

