
PUBLISHER: Allied Market Research | PRODUCT CODE: 1414932

PUBLISHER: Allied Market Research | PRODUCT CODE: 1414932
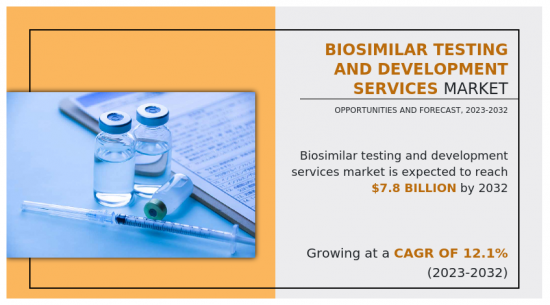
Biosimilar Testing and Development Services Market By Type, By End User : Global Opportunity Analysis and Industry Forecast, 2023-2032
According to a new report published by Allied Market Research, titled, "Biosimilar Testing and Development Services Market," The biosimilar testing and development services market was valued at $2.5 billion in 2022, and is estimated to reach $7.8 billion by 2032, growing at a CAGR of 12.1% from 2023 to 2032.
In addition, biologics drugs, which are highly effective in treating various chronic and life-threatening diseases, often come with high price tags, making them inaccessible to a large segment of the population. However, biosimilars, which are comparable versions of reference biologics, present a promising solution to this problem. Biosimilar drugs undergo a rigorous development process to demonstrate dissimilarity to the reference product in terms of quality, safety, and efficacy. Once approved, biosimilars can offer significant cost savings as compared to the original biologic drugs. According to Association for Accessible Medicines (U.S.), in 2021, biosimilars generated $7 billion in savings for patients and the healthcare system. This cost advantage has the potential to drive healthcare expenditure, making essential treatments more accessible to patients while also reducing the financial burden on healthcare systems. Rise in demand for biosimilar product results in demand for services that facilitate the testing and development of biosimilars.
However, stringent regulatory requirements might act as a restraint for the growth of the market. However, patent expiration of biological drugs is expected to serve as a growth opportunity in the market.
The biosimilar testing and development services market is segmented on the basis of type and end user, and region. By type, the market is categorized into pharmacokinetics, immunogenicity, and others. The others include, ligand binding assay, biomarker, and stability testing. By end user, the market is categorized into pharmaceutical and biopharmaceutical companies, contract research organizations, and others. Others include contract development and manufacturing organization, independent lab, and regulatory bodies. Region-wise, the market is analyzed across North America (the U.S., Canada, and Mexico), Europe (Germany, France, the UK, Italy, Spain, and rest of Europe), Asia-Pacific (Japan, China, Australia, India, South Korea, and rest of Asia-Pacific), and LAMEA (Brazil, South Africa, Saudi Arabia, and rest of LAMEA). Major key players that operate in the global biosimilar testing and development services market are Charles River Laboratories, Element Materials Technology, Intertek Group plc, Pacific biolabs, Inc, Profacgen Technologies Inc, Sartorius AG, SGS, BioPharmaSpec Ltd., Veeda Clinical Research Pvt. Ltd, and Eurofins Scientific SE.
Key Benefits For Stakeholders
- This report provides a quantitative analysis of the market segments, current trends, estimations, and dynamics of the biosimilar testing and development services market analysis from 2022 to 2032 to identify the prevailing biosimilar testing and development services market opportunities.
- The market research is offered along with information related to key drivers, restraints, and opportunities.
- Porter's five forces analysis highlights the potency of buyers and suppliers to enable stakeholders make profit-oriented business decisions and strengthen their supplier-buyer network.
- In-depth analysis of the biosimilar testing and development services market segmentation assists to determine the prevailing market opportunities.
- Major countries in each region are mapped according to their revenue contribution to the global market.
- Market player positioning facilitates benchmarking and provides a clear understanding of the present position of the market players.
- The report includes the analysis of the regional as well as global biosimilar testing and development services market trends, key players, market segments, application areas, and market growth strategies.
Additional benefits you will get with this purchase are:
- Quarterly Update and* (only available with a corporate license, on listed price)
- 5 additional Company Profile of client Choice pre- or Post-purchase, as a free update.
- Free Upcoming Version on the Purchase of Five and Enterprise User License.
- 16 analyst hours of support* (post-purchase, if you find additional data requirements upon review of the report, you may receive support amounting to 16 analyst hours to solve questions, and post-sale queries)
- 15% Free Customization* (in case the scope or segment of the report does not match your requirements, 15% is equivalent to 3 working days of free work, applicable once)
- Free data Pack on the Five and Enterprise User License. (Excel version of the report)
- Free Updated report if the report is 6-12 months old or older.
- 24-hour priority response*
- Free Industry updates and white papers.
- Possible Customization with this report (with additional cost and timeline, please talk to the sales executive to know more)
- Additional company profiles with specific to client's interest
- Expanded list for Company Profiles
- Historic market data
Key Market Segments
By Type
- Pharmacokinetics Assay
- Immunogenicity Testing
- Others
By End User
- Pharmaceutical and Biopharmaceutical Companies
- Contract Research Organizations
- Others
By Region
- North America
- U.S.
- Canada
- Mexico
- Europe
- Germany
- France
- UK
- Italy
- Spain
- Rest of Europe
- Asia-Pacific
- Japan
- China
- India
- Australia
- South Korea
- Rest of Asia-Pacific
- LAMEA
- Brazil
- Saudi Arabia
- South Africa
- Rest of LAMEA
Key Market Players:
- Sartorius AG
- Pacific Biolabs, Inc.
- BioPharmaSpec Ltd.
- Charles River Laboratories
- Intertek Group plc
- SGS
- Veeda Clinical Research Pvt. Ltd.
- Eurofins Scientific SE
- Profacgen Technologies Inc.
- Element Materials Technology
TABLE OF CONTENTS
CHAPTER 1: INTRODUCTION
- 1.1. Report description
- 1.2. Key market segments
- 1.3. Key benefits to the stakeholders
- 1.4. Research methodology
- 1.4.1. Primary research
- 1.4.2. Secondary research
- 1.4.3. Analyst tools and models
CHAPTER 2: EXECUTIVE SUMMARY
- 2.1. CXO Perspective
CHAPTER 3: MARKET OVERVIEW
- 3.1. Market definition and scope
- 3.2. Key findings
- 3.2.1. Top impacting factors
- 3.2.2. Top investment pockets
- 3.3. Porter's five forces analysis
- 3.3.1. Low bargaining power of suppliers
- 3.3.2. Low threat of new entrants
- 3.3.3. Low threat of substitutes
- 3.3.4. Low intensity of rivalry
- 3.3.5. Low bargaining power of buyers
- 3.4. Market dynamics
- 3.4.1. Drivers
- 3.4.1.1. Surge in need of biosimilar testing facilities.
- 3.4.1.2. Rise in outsourcing of preclinical, clinical, and laboratory testing services by pharma and biotech companies
- 3.4.2. Restraints
- 3.4.2.1. Stringent regulatory requirements.
- 3.4.3. Opportunities
- 3.4.3.1. Patent expirations of biologic drugs.
- 3.4.1. Drivers
CHAPTER 4: BIOSIMILAR TESTING AND DEVELOPMENT SERVICES MARKET, BY TYPE
- 4.1. Overview
- 4.1.1. Market size and forecast
- 4.2. Pharmacokinetics Assay
- 4.2.1. Key market trends, growth factors and opportunities
- 4.2.2. Market size and forecast, by region
- 4.2.3. Market share analysis by country
- 4.3. Immunogenicity Testing
- 4.3.1. Key market trends, growth factors and opportunities
- 4.3.2. Market size and forecast, by region
- 4.3.3. Market share analysis by country
- 4.4. Others
- 4.4.1. Key market trends, growth factors and opportunities
- 4.4.2. Market size and forecast, by region
- 4.4.3. Market share analysis by country
CHAPTER 5: BIOSIMILAR TESTING AND DEVELOPMENT SERVICES MARKET, BY END USER
- 5.1. Overview
- 5.1.1. Market size and forecast
- 5.2. Pharmaceutical and Biopharmaceutical Companies
- 5.2.1. Key market trends, growth factors and opportunities
- 5.2.2. Market size and forecast, by region
- 5.2.3. Market share analysis by country
- 5.3. Contract Research Organizations
- 5.3.1. Key market trends, growth factors and opportunities
- 5.3.2. Market size and forecast, by region
- 5.3.3. Market share analysis by country
- 5.4. Others
- 5.4.1. Key market trends, growth factors and opportunities
- 5.4.2. Market size and forecast, by region
- 5.4.3. Market share analysis by country
CHAPTER 6: BIOSIMILAR TESTING AND DEVELOPMENT SERVICES MARKET, BY REGION
- 6.1. Overview
- 6.1.1. Market size and forecast By Region
- 6.2. North America
- 6.2.1. Key market trends, growth factors and opportunities
- 6.2.2. Market size and forecast, by Type
- 6.2.3. Market size and forecast, by End User
- 6.2.4. Market size and forecast, by country
- 6.2.4.1. U.S.
- 6.2.4.1.1. Market size and forecast, by Type
- 6.2.4.1.2. Market size and forecast, by End User
- 6.2.4.2. Canada
- 6.2.4.2.1. Market size and forecast, by Type
- 6.2.4.2.2. Market size and forecast, by End User
- 6.2.4.3. Mexico
- 6.2.4.3.1. Market size and forecast, by Type
- 6.2.4.3.2. Market size and forecast, by End User
- 6.3. Europe
- 6.3.1. Key market trends, growth factors and opportunities
- 6.3.2. Market size and forecast, by Type
- 6.3.3. Market size and forecast, by End User
- 6.3.4. Market size and forecast, by country
- 6.3.4.1. Germany
- 6.3.4.1.1. Market size and forecast, by Type
- 6.3.4.1.2. Market size and forecast, by End User
- 6.3.4.2. France
- 6.3.4.2.1. Market size and forecast, by Type
- 6.3.4.2.2. Market size and forecast, by End User
- 6.3.4.3. UK
- 6.3.4.3.1. Market size and forecast, by Type
- 6.3.4.3.2. Market size and forecast, by End User
- 6.3.4.4. Italy
- 6.3.4.4.1. Market size and forecast, by Type
- 6.3.4.4.2. Market size and forecast, by End User
- 6.3.4.5. Spain
- 6.3.4.5.1. Market size and forecast, by Type
- 6.3.4.5.2. Market size and forecast, by End User
- 6.3.4.6. Rest of Europe
- 6.3.4.6.1. Market size and forecast, by Type
- 6.3.4.6.2. Market size and forecast, by End User
- 6.4. Asia-Pacific
- 6.4.1. Key market trends, growth factors and opportunities
- 6.4.2. Market size and forecast, by Type
- 6.4.3. Market size and forecast, by End User
- 6.4.4. Market size and forecast, by country
- 6.4.4.1. Japan
- 6.4.4.1.1. Market size and forecast, by Type
- 6.4.4.1.2. Market size and forecast, by End User
- 6.4.4.2. China
- 6.4.4.2.1. Market size and forecast, by Type
- 6.4.4.2.2. Market size and forecast, by End User
- 6.4.4.3. India
- 6.4.4.3.1. Market size and forecast, by Type
- 6.4.4.3.2. Market size and forecast, by End User
- 6.4.4.4. Australia
- 6.4.4.4.1. Market size and forecast, by Type
- 6.4.4.4.2. Market size and forecast, by End User
- 6.4.4.5. South Korea
- 6.4.4.5.1. Market size and forecast, by Type
- 6.4.4.5.2. Market size and forecast, by End User
- 6.4.4.6. Rest of Asia-Pacific
- 6.4.4.6.1. Market size and forecast, by Type
- 6.4.4.6.2. Market size and forecast, by End User
- 6.5. LAMEA
- 6.5.1. Key market trends, growth factors and opportunities
- 6.5.2. Market size and forecast, by Type
- 6.5.3. Market size and forecast, by End User
- 6.5.4. Market size and forecast, by country
- 6.5.4.1. Brazil
- 6.5.4.1.1. Market size and forecast, by Type
- 6.5.4.1.2. Market size and forecast, by End User
- 6.5.4.2. Saudi Arabia
- 6.5.4.2.1. Market size and forecast, by Type
- 6.5.4.2.2. Market size and forecast, by End User
- 6.5.4.3. South Africa
- 6.5.4.3.1. Market size and forecast, by Type
- 6.5.4.3.2. Market size and forecast, by End User
- 6.5.4.4. Rest of LAMEA
- 6.5.4.4.1. Market size and forecast, by Type
- 6.5.4.4.2. Market size and forecast, by End User
CHAPTER 7: COMPETITIVE LANDSCAPE
- 7.1. Introduction
- 7.2. Top winning strategies
- 7.3. Product mapping of top 10 player
- 7.4. Competitive dashboard
- 7.5. Competitive heatmap
- 7.6. Top player positioning, 2022
CHAPTER 8: COMPANY PROFILES
- 8.1. BioPharmaSpec Ltd.
- 8.1.1. Company overview
- 8.1.2. Key executives
- 8.1.3. Company snapshot
- 8.1.4. Operating business segments
- 8.1.5. Product portfolio
- 8.2. Charles River Laboratories
- 8.2.1. Company overview
- 8.2.2. Key executives
- 8.2.3. Company snapshot
- 8.2.4. Operating business segments
- 8.2.5. Product portfolio
- 8.2.6. Business performance
- 8.3. Element Materials Technology
- 8.3.1. Company overview
- 8.3.2. Key executives
- 8.3.3. Company snapshot
- 8.3.4. Operating business segments
- 8.3.5. Product portfolio
- 8.4. Eurofins Scientific SE
- 8.4.1. Company overview
- 8.4.2. Key executives
- 8.4.3. Company snapshot
- 8.4.4. Operating business segments
- 8.4.5. Product portfolio
- 8.4.6. Business performance
- 8.4.7. Key strategic moves and developments
- 8.5. Intertek Group plc
- 8.5.1. Company overview
- 8.5.2. Key executives
- 8.5.3. Company snapshot
- 8.5.4. Operating business segments
- 8.5.5. Product portfolio
- 8.5.6. Business performance
- 8.6. Pacific Biolabs, Inc.
- 8.6.1. Company overview
- 8.6.2. Key executives
- 8.6.3. Company snapshot
- 8.6.4. Operating business segments
- 8.6.5. Product portfolio
- 8.6.6. Key strategic moves and developments
- 8.7. Profacgen Technologies Inc.
- 8.7.1. Company overview
- 8.7.2. Key executives
- 8.7.3. Company snapshot
- 8.7.4. Operating business segments
- 8.7.5. Product portfolio
- 8.8. Sartorius AG
- 8.8.1. Company overview
- 8.8.2. Key executives
- 8.8.3. Company snapshot
- 8.8.4. Operating business segments
- 8.8.5. Product portfolio
- 8.8.6. Business performance
- 8.9. SGS
- 8.9.1. Company overview
- 8.9.2. Key executives
- 8.9.3. Company snapshot
- 8.9.4. Operating business segments
- 8.9.5. Product portfolio
- 8.9.6. Business performance
- 8.10. Veeda Clinical Research Pvt. Ltd.
- 8.10.1. Company overview
- 8.10.2. Key executives
- 8.10.3. Company snapshot
- 8.10.4. Operating business segments
- 8.10.5. Product portfolio
LIST OF TABLES
- TABLE 01. GLOBAL BIOSIMILAR TESTING AND DEVELOPMENT SERVICES MARKET, BY TYPE, 2022-2032 ($MILLION)
- TABLE 02. BIOSIMILAR TESTING AND DEVELOPMENT SERVICES MARKET FOR PHARMACOKINETICS ASSAY, BY REGION, 2022-2032 ($MILLION)
- TABLE 03. BIOSIMILAR TESTING AND DEVELOPMENT SERVICES MARKET FOR IMMUNOGENICITY TESTING, BY REGION, 2022-2032 ($MILLION)
- TABLE 04. BIOSIMILAR TESTING AND DEVELOPMENT SERVICES MARKET FOR OTHERS, BY REGION, 2022-2032 ($MILLION)
- TABLE 05. GLOBAL BIOSIMILAR TESTING AND DEVELOPMENT SERVICES MARKET, BY END USER, 2022-2032 ($MILLION)
- TABLE 06. BIOSIMILAR TESTING AND DEVELOPMENT SERVICES MARKET FOR PHARMACEUTICAL AND BIOPHARMACEUTICAL COMPANIES, BY REGION, 2022-2032 ($MILLION)
- TABLE 07. BIOSIMILAR TESTING AND DEVELOPMENT SERVICES MARKET FOR CONTRACT RESEARCH ORGANIZATIONS, BY REGION, 2022-2032 ($MILLION)
- TABLE 08. BIOSIMILAR TESTING AND DEVELOPMENT SERVICES MARKET FOR OTHERS, BY REGION, 2022-2032 ($MILLION)
- TABLE 09. BIOSIMILAR TESTING AND DEVELOPMENT SERVICES MARKET, BY REGION, 2022-2032 ($MILLION)
- TABLE 10. NORTH AMERICA BIOSIMILAR TESTING AND DEVELOPMENT SERVICES MARKET, BY TYPE, 2022-2032 ($MILLION)
- TABLE 11. NORTH AMERICA BIOSIMILAR TESTING AND DEVELOPMENT SERVICES MARKET, BY END USER, 2022-2032 ($MILLION)
- TABLE 12. NORTH AMERICA BIOSIMILAR TESTING AND DEVELOPMENT SERVICES MARKET, BY COUNTRY, 2022-2032 ($MILLION)
- TABLE 13. U.S. BIOSIMILAR TESTING AND DEVELOPMENT SERVICES MARKET, BY TYPE, 2022-2032 ($MILLION)
- TABLE 14. U.S. BIOSIMILAR TESTING AND DEVELOPMENT SERVICES MARKET, BY END USER, 2022-2032 ($MILLION)
- TABLE 15. CANADA BIOSIMILAR TESTING AND DEVELOPMENT SERVICES MARKET, BY TYPE, 2022-2032 ($MILLION)
- TABLE 16. CANADA BIOSIMILAR TESTING AND DEVELOPMENT SERVICES MARKET, BY END USER, 2022-2032 ($MILLION)
- TABLE 17. MEXICO BIOSIMILAR TESTING AND DEVELOPMENT SERVICES MARKET, BY TYPE, 2022-2032 ($MILLION)
- TABLE 18. MEXICO BIOSIMILAR TESTING AND DEVELOPMENT SERVICES MARKET, BY END USER, 2022-2032 ($MILLION)
- TABLE 19. EUROPE BIOSIMILAR TESTING AND DEVELOPMENT SERVICES MARKET, BY TYPE, 2022-2032 ($MILLION)
- TABLE 20. EUROPE BIOSIMILAR TESTING AND DEVELOPMENT SERVICES MARKET, BY END USER, 2022-2032 ($MILLION)
- TABLE 21. EUROPE BIOSIMILAR TESTING AND DEVELOPMENT SERVICES MARKET, BY COUNTRY, 2022-2032 ($MILLION)
- TABLE 22. GERMANY BIOSIMILAR TESTING AND DEVELOPMENT SERVICES MARKET, BY TYPE, 2022-2032 ($MILLION)
- TABLE 23. GERMANY BIOSIMILAR TESTING AND DEVELOPMENT SERVICES MARKET, BY END USER, 2022-2032 ($MILLION)
- TABLE 24. FRANCE BIOSIMILAR TESTING AND DEVELOPMENT SERVICES MARKET, BY TYPE, 2022-2032 ($MILLION)
- TABLE 25. FRANCE BIOSIMILAR TESTING AND DEVELOPMENT SERVICES MARKET, BY END USER, 2022-2032 ($MILLION)
- TABLE 26. UK BIOSIMILAR TESTING AND DEVELOPMENT SERVICES MARKET, BY TYPE, 2022-2032 ($MILLION)
- TABLE 27. UK BIOSIMILAR TESTING AND DEVELOPMENT SERVICES MARKET, BY END USER, 2022-2032 ($MILLION)
- TABLE 28. ITALY BIOSIMILAR TESTING AND DEVELOPMENT SERVICES MARKET, BY TYPE, 2022-2032 ($MILLION)
- TABLE 29. ITALY BIOSIMILAR TESTING AND DEVELOPMENT SERVICES MARKET, BY END USER, 2022-2032 ($MILLION)
- TABLE 30. SPAIN BIOSIMILAR TESTING AND DEVELOPMENT SERVICES MARKET, BY TYPE, 2022-2032 ($MILLION)
- TABLE 31. SPAIN BIOSIMILAR TESTING AND DEVELOPMENT SERVICES MARKET, BY END USER, 2022-2032 ($MILLION)
- TABLE 32. REST OF EUROPE BIOSIMILAR TESTING AND DEVELOPMENT SERVICES MARKET, BY TYPE, 2022-2032 ($MILLION)
- TABLE 33. REST OF EUROPE BIOSIMILAR TESTING AND DEVELOPMENT SERVICES MARKET, BY END USER, 2022-2032 ($MILLION)
- TABLE 34. ASIA-PACIFIC BIOSIMILAR TESTING AND DEVELOPMENT SERVICES MARKET, BY TYPE, 2022-2032 ($MILLION)
- TABLE 35. ASIA-PACIFIC BIOSIMILAR TESTING AND DEVELOPMENT SERVICES MARKET, BY END USER, 2022-2032 ($MILLION)
- TABLE 36. ASIA-PACIFIC BIOSIMILAR TESTING AND DEVELOPMENT SERVICES MARKET, BY COUNTRY, 2022-2032 ($MILLION)
- TABLE 37. JAPAN BIOSIMILAR TESTING AND DEVELOPMENT SERVICES MARKET, BY TYPE, 2022-2032 ($MILLION)
- TABLE 38. JAPAN BIOSIMILAR TESTING AND DEVELOPMENT SERVICES MARKET, BY END USER, 2022-2032 ($MILLION)
- TABLE 39. CHINA BIOSIMILAR TESTING AND DEVELOPMENT SERVICES MARKET, BY TYPE, 2022-2032 ($MILLION)
- TABLE 40. CHINA BIOSIMILAR TESTING AND DEVELOPMENT SERVICES MARKET, BY END USER, 2022-2032 ($MILLION)
- TABLE 41. INDIA BIOSIMILAR TESTING AND DEVELOPMENT SERVICES MARKET, BY TYPE, 2022-2032 ($MILLION)
- TABLE 42. INDIA BIOSIMILAR TESTING AND DEVELOPMENT SERVICES MARKET, BY END USER, 2022-2032 ($MILLION)
- TABLE 43. AUSTRALIA BIOSIMILAR TESTING AND DEVELOPMENT SERVICES MARKET, BY TYPE, 2022-2032 ($MILLION)
- TABLE 44. AUSTRALIA BIOSIMILAR TESTING AND DEVELOPMENT SERVICES MARKET, BY END USER, 2022-2032 ($MILLION)
- TABLE 45. SOUTH KOREA BIOSIMILAR TESTING AND DEVELOPMENT SERVICES MARKET, BY TYPE, 2022-2032 ($MILLION)
- TABLE 46. SOUTH KOREA BIOSIMILAR TESTING AND DEVELOPMENT SERVICES MARKET, BY END USER, 2022-2032 ($MILLION)
- TABLE 47. REST OF ASIA-PACIFIC BIOSIMILAR TESTING AND DEVELOPMENT SERVICES MARKET, BY TYPE, 2022-2032 ($MILLION)
- TABLE 48. REST OF ASIA-PACIFIC BIOSIMILAR TESTING AND DEVELOPMENT SERVICES MARKET, BY END USER, 2022-2032 ($MILLION)
- TABLE 49. LAMEA BIOSIMILAR TESTING AND DEVELOPMENT SERVICES MARKET, BY TYPE, 2022-2032 ($MILLION)
- TABLE 50. LAMEA BIOSIMILAR TESTING AND DEVELOPMENT SERVICES MARKET, BY END USER, 2022-2032 ($MILLION)
- TABLE 51. LAMEA BIOSIMILAR TESTING AND DEVELOPMENT SERVICES MARKET, BY COUNTRY, 2022-2032 ($MILLION)
- TABLE 52. BRAZIL BIOSIMILAR TESTING AND DEVELOPMENT SERVICES MARKET, BY TYPE, 2022-2032 ($MILLION)
- TABLE 53. BRAZIL BIOSIMILAR TESTING AND DEVELOPMENT SERVICES MARKET, BY END USER, 2022-2032 ($MILLION)
- TABLE 54. SAUDI ARABIA BIOSIMILAR TESTING AND DEVELOPMENT SERVICES MARKET, BY TYPE, 2022-2032 ($MILLION)
- TABLE 55. SAUDI ARABIA BIOSIMILAR TESTING AND DEVELOPMENT SERVICES MARKET, BY END USER, 2022-2032 ($MILLION)
- TABLE 56. SOUTH AFRICA BIOSIMILAR TESTING AND DEVELOPMENT SERVICES MARKET, BY TYPE, 2022-2032 ($MILLION)
- TABLE 57. SOUTH AFRICA BIOSIMILAR TESTING AND DEVELOPMENT SERVICES MARKET, BY END USER, 2022-2032 ($MILLION)
- TABLE 58. REST OF LAMEA BIOSIMILAR TESTING AND DEVELOPMENT SERVICES MARKET, BY TYPE, 2022-2032 ($MILLION)
- TABLE 59. REST OF LAMEA BIOSIMILAR TESTING AND DEVELOPMENT SERVICES MARKET, BY END USER, 2022-2032 ($MILLION)
- TABLE 60. BIOPHARMASPEC LTD.: KEY EXECUTIVES
- TABLE 61. BIOPHARMASPEC LTD.: COMPANY SNAPSHOT
- TABLE 62. BIOPHARMASPEC LTD.: SERVICE SEGMENTS
- TABLE 63. BIOPHARMASPEC LTD.: PRODUCT PORTFOLIO
- TABLE 64. CHARLES RIVER LABORATORIES: KEY EXECUTIVES
- TABLE 65. CHARLES RIVER LABORATORIES: COMPANY SNAPSHOT
- TABLE 66. CHARLES RIVER LABORATORIES: PRODUCT SEGMENTS
- TABLE 67. CHARLES RIVER LABORATORIES: SERVICE SEGMENTS
- TABLE 68. CHARLES RIVER LABORATORIES: PRODUCT PORTFOLIO
- TABLE 69. ELEMENT MATERIALS TECHNOLOGY: KEY EXECUTIVES
- TABLE 70. ELEMENT MATERIALS TECHNOLOGY: COMPANY SNAPSHOT
- TABLE 71. ELEMENT MATERIALS TECHNOLOGY: SERVICE SEGMENTS
- TABLE 72. ELEMENT MATERIALS TECHNOLOGY: PRODUCT PORTFOLIO
- TABLE 73. EUROFINS SCIENTIFIC SE: KEY EXECUTIVES
- TABLE 74. EUROFINS SCIENTIFIC SE: COMPANY SNAPSHOT
- TABLE 75. EUROFINS SCIENTIFIC SE: SERVICE SEGMENTS
- TABLE 76. EUROFINS SCIENTIFIC SE: PRODUCT PORTFOLIO
- TABLE 77. EUROFINS SCIENTIFIC SE: KEY STRATERGIES
- TABLE 78. INTERTEK GROUP PLC: KEY EXECUTIVES
- TABLE 79. INTERTEK GROUP PLC: COMPANY SNAPSHOT
- TABLE 80. INTERTEK GROUP PLC: PRODUCT SEGMENTS
- TABLE 81. INTERTEK GROUP PLC: SERVICE SEGMENTS
- TABLE 82. INTERTEK GROUP PLC: PRODUCT PORTFOLIO
- TABLE 83. PACIFIC BIOLABS, INC.: KEY EXECUTIVES
- TABLE 84. PACIFIC BIOLABS, INC.: COMPANY SNAPSHOT
- TABLE 85. PACIFIC BIOLABS, INC.: SERVICE SEGMENTS
- TABLE 86. PACIFIC BIOLABS, INC.: PRODUCT PORTFOLIO
- TABLE 87. PACIFIC BIOLABS, INC.: KEY STRATERGIES
- TABLE 88. PROFACGEN TECHNOLOGIES INC.: KEY EXECUTIVES
- TABLE 89. PROFACGEN TECHNOLOGIES INC.: COMPANY SNAPSHOT
- TABLE 90. PROFACGEN TECHNOLOGIES INC.: PRODUCT SEGMENTS
- TABLE 91. PROFACGEN TECHNOLOGIES INC.: SERVICE SEGMENTS
- TABLE 92. PROFACGEN TECHNOLOGIES INC.: PRODUCT PORTFOLIO
- TABLE 93. SARTORIUS AG: KEY EXECUTIVES
- TABLE 94. SARTORIUS AG: COMPANY SNAPSHOT
- TABLE 95. SARTORIUS AG: PRODUCT SEGMENTS
- TABLE 96. SARTORIUS AG: PRODUCT PORTFOLIO
- TABLE 97. SGS: KEY EXECUTIVES
- TABLE 98. SGS: COMPANY SNAPSHOT
- TABLE 99. SGS: PRODUCT SEGMENTS
- TABLE 100. SGS: SERVICE SEGMENTS
- TABLE 101. SGS: PRODUCT PORTFOLIO
- TABLE 102. VEEDA CLINICAL RESEARCH PVT. LTD.: KEY EXECUTIVES
- TABLE 103. VEEDA CLINICAL RESEARCH PVT. LTD.: COMPANY SNAPSHOT
- TABLE 104. VEEDA CLINICAL RESEARCH PVT. LTD.: SERVICE SEGMENTS
- TABLE 105. VEEDA CLINICAL RESEARCH PVT. LTD.: PRODUCT PORTFOLIO
LIST OF FIGURES
- FIGURE 01. BIOSIMILAR TESTING AND DEVELOPMENT SERVICES MARKET, 2022-2032
- FIGURE 02. SEGMENTATION OF BIOSIMILAR TESTING AND DEVELOPMENT SERVICES MARKET,2022-2032
- FIGURE 03. TOP IMPACTING FACTORS IN BIOSIMILAR TESTING AND DEVELOPMENT SERVICES MARKET (2022 TO 2032)
- FIGURE 04. TOP INVESTMENT POCKETS IN BIOSIMILAR TESTING AND DEVELOPMENT SERVICES MARKET (2023-2032)
- FIGURE 05. LOW BARGAINING POWER OF SUPPLIERS
- FIGURE 06. LOW THREAT OF NEW ENTRANTS
- FIGURE 07. LOW THREAT OF SUBSTITUTES
- FIGURE 08. LOW INTENSITY OF RIVALRY
- FIGURE 09. LOW BARGAINING POWER OF BUYERS
- FIGURE 10. GLOBAL BIOSIMILAR TESTING AND DEVELOPMENT SERVICES MARKET:DRIVERS, RESTRAINTS AND OPPORTUNITIES
- FIGURE 11. BIOSIMILAR TESTING AND DEVELOPMENT SERVICES MARKET, BY TYPE, 2022 AND 2032(%)
- FIGURE 12. COMPARATIVE SHARE ANALYSIS OF BIOSIMILAR TESTING AND DEVELOPMENT SERVICES MARKET FOR PHARMACOKINETICS ASSAY, BY COUNTRY 2022 AND 2032(%)
- FIGURE 13. COMPARATIVE SHARE ANALYSIS OF BIOSIMILAR TESTING AND DEVELOPMENT SERVICES MARKET FOR IMMUNOGENICITY TESTING, BY COUNTRY 2022 AND 2032(%)
- FIGURE 14. COMPARATIVE SHARE ANALYSIS OF BIOSIMILAR TESTING AND DEVELOPMENT SERVICES MARKET FOR OTHERS, BY COUNTRY 2022 AND 2032(%)
- FIGURE 15. BIOSIMILAR TESTING AND DEVELOPMENT SERVICES MARKET, BY END USER, 2022 AND 2032(%)
- FIGURE 16. COMPARATIVE SHARE ANALYSIS OF BIOSIMILAR TESTING AND DEVELOPMENT SERVICES MARKET FOR PHARMACEUTICAL AND BIOPHARMACEUTICAL COMPANIES, BY COUNTRY 2022 AND 2032(%)
- FIGURE 17. COMPARATIVE SHARE ANALYSIS OF BIOSIMILAR TESTING AND DEVELOPMENT SERVICES MARKET FOR CONTRACT RESEARCH ORGANIZATIONS, BY COUNTRY 2022 AND 2032(%)
- FIGURE 18. COMPARATIVE SHARE ANALYSIS OF BIOSIMILAR TESTING AND DEVELOPMENT SERVICES MARKET FOR OTHERS, BY COUNTRY 2022 AND 2032(%)
- FIGURE 19. BIOSIMILAR TESTING AND DEVELOPMENT SERVICES MARKET BY REGION, 2022 AND 2032(%)
- FIGURE 20. U.S. BIOSIMILAR TESTING AND DEVELOPMENT SERVICES MARKET, 2022-2032 ($MILLION)
- FIGURE 21. CANADA BIOSIMILAR TESTING AND DEVELOPMENT SERVICES MARKET, 2022-2032 ($MILLION)
- FIGURE 22. MEXICO BIOSIMILAR TESTING AND DEVELOPMENT SERVICES MARKET, 2022-2032 ($MILLION)
- FIGURE 23. GERMANY BIOSIMILAR TESTING AND DEVELOPMENT SERVICES MARKET, 2022-2032 ($MILLION)
- FIGURE 24. FRANCE BIOSIMILAR TESTING AND DEVELOPMENT SERVICES MARKET, 2022-2032 ($MILLION)
- FIGURE 25. UK BIOSIMILAR TESTING AND DEVELOPMENT SERVICES MARKET, 2022-2032 ($MILLION)
- FIGURE 26. ITALY BIOSIMILAR TESTING AND DEVELOPMENT SERVICES MARKET, 2022-2032 ($MILLION)
- FIGURE 27. SPAIN BIOSIMILAR TESTING AND DEVELOPMENT SERVICES MARKET, 2022-2032 ($MILLION)
- FIGURE 28. REST OF EUROPE BIOSIMILAR TESTING AND DEVELOPMENT SERVICES MARKET, 2022-2032 ($MILLION)
- FIGURE 29. JAPAN BIOSIMILAR TESTING AND DEVELOPMENT SERVICES MARKET, 2022-2032 ($MILLION)
- FIGURE 30. CHINA BIOSIMILAR TESTING AND DEVELOPMENT SERVICES MARKET, 2022-2032 ($MILLION)
- FIGURE 31. INDIA BIOSIMILAR TESTING AND DEVELOPMENT SERVICES MARKET, 2022-2032 ($MILLION)
- FIGURE 32. AUSTRALIA BIOSIMILAR TESTING AND DEVELOPMENT SERVICES MARKET, 2022-2032 ($MILLION)
- FIGURE 33. SOUTH KOREA BIOSIMILAR TESTING AND DEVELOPMENT SERVICES MARKET, 2022-2032 ($MILLION)
- FIGURE 34. REST OF ASIA-PACIFIC BIOSIMILAR TESTING AND DEVELOPMENT SERVICES MARKET, 2022-2032 ($MILLION)
- FIGURE 35. BRAZIL BIOSIMILAR TESTING AND DEVELOPMENT SERVICES MARKET, 2022-2032 ($MILLION)
- FIGURE 36. SAUDI ARABIA BIOSIMILAR TESTING AND DEVELOPMENT SERVICES MARKET, 2022-2032 ($MILLION)
- FIGURE 37. SOUTH AFRICA BIOSIMILAR TESTING AND DEVELOPMENT SERVICES MARKET, 2022-2032 ($MILLION)
- FIGURE 38. REST OF LAMEA BIOSIMILAR TESTING AND DEVELOPMENT SERVICES MARKET, 2022-2032 ($MILLION)
- FIGURE 39. TOP WINNING STRATEGIES, BY YEAR (2022-2023)
- FIGURE 40. TOP WINNING STRATEGIES, BY DEVELOPMENT (2022-2023)
- FIGURE 41. TOP WINNING STRATEGIES, BY COMPANY (2022-2023)
- FIGURE 42. PRODUCT MAPPING OF TOP 10 PLAYERS
- FIGURE 43. COMPETITIVE DASHBOARD
- FIGURE 44. COMPETITIVE HEATMAP: BIOSIMILAR TESTING AND DEVELOPMENT SERVICES MARKET
- FIGURE 45. TOP PLAYER POSITIONING, 2022
- FIGURE 46. CHARLES RIVER LABORATORIES: NET REVENUE, 2020-2022 ($MILLION)
- FIGURE 47. CHARLES RIVER LABORATORIES: REVENUE SHARE BY SEGMENT, 2022 (%)
- FIGURE 48. CHARLES RIVER LABORATORIES: REVENUE SHARE BY REGION, 2022 (%)
- FIGURE 49. EUROFINS SCIENTIFIC SE: NET REVENUE, 2020-2022 ($MILLION)
- FIGURE 50. EUROFINS SCIENTIFIC SE: REVENUE SHARE BY SEGMENT, 2022 (%)
- FIGURE 51. INTERTEK GROUP PLC: NET REVENUE, 2020-2022 ($MILLION)
- FIGURE 52. INTERTEK GROUP PLC: REVENUE SHARE BY SEGMENT, 2022 (%)
- FIGURE 53. INTERTEK GROUP PLC: REVENUE SHARE BY REGION, 2022 (%)
- FIGURE 54. SARTORIUS AG: NET SALES, 2020-2022 ($MILLION)
- FIGURE 55. SARTORIUS AG: REVENUE SHARE BY SEGMENT, 2022 (%)
- FIGURE 56. SARTORIUS AG: REVENUE SHARE BY REGION, 2022 (%)
- FIGURE 57. SGS: NET REVENUE, 2020-2022 ($MILLION)
- FIGURE 58. SGS: REVENUE SHARE BY SEGMENT, 2022 (%)

