
PUBLISHER: Allied Market Research | PRODUCT CODE: 1414946

PUBLISHER: Allied Market Research | PRODUCT CODE: 1414946
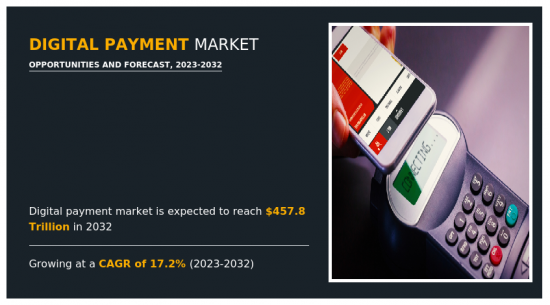
Digital Payment Market By Offering, By Transaction Type, By Industry Vertical : Global Opportunity Analysis and Industry Forecast, 2023-2032
According to a new report published by Allied Market Research, titled, "Digital Payment Market," The digital payment market was valued at $95.5 trillion in 2022, and is estimated to reach $457753.5 billion by 2032, growing at a CAGR of 17.2% from 2023 to 2032.
With evolving technologies, smartphones are increasingly available at reasonable prices and are being affordable for customers, which promote growth of the digital payment market. In addition, massive adoption of online payment for online shopping and development of the payments industry drives the digital payment market growth. Further, a wider audience can benefit from the convenience of digital payments as more people have access to mobile devices and dependable internet. Furthermore, the increasing focus on financial inclusion has been crucial. Digital payment systems offer a competitive alternative in places where access to traditional banking infrastructure is constrained. With the rise of e-commerce and online shopping, customers' expectations for speedy and secure transactions have grown, driving up demand for digital payment solutions. Government initiatives promoting a paperless environment and the adoption of digital payment methods by several sectors of the economy, including healthcare and transportation, have also contributed to the market's expansion. Because of enhanced security measures and the development of cutting-edge technologies like contactless payments and mobile wallets, which have raised acceptance and use, users today feel more confident. In general, the digital payment market is being driven ahead by the confluence of strategic initiatives from the public and commercial sectors, shifting consumer preferences, and technology improvements. However, expensive & geo-locational preference of payment gateways and rise in data breaches and security issues while conducting payments are some of the factors that hamper the market growth. On the contrary, payment industry is introducing a gradual shift toward a digital economy across several countries. In addition, surge in adoption of digital payment across emerging economies and rapid technological advancements in payments sector are expected to provide lucrative opportunities for the market growth in the coming years.
The digital payment market is segmented into offering, transaction type, industry vertical, and region. By offering, the market is differentiated into solution and service. Depending on the transaction type, it is fragmented into domestic and cross border. The industry vertical segment is segmented into BFSI, IT and telecom, healthcare, retail & e-commerce, media & entertainment, transportation, and others. Region wise, the market is analyzed across North America, Europe, Asia-Pacific, and LAMEA.
The digital payment market analysis includes top companies operating in the market such as Paypal Holdings Inc., Adeyn N.V., Fiserv, Inc., ACI Worldwide, Stripe, Inc., Mastercard Incorporated, Temenos AG, FIS Global, Visa, Inc., and PayU. These players have adopted various strategies to increase their market penetration and strengthen their position in the digital payment industry.
KEY BENEFITS FOR STAKEHOLDERS
- The study provides in-depth analysis of the global digital payment market along with the current trends and future estimations to illustrate the imminent investment pockets.
- Information about key drivers, restrains, & opportunities and their impact analysis on the global digital payment market size are provided in the report.
- The Porter's five forces analysis illustrates the potency of buyers and suppliers operating in the industry.
- The quantitative analysis of the global digital payment market from 2022 to 2032 is provided to determine the market potential.
Additional benefits you will get with this purchase are:
- Quarterly Update and* (only available with a corporate license, on listed price)
- 5 additional Company Profile of client Choice pre- or Post-purchase, as a free update.
- Free Upcoming Version on the Purchase of Five and Enterprise User License.
- 16 analyst hours of support* (post-purchase, if you find additional data requirements upon review of the report, you may receive support amounting to 16 analyst hours to solve questions, and post-sale queries)
- 15% Free Customization* (in case the scope or segment of the report does not match your requirements, 15% is equivalent to 3 working days of free work, applicable once)
- Free data Pack on the Five and Enterprise User License. (Excel version of the report)
- Free Updated report if the report is 6-12 months old or older.
- 24-hour priority response*
- Free Industry updates and white papers.
Possible Customization with this report (with additional cost and timeline, please talk to the sales executive to know more)
- Investment Opportunities
- Upcoming/New Entrant by Regions
- Market share analysis of players by products/segments
- New Product Development/ Product Matrix of Key Players
- Regulatory Guidelines
- Additional company profiles with specific to client's interest
- Additional country or region analysis- market size and forecast
- Key player details (including location, contact details, supplier/vendor network etc. in excel format)
- Market share analysis of players at global/region/country level
- SWOT Analysis
Key Market Segments
By Offering
- Solution
- Service
By Industry Vertical
- Transportation
- Others
- BFSI
- IT and Telecom
- Healthcare
- Retail and E-commerce
- Media and Entertainment
By Transaction Type
- Domestic
- Cross Border
By Region
- North America
- U.S.
- Canada
- Europe
- UK
- Germany
- France
- Italy
- Spain
- Rest of Europe
- Asia-Pacific
- China
- Japan
- India
- Australia
- South Korea
- Rest of Asia-Pacific
- LAMEA
- Latin America
- Middle East
- Africa
Key Market Players:
- Adyen N.V.
- Fiserv, Inc.
- Stripe, Inc.
- Temenos AG
- FIS Global
- PAYU
- PayPal Holdings, Inc.
- ACI Worldwide
- Mastercard Incorporated.
- VISA, INC.
TABLE OF CONTENTS
CHAPTER 1: INTRODUCTION
- 1.1. Report description
- 1.2. Key market segments
- 1.3. Key benefits to the stakeholders
- 1.4. Research methodology
- 1.4.1. Primary research
- 1.4.2. Secondary research
- 1.4.3. Analyst tools and models
CHAPTER 2: EXECUTIVE SUMMARY
- 2.1. CXO Perspective
CHAPTER 3: MARKET OVERVIEW
- 3.1. Market definition and scope
- 3.2. Key findings
- 3.2.1. Top impacting factors
- 3.2.2. Top investment pockets
- 3.3. Porter's five forces analysis
- 3.3.1. Low bargaining power of suppliers
- 3.3.2. Low threat of new entrants
- 3.3.3. Low threat of substitutes
- 3.3.4. Low intensity of rivalry
- 3.3.5. Low bargaining power of buyers
- 3.4. Market dynamics
- 3.4.1. Drivers
- 3.4.1.1. Increased penetration of smartphones and access to high-speed internet
- 3.4.1.2. Growth of m-commerce industry
- 3.4.1.3. Massive adoption of mobile payments for online and retail shopping
- 3.4.2. Restraints
- 3.4.2.1. Rise in data breach and security issues while conducting payments
- 3.4.3. Opportunities
- 3.4.3.1. Increase in demand for fast & hassle-free transaction services
- 3.4.3.2. Rapid digitalization in payments sector
- 3.4.1. Drivers
CHAPTER 4: DIGITAL PAYMENT MARKET, BY OFFERING
- 4.1. Overview
- 4.1.1. Market size and forecast
- 4.2. Solution
- 4.2.1. Key market trends, growth factors and opportunities
- 4.2.2. Market size and forecast, by region
- 4.2.3. Market share analysis by country
- 4.3. Service
- 4.3.1. Key market trends, growth factors and opportunities
- 4.3.2. Market size and forecast, by region
- 4.3.3. Market share analysis by country
CHAPTER 5: DIGITAL PAYMENT MARKET, BY TRANSACTION TYPE
- 5.1. Overview
- 5.1.1. Market size and forecast
- 5.2. Domestic
- 5.2.1. Key market trends, growth factors and opportunities
- 5.2.2. Market size and forecast, by region
- 5.2.3. Market share analysis by country
- 5.3. Cross Border
- 5.3.1. Key market trends, growth factors and opportunities
- 5.3.2. Market size and forecast, by region
- 5.3.3. Market share analysis by country
CHAPTER 6: DIGITAL PAYMENT MARKET, BY INDUSTRY VERTICAL
- 6.1. Overview
- 6.1.1. Market size and forecast
- 6.2. BFSI
- 6.2.1. Key market trends, growth factors and opportunities
- 6.2.2. Market size and forecast, by region
- 6.2.3. Market share analysis by country
- 6.3. IT and Telecom
- 6.3.1. Key market trends, growth factors and opportunities
- 6.3.2. Market size and forecast, by region
- 6.3.3. Market share analysis by country
- 6.4. Healthcare
- 6.4.1. Key market trends, growth factors and opportunities
- 6.4.2. Market size and forecast, by region
- 6.4.3. Market share analysis by country
- 6.5. Retail and E-commerce
- 6.5.1. Key market trends, growth factors and opportunities
- 6.5.2. Market size and forecast, by region
- 6.5.3. Market share analysis by country
- 6.6. Media and Entertainment
- 6.6.1. Key market trends, growth factors and opportunities
- 6.6.2. Market size and forecast, by region
- 6.6.3. Market share analysis by country
- 6.7. Transportation
- 6.7.1. Key market trends, growth factors and opportunities
- 6.7.2. Market size and forecast, by region
- 6.7.3. Market share analysis by country
- 6.8. Others
- 6.8.1. Key market trends, growth factors and opportunities
- 6.8.2. Market size and forecast, by region
- 6.8.3. Market share analysis by country
CHAPTER 7: DIGITAL PAYMENT MARKET, BY REGION
- 7.1. Overview
- 7.1.1. Market size and forecast By Region
- 7.2. North America
- 7.2.1. Key market trends, growth factors and opportunities
- 7.2.2. Market size and forecast, by Offering
- 7.2.3. Market size and forecast, by Transaction Type
- 7.2.4. Market size and forecast, by Industry Vertical
- 7.2.5. Market size and forecast, by country
- 7.2.5.1. U.S.
- 7.2.5.1.1. Market size and forecast, by Offering
- 7.2.5.1.2. Market size and forecast, by Transaction Type
- 7.2.5.1.3. Market size and forecast, by Industry Vertical
- 7.2.5.2. Canada
- 7.2.5.2.1. Market size and forecast, by Offering
- 7.2.5.2.2. Market size and forecast, by Transaction Type
- 7.2.5.2.3. Market size and forecast, by Industry Vertical
- 7.3. Europe
- 7.3.1. Key market trends, growth factors and opportunities
- 7.3.2. Market size and forecast, by Offering
- 7.3.3. Market size and forecast, by Transaction Type
- 7.3.4. Market size and forecast, by Industry Vertical
- 7.3.5. Market size and forecast, by country
- 7.3.5.1. UK
- 7.3.5.1.1. Market size and forecast, by Offering
- 7.3.5.1.2. Market size and forecast, by Transaction Type
- 7.3.5.1.3. Market size and forecast, by Industry Vertical
- 7.3.5.2. Germany
- 7.3.5.2.1. Market size and forecast, by Offering
- 7.3.5.2.2. Market size and forecast, by Transaction Type
- 7.3.5.2.3. Market size and forecast, by Industry Vertical
- 7.3.5.3. France
- 7.3.5.3.1. Market size and forecast, by Offering
- 7.3.5.3.2. Market size and forecast, by Transaction Type
- 7.3.5.3.3. Market size and forecast, by Industry Vertical
- 7.3.5.4. Italy
- 7.3.5.4.1. Market size and forecast, by Offering
- 7.3.5.4.2. Market size and forecast, by Transaction Type
- 7.3.5.4.3. Market size and forecast, by Industry Vertical
- 7.3.5.5. Spain
- 7.3.5.5.1. Market size and forecast, by Offering
- 7.3.5.5.2. Market size and forecast, by Transaction Type
- 7.3.5.5.3. Market size and forecast, by Industry Vertical
- 7.3.5.6. Rest of Europe
- 7.3.5.6.1. Market size and forecast, by Offering
- 7.3.5.6.2. Market size and forecast, by Transaction Type
- 7.3.5.6.3. Market size and forecast, by Industry Vertical
- 7.4. Asia-Pacific
- 7.4.1. Key market trends, growth factors and opportunities
- 7.4.2. Market size and forecast, by Offering
- 7.4.3. Market size and forecast, by Transaction Type
- 7.4.4. Market size and forecast, by Industry Vertical
- 7.4.5. Market size and forecast, by country
- 7.4.5.1. China
- 7.4.5.1.1. Market size and forecast, by Offering
- 7.4.5.1.2. Market size and forecast, by Transaction Type
- 7.4.5.1.3. Market size and forecast, by Industry Vertical
- 7.4.5.2. Japan
- 7.4.5.2.1. Market size and forecast, by Offering
- 7.4.5.2.2. Market size and forecast, by Transaction Type
- 7.4.5.2.3. Market size and forecast, by Industry Vertical
- 7.4.5.3. India
- 7.4.5.3.1. Market size and forecast, by Offering
- 7.4.5.3.2. Market size and forecast, by Transaction Type
- 7.4.5.3.3. Market size and forecast, by Industry Vertical
- 7.4.5.4. Australia
- 7.4.5.4.1. Market size and forecast, by Offering
- 7.4.5.4.2. Market size and forecast, by Transaction Type
- 7.4.5.4.3. Market size and forecast, by Industry Vertical
- 7.4.5.5. South Korea
- 7.4.5.5.1. Market size and forecast, by Offering
- 7.4.5.5.2. Market size and forecast, by Transaction Type
- 7.4.5.5.3. Market size and forecast, by Industry Vertical
- 7.4.5.6. Rest of Asia-Pacific
- 7.4.5.6.1. Market size and forecast, by Offering
- 7.4.5.6.2. Market size and forecast, by Transaction Type
- 7.4.5.6.3. Market size and forecast, by Industry Vertical
- 7.5. LAMEA
- 7.5.1. Key market trends, growth factors and opportunities
- 7.5.2. Market size and forecast, by Offering
- 7.5.3. Market size and forecast, by Transaction Type
- 7.5.4. Market size and forecast, by Industry Vertical
- 7.5.5. Market size and forecast, by country
- 7.5.5.1. Latin America
- 7.5.5.1.1. Market size and forecast, by Offering
- 7.5.5.1.2. Market size and forecast, by Transaction Type
- 7.5.5.1.3. Market size and forecast, by Industry Vertical
- 7.5.5.2. Middle East
- 7.5.5.2.1. Market size and forecast, by Offering
- 7.5.5.2.2. Market size and forecast, by Transaction Type
- 7.5.5.2.3. Market size and forecast, by Industry Vertical
- 7.5.5.3. Africa
- 7.5.5.3.1. Market size and forecast, by Offering
- 7.5.5.3.2. Market size and forecast, by Transaction Type
- 7.5.5.3.3. Market size and forecast, by Industry Vertical
CHAPTER 8: COMPETITIVE LANDSCAPE
- 8.1. Introduction
- 8.2. Top winning strategies
- 8.3. Product mapping of top 10 player
- 8.4. Competitive dashboard
- 8.5. Competitive heatmap
- 8.6. Top player positioning, 2022
CHAPTER 9: COMPANY PROFILES
- 9.1. PayPal Holdings, Inc.
- 9.1.1. Company overview
- 9.1.2. Key executives
- 9.1.3. Company snapshot
- 9.1.4. Operating business segments
- 9.1.5. Product portfolio
- 9.1.6. Business performance
- 9.1.7. Key strategic moves and developments
- 9.2. Adyen N.V.
- 9.2.1. Company overview
- 9.2.2. Key executives
- 9.2.3. Company snapshot
- 9.2.4. Operating business segments
- 9.2.5. Product portfolio
- 9.2.6. Business performance
- 9.2.7. Key strategic moves and developments
- 9.3. Fiserv, Inc.
- 9.3.1. Company overview
- 9.3.2. Key executives
- 9.3.3. Company snapshot
- 9.3.4. Operating business segments
- 9.3.5. Product portfolio
- 9.3.6. Business performance
- 9.3.7. Key strategic moves and developments
- 9.4. VISA, INC.
- 9.4.1. Company overview
- 9.4.2. Key executives
- 9.4.3. Company snapshot
- 9.4.4. Operating business segments
- 9.4.5. Product portfolio
- 9.4.6. Business performance
- 9.4.7. Key strategic moves and developments
- 9.5. ACI Worldwide
- 9.5.1. Company overview
- 9.5.2. Key executives
- 9.5.3. Company snapshot
- 9.5.4. Operating business segments
- 9.5.5. Product portfolio
- 9.5.6. Business performance
- 9.5.7. Key strategic moves and developments
- 9.6. Stripe, Inc.
- 9.6.1. Company overview
- 9.6.2. Key executives
- 9.6.3. Company snapshot
- 9.6.4. Operating business segments
- 9.6.5. Product portfolio
- 9.6.6. Key strategic moves and developments
- 9.7. Mastercard Incorporated.
- 9.7.1. Company overview
- 9.7.2. Key executives
- 9.7.3. Company snapshot
- 9.7.4. Operating business segments
- 9.7.5. Product portfolio
- 9.7.6. Business performance
- 9.7.7. Key strategic moves and developments
- 9.8. Temenos AG
- 9.8.1. Company overview
- 9.8.2. Key executives
- 9.8.3. Company snapshot
- 9.8.4. Operating business segments
- 9.8.5. Product portfolio
- 9.8.6. Business performance
- 9.8.7. Key strategic moves and developments
- 9.9. PAYU
- 9.9.1. Company overview
- 9.9.2. Key executives
- 9.9.3. Company snapshot
- 9.9.4. Operating business segments
- 9.9.5. Product portfolio
- 9.9.6. Key strategic moves and developments
- 9.10. FIS Global
- 9.10.1. Company overview
- 9.10.2. Key executives
- 9.10.3. Company snapshot
- 9.10.4. Operating business segments
- 9.10.5. Product portfolio
- 9.10.6. Key strategic moves and developments
LIST OF TABLES
- TABLE 01. GLOBAL DIGITAL PAYMENT MARKET, BY OFFERING, 2022-2032 ($BILLION)
- TABLE 02. DIGITAL PAYMENT MARKET FOR SOLUTION, BY REGION, 2022-2032 ($BILLION)
- TABLE 03. DIGITAL PAYMENT MARKET FOR SERVICE, BY REGION, 2022-2032 ($BILLION)
- TABLE 04. GLOBAL DIGITAL PAYMENT MARKET, BY TRANSACTION TYPE, 2022-2032 ($BILLION)
- TABLE 05. DIGITAL PAYMENT MARKET FOR DOMESTIC, BY REGION, 2022-2032 ($BILLION)
- TABLE 06. DIGITAL PAYMENT MARKET FOR CROSS BORDER, BY REGION, 2022-2032 ($BILLION)
- TABLE 07. GLOBAL DIGITAL PAYMENT MARKET, BY INDUSTRY VERTICAL, 2022-2032 ($BILLION)
- TABLE 08. DIGITAL PAYMENT MARKET FOR BFSI, BY REGION, 2022-2032 ($BILLION)
- TABLE 09. DIGITAL PAYMENT MARKET FOR IT AND TELECOM, BY REGION, 2022-2032 ($BILLION)
- TABLE 10. DIGITAL PAYMENT MARKET FOR HEALTHCARE, BY REGION, 2022-2032 ($BILLION)
- TABLE 11. DIGITAL PAYMENT MARKET FOR RETAIL AND E-COMMERCE, BY REGION, 2022-2032 ($BILLION)
- TABLE 12. DIGITAL PAYMENT MARKET FOR MEDIA AND ENTERTAINMENT, BY REGION, 2022-2032 ($BILLION)
- TABLE 13. DIGITAL PAYMENT MARKET FOR TRANSPORTATION, BY REGION, 2022-2032 ($BILLION)
- TABLE 14. DIGITAL PAYMENT MARKET FOR OTHERS, BY REGION, 2022-2032 ($BILLION)
- TABLE 15. DIGITAL PAYMENT MARKET, BY REGION, 2022-2032 ($BILLION)
- TABLE 16. NORTH AMERICA DIGITAL PAYMENT MARKET, BY OFFERING, 2022-2032 ($BILLION)
- TABLE 17. NORTH AMERICA DIGITAL PAYMENT MARKET, BY TRANSACTION TYPE, 2022-2032 ($BILLION)
- TABLE 18. NORTH AMERICA DIGITAL PAYMENT MARKET, BY INDUSTRY VERTICAL, 2022-2032 ($BILLION)
- TABLE 19. NORTH AMERICA DIGITAL PAYMENT MARKET, BY COUNTRY, 2022-2032 ($BILLION)
- TABLE 20. U.S. DIGITAL PAYMENT MARKET, BY OFFERING, 2022-2032 ($BILLION)
- TABLE 21. U.S. DIGITAL PAYMENT MARKET, BY TRANSACTION TYPE, 2022-2032 ($BILLION)
- TABLE 22. U.S. DIGITAL PAYMENT MARKET, BY INDUSTRY VERTICAL, 2022-2032 ($BILLION)
- TABLE 23. CANADA DIGITAL PAYMENT MARKET, BY OFFERING, 2022-2032 ($BILLION)
- TABLE 24. CANADA DIGITAL PAYMENT MARKET, BY TRANSACTION TYPE, 2022-2032 ($BILLION)
- TABLE 25. CANADA DIGITAL PAYMENT MARKET, BY INDUSTRY VERTICAL, 2022-2032 ($BILLION)
- TABLE 26. EUROPE DIGITAL PAYMENT MARKET, BY OFFERING, 2022-2032 ($BILLION)
- TABLE 27. EUROPE DIGITAL PAYMENT MARKET, BY TRANSACTION TYPE, 2022-2032 ($BILLION)
- TABLE 28. EUROPE DIGITAL PAYMENT MARKET, BY INDUSTRY VERTICAL, 2022-2032 ($BILLION)
- TABLE 29. EUROPE DIGITAL PAYMENT MARKET, BY COUNTRY, 2022-2032 ($BILLION)
- TABLE 30. UK DIGITAL PAYMENT MARKET, BY OFFERING, 2022-2032 ($BILLION)
- TABLE 31. UK DIGITAL PAYMENT MARKET, BY TRANSACTION TYPE, 2022-2032 ($BILLION)
- TABLE 32. UK DIGITAL PAYMENT MARKET, BY INDUSTRY VERTICAL, 2022-2032 ($BILLION)
- TABLE 33. GERMANY DIGITAL PAYMENT MARKET, BY OFFERING, 2022-2032 ($BILLION)
- TABLE 34. GERMANY DIGITAL PAYMENT MARKET, BY TRANSACTION TYPE, 2022-2032 ($BILLION)
- TABLE 35. GERMANY DIGITAL PAYMENT MARKET, BY INDUSTRY VERTICAL, 2022-2032 ($BILLION)
- TABLE 36. FRANCE DIGITAL PAYMENT MARKET, BY OFFERING, 2022-2032 ($BILLION)
- TABLE 37. FRANCE DIGITAL PAYMENT MARKET, BY TRANSACTION TYPE, 2022-2032 ($BILLION)
- TABLE 38. FRANCE DIGITAL PAYMENT MARKET, BY INDUSTRY VERTICAL, 2022-2032 ($BILLION)
- TABLE 39. ITALY DIGITAL PAYMENT MARKET, BY OFFERING, 2022-2032 ($BILLION)
- TABLE 40. ITALY DIGITAL PAYMENT MARKET, BY TRANSACTION TYPE, 2022-2032 ($BILLION)
- TABLE 41. ITALY DIGITAL PAYMENT MARKET, BY INDUSTRY VERTICAL, 2022-2032 ($BILLION)
- TABLE 42. SPAIN DIGITAL PAYMENT MARKET, BY OFFERING, 2022-2032 ($BILLION)
- TABLE 43. SPAIN DIGITAL PAYMENT MARKET, BY TRANSACTION TYPE, 2022-2032 ($BILLION)
- TABLE 44. SPAIN DIGITAL PAYMENT MARKET, BY INDUSTRY VERTICAL, 2022-2032 ($BILLION)
- TABLE 45. REST OF EUROPE DIGITAL PAYMENT MARKET, BY OFFERING, 2022-2032 ($BILLION)
- TABLE 46. REST OF EUROPE DIGITAL PAYMENT MARKET, BY TRANSACTION TYPE, 2022-2032 ($BILLION)
- TABLE 47. REST OF EUROPE DIGITAL PAYMENT MARKET, BY INDUSTRY VERTICAL, 2022-2032 ($BILLION)
- TABLE 48. ASIA-PACIFIC DIGITAL PAYMENT MARKET, BY OFFERING, 2022-2032 ($BILLION)
- TABLE 49. ASIA-PACIFIC DIGITAL PAYMENT MARKET, BY TRANSACTION TYPE, 2022-2032 ($BILLION)
- TABLE 50. ASIA-PACIFIC DIGITAL PAYMENT MARKET, BY INDUSTRY VERTICAL, 2022-2032 ($BILLION)
- TABLE 51. ASIA-PACIFIC DIGITAL PAYMENT MARKET, BY COUNTRY, 2022-2032 ($BILLION)
- TABLE 52. CHINA DIGITAL PAYMENT MARKET, BY OFFERING, 2022-2032 ($BILLION)
- TABLE 53. CHINA DIGITAL PAYMENT MARKET, BY TRANSACTION TYPE, 2022-2032 ($BILLION)
- TABLE 54. CHINA DIGITAL PAYMENT MARKET, BY INDUSTRY VERTICAL, 2022-2032 ($BILLION)
- TABLE 55. JAPAN DIGITAL PAYMENT MARKET, BY OFFERING, 2022-2032 ($BILLION)
- TABLE 56. JAPAN DIGITAL PAYMENT MARKET, BY TRANSACTION TYPE, 2022-2032 ($BILLION)
- TABLE 57. JAPAN DIGITAL PAYMENT MARKET, BY INDUSTRY VERTICAL, 2022-2032 ($BILLION)
- TABLE 58. INDIA DIGITAL PAYMENT MARKET, BY OFFERING, 2022-2032 ($BILLION)
- TABLE 59. INDIA DIGITAL PAYMENT MARKET, BY TRANSACTION TYPE, 2022-2032 ($BILLION)
- TABLE 60. INDIA DIGITAL PAYMENT MARKET, BY INDUSTRY VERTICAL, 2022-2032 ($BILLION)
- TABLE 61. AUSTRALIA DIGITAL PAYMENT MARKET, BY OFFERING, 2022-2032 ($BILLION)
- TABLE 62. AUSTRALIA DIGITAL PAYMENT MARKET, BY TRANSACTION TYPE, 2022-2032 ($BILLION)
- TABLE 63. AUSTRALIA DIGITAL PAYMENT MARKET, BY INDUSTRY VERTICAL, 2022-2032 ($BILLION)
- TABLE 64. SOUTH KOREA DIGITAL PAYMENT MARKET, BY OFFERING, 2022-2032 ($BILLION)
- TABLE 65. SOUTH KOREA DIGITAL PAYMENT MARKET, BY TRANSACTION TYPE, 2022-2032 ($BILLION)
- TABLE 66. SOUTH KOREA DIGITAL PAYMENT MARKET, BY INDUSTRY VERTICAL, 2022-2032 ($BILLION)
- TABLE 67. REST OF ASIA-PACIFIC DIGITAL PAYMENT MARKET, BY OFFERING, 2022-2032 ($BILLION)
- TABLE 68. REST OF ASIA-PACIFIC DIGITAL PAYMENT MARKET, BY TRANSACTION TYPE, 2022-2032 ($BILLION)
- TABLE 69. REST OF ASIA-PACIFIC DIGITAL PAYMENT MARKET, BY INDUSTRY VERTICAL, 2022-2032 ($BILLION)
- TABLE 70. LAMEA DIGITAL PAYMENT MARKET, BY OFFERING, 2022-2032 ($BILLION)
- TABLE 71. LAMEA DIGITAL PAYMENT MARKET, BY TRANSACTION TYPE, 2022-2032 ($BILLION)
- TABLE 72. LAMEA DIGITAL PAYMENT MARKET, BY INDUSTRY VERTICAL, 2022-2032 ($BILLION)
- TABLE 73. LAMEA DIGITAL PAYMENT MARKET, BY COUNTRY, 2022-2032 ($BILLION)
- TABLE 74. LATIN AMERICA DIGITAL PAYMENT MARKET, BY OFFERING, 2022-2032 ($BILLION)
- TABLE 75. LATIN AMERICA DIGITAL PAYMENT MARKET, BY TRANSACTION TYPE, 2022-2032 ($BILLION)
- TABLE 76. LATIN AMERICA DIGITAL PAYMENT MARKET, BY INDUSTRY VERTICAL, 2022-2032 ($BILLION)
- TABLE 77. MIDDLE EAST DIGITAL PAYMENT MARKET, BY OFFERING, 2022-2032 ($BILLION)
- TABLE 78. MIDDLE EAST DIGITAL PAYMENT MARKET, BY TRANSACTION TYPE, 2022-2032 ($BILLION)
- TABLE 79. MIDDLE EAST DIGITAL PAYMENT MARKET, BY INDUSTRY VERTICAL, 2022-2032 ($BILLION)
- TABLE 80. AFRICA DIGITAL PAYMENT MARKET, BY OFFERING, 2022-2032 ($BILLION)
- TABLE 81. AFRICA DIGITAL PAYMENT MARKET, BY TRANSACTION TYPE, 2022-2032 ($BILLION)
- TABLE 82. AFRICA DIGITAL PAYMENT MARKET, BY INDUSTRY VERTICAL, 2022-2032 ($BILLION)
- TABLE 83. PAYPAL HOLDINGS, INC.: KEY EXECUTIVES
- TABLE 84. PAYPAL HOLDINGS, INC.: COMPANY SNAPSHOT
- TABLE 85. PAYPAL HOLDINGS, INC.: SERVICE SEGMENTS
- TABLE 86. PAYPAL HOLDINGS, INC.: PRODUCT PORTFOLIO
- TABLE 87. PAYPAL HOLDINGS, INC.: KEY STRATERGIES
- TABLE 88. ADYEN N.V.: KEY EXECUTIVES
- TABLE 89. ADYEN N.V.: COMPANY SNAPSHOT
- TABLE 90. ADYEN N.V.: SERVICE SEGMENTS
- TABLE 91. ADYEN N.V.: PRODUCT PORTFOLIO
- TABLE 92. ADYEN N.V.: KEY STRATERGIES
- TABLE 93. FISERV, INC.: KEY EXECUTIVES
- TABLE 94. FISERV, INC.: COMPANY SNAPSHOT
- TABLE 95. FISERV, INC.: SERVICE SEGMENTS
- TABLE 96. FISERV, INC.: PRODUCT PORTFOLIO
- TABLE 97. FISERV, INC.: KEY STRATERGIES
- TABLE 98. VISA, INC.: KEY EXECUTIVES
- TABLE 99. VISA, INC.: COMPANY SNAPSHOT
- TABLE 100. VISA, INC.: SERVICE SEGMENTS
- TABLE 101. VISA, INC.: PRODUCT PORTFOLIO
- TABLE 102. VISA, INC.: KEY STRATERGIES
- TABLE 103. ACI WORLDWIDE: KEY EXECUTIVES
- TABLE 104. ACI WORLDWIDE: COMPANY SNAPSHOT
- TABLE 105. ACI WORLDWIDE: SERVICE SEGMENTS
- TABLE 106. ACI WORLDWIDE: PRODUCT PORTFOLIO
- TABLE 107. ACI WORLDWIDE: KEY STRATERGIES
- TABLE 108. STRIPE, INC.: KEY EXECUTIVES
- TABLE 109. STRIPE, INC.: COMPANY SNAPSHOT
- TABLE 110. STRIPE, INC.: SERVICE SEGMENTS
- TABLE 111. STRIPE, INC.: PRODUCT PORTFOLIO
- TABLE 112. STRIPE, INC.: KEY STRATERGIES
- TABLE 113. MASTERCARD INCORPORATED.: KEY EXECUTIVES
- TABLE 114. MASTERCARD INCORPORATED.: COMPANY SNAPSHOT
- TABLE 115. MASTERCARD INCORPORATED.: SERVICE SEGMENTS
- TABLE 116. MASTERCARD INCORPORATED.: PRODUCT PORTFOLIO
- TABLE 117. MASTERCARD INCORPORATED.: KEY STRATERGIES
- TABLE 118. TEMENOS AG: KEY EXECUTIVES
- TABLE 119. TEMENOS AG: COMPANY SNAPSHOT
- TABLE 120. TEMENOS AG: SERVICE SEGMENTS
- TABLE 121. TEMENOS AG: PRODUCT PORTFOLIO
- TABLE 122. TEMENOS AG: KEY STRATERGIES
- TABLE 123. PAYU: KEY EXECUTIVES
- TABLE 124. PAYU: COMPANY SNAPSHOT
- TABLE 125. PAYU: SERVICE SEGMENTS
- TABLE 126. PAYU: PRODUCT PORTFOLIO
- TABLE 127. PAYU: KEY STRATERGIES
- TABLE 128. FIS GLOBAL: KEY EXECUTIVES
- TABLE 129. FIS GLOBAL: COMPANY SNAPSHOT
- TABLE 130. FIS GLOBAL: SERVICE SEGMENTS
- TABLE 131. FIS GLOBAL: PRODUCT PORTFOLIO
- TABLE 132. FIS GLOBAL: KEY STRATERGIES
LIST OF FIGURES
- FIGURE 01. DIGITAL PAYMENT MARKET, 2022-2032
- FIGURE 02. SEGMENTATION OF DIGITAL PAYMENT MARKET,2022-2032
- FIGURE 03. TOP IMPACTING FACTORS IN DIGITAL PAYMENT MARKET (2022 TO 2032)
- FIGURE 04. TOP INVESTMENT POCKETS IN DIGITAL PAYMENT MARKET (2023-2032)
- FIGURE 05. LOW BARGAINING POWER OF SUPPLIERS
- FIGURE 06. LOW THREAT OF NEW ENTRANTS
- FIGURE 07. LOW THREAT OF SUBSTITUTES
- FIGURE 08. LOW INTENSITY OF RIVALRY
- FIGURE 09. LOW BARGAINING POWER OF BUYERS
- FIGURE 10. GLOBAL DIGITAL PAYMENT MARKET:DRIVERS, RESTRAINTS AND OPPORTUNITIES
- FIGURE 11. DIGITAL PAYMENT MARKET, BY OFFERING, 2022 AND 2032(%)
- FIGURE 12. COMPARATIVE SHARE ANALYSIS OF DIGITAL PAYMENT MARKET FOR SOLUTION, BY COUNTRY 2022 AND 2032(%)
- FIGURE 13. COMPARATIVE SHARE ANALYSIS OF DIGITAL PAYMENT MARKET FOR SERVICE, BY COUNTRY 2022 AND 2032(%)
- FIGURE 14. DIGITAL PAYMENT MARKET, BY TRANSACTION TYPE, 2022 AND 2032(%)
- FIGURE 15. COMPARATIVE SHARE ANALYSIS OF DIGITAL PAYMENT MARKET FOR DOMESTIC, BY COUNTRY 2022 AND 2032(%)
- FIGURE 16. COMPARATIVE SHARE ANALYSIS OF DIGITAL PAYMENT MARKET FOR CROSS BORDER, BY COUNTRY 2022 AND 2032(%)
- FIGURE 17. DIGITAL PAYMENT MARKET, BY INDUSTRY VERTICAL, 2022 AND 2032(%)
- FIGURE 18. COMPARATIVE SHARE ANALYSIS OF DIGITAL PAYMENT MARKET FOR BFSI, BY COUNTRY 2022 AND 2032(%)
- FIGURE 19. COMPARATIVE SHARE ANALYSIS OF DIGITAL PAYMENT MARKET FOR IT AND TELECOM, BY COUNTRY 2022 AND 2032(%)
- FIGURE 20. COMPARATIVE SHARE ANALYSIS OF DIGITAL PAYMENT MARKET FOR HEALTHCARE, BY COUNTRY 2022 AND 2032(%)
- FIGURE 21. COMPARATIVE SHARE ANALYSIS OF DIGITAL PAYMENT MARKET FOR RETAIL AND E-COMMERCE, BY COUNTRY 2022 AND 2032(%)
- FIGURE 22. COMPARATIVE SHARE ANALYSIS OF DIGITAL PAYMENT MARKET FOR MEDIA AND ENTERTAINMENT, BY COUNTRY 2022 AND 2032(%)
- FIGURE 23. COMPARATIVE SHARE ANALYSIS OF DIGITAL PAYMENT MARKET FOR TRANSPORTATION, BY COUNTRY 2022 AND 2032(%)
- FIGURE 24. COMPARATIVE SHARE ANALYSIS OF DIGITAL PAYMENT MARKET FOR OTHERS, BY COUNTRY 2022 AND 2032(%)
- FIGURE 25. DIGITAL PAYMENT MARKET BY REGION, 2022 AND 2032(%)
- FIGURE 26. U.S. DIGITAL PAYMENT MARKET, 2022-2032 ($BILLION)
- FIGURE 27. CANADA DIGITAL PAYMENT MARKET, 2022-2032 ($BILLION)
- FIGURE 28. UK DIGITAL PAYMENT MARKET, 2022-2032 ($BILLION)
- FIGURE 29. GERMANY DIGITAL PAYMENT MARKET, 2022-2032 ($BILLION)
- FIGURE 30. FRANCE DIGITAL PAYMENT MARKET, 2022-2032 ($BILLION)
- FIGURE 31. ITALY DIGITAL PAYMENT MARKET, 2022-2032 ($BILLION)
- FIGURE 32. SPAIN DIGITAL PAYMENT MARKET, 2022-2032 ($BILLION)
- FIGURE 33. REST OF EUROPE DIGITAL PAYMENT MARKET, 2022-2032 ($BILLION)
- FIGURE 34. CHINA DIGITAL PAYMENT MARKET, 2022-2032 ($BILLION)
- FIGURE 35. JAPAN DIGITAL PAYMENT MARKET, 2022-2032 ($BILLION)
- FIGURE 36. INDIA DIGITAL PAYMENT MARKET, 2022-2032 ($BILLION)
- FIGURE 37. AUSTRALIA DIGITAL PAYMENT MARKET, 2022-2032 ($BILLION)
- FIGURE 38. SOUTH KOREA DIGITAL PAYMENT MARKET, 2022-2032 ($BILLION)
- FIGURE 39. REST OF ASIA-PACIFIC DIGITAL PAYMENT MARKET, 2022-2032 ($BILLION)
- FIGURE 40. LATIN AMERICA DIGITAL PAYMENT MARKET, 2022-2032 ($BILLION)
- FIGURE 41. MIDDLE EAST DIGITAL PAYMENT MARKET, 2022-2032 ($BILLION)
- FIGURE 42. AFRICA DIGITAL PAYMENT MARKET, 2022-2032 ($BILLION)
- FIGURE 43. TOP WINNING STRATEGIES, BY YEAR (2021-2023)
- FIGURE 44. TOP WINNING STRATEGIES, BY DEVELOPMENT (2021-2023)
- FIGURE 45. TOP WINNING STRATEGIES, BY COMPANY (2021-2023)
- FIGURE 46. PRODUCT MAPPING OF TOP 10 PLAYERS
- FIGURE 47. COMPETITIVE DASHBOARD
- FIGURE 48. COMPETITIVE HEATMAP: DIGITAL PAYMENT MARKET
- FIGURE 49. TOP PLAYER POSITIONING, 2022
- FIGURE 50. PAYPAL HOLDINGS, INC.: NET REVENUE, 2020-2022 ($MILLION)
- FIGURE 51. PAYPAL HOLDINGS, INC.: REVENUE SHARE BY REGION, 2022 (%)
- FIGURE 52. ADYEN N.V.: NET REVENUE, 2020-2022 ($MILLION)
- FIGURE 53. ADYEN N.V.: REVENUE SHARE BY REGION, 2022 (%)
- FIGURE 54. FISERV, INC.: SALES REVENUE, 2020-2022 ($MILLION)
- FIGURE 55. ACI WORLDWIDE: NET REVENUE, 2020-2022 ($MILLION)
- FIGURE 56. ACI WORLDWIDE: RESEARCH & DEVELOPMENT EXPENDITURE, 2020-2022 ($MILLION)
- FIGURE 57. ACI WORLDWIDE: REVENUE SHARE BY SEGMENT, 2022 (%)
- FIGURE 58. ACI WORLDWIDE: REVENUE SHARE BY REGION, 2022 (%)
- FIGURE 59. MASTERCARD INCORPORATED.: NET REVENUE, 2020-2022 ($MILLION)
- FIGURE 60. MASTERCARD INCORPORATED.: REVENUE SHARE BY REGION, 2022 (%)
- FIGURE 61. MASTERCARD INCORPORATED.: REVENUE SHARE BY SEGMENT, 2022 (%)
- FIGURE 62. TEMENOS AG: NET REVENUE, 2020-2022 ($MILLION)
- FIGURE 63. TEMENOS AG: REVENUE SHARE BY SEGMENT, 2022 (%)
- FIGURE 64. TEMENOS AG: REVENUE SHARE BY REGION, 2022 (%)

