
PUBLISHER: Allied Market Research | PRODUCT CODE: 1414950

PUBLISHER: Allied Market Research | PRODUCT CODE: 1414950
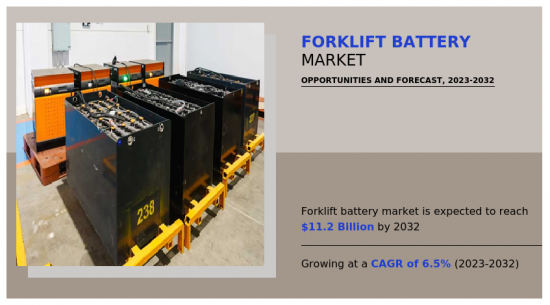
Forklift Battery Market By Application (Warehouses, Manufacturing, Construction, Retail and Wholesale Stores, Others), By Type (Lithium Ion (LI-ion), Lead Acid Battery, Others): Global Opportunity Analysis and Industry Forecast, 2023-2032
According to a new report published by Allied Market Research, titled, "Forklift Battery Market," The forklift battery market was valued at $5.9 billion in 2022, and is estimated to reach $11.2 billion by 2032, growing at a CAGR of 6.5% from 2023 to 2032.
Forklift batteries are a source of power for electric lift trucks and forklifts. Forklift batteries supply electrical energy required to run the electric motor of the forklift, which powers the lifting and propulsion systems of the vehicle. These batteries are one of the main parts of the equipment and aids in smooth operation. Vehicles powered by batteries are completely silent. In comparison to diesel-powered forklift trucks, they are more environmentally friendly. The battery-powered trucks produce no harmful gasses and hence do not affect the environment.
The demand for lithium-ion batteries for use in forklifts and lifting trucks has increased in recent years owing to several benefits of lithium-ion batteries such as high energy density, relatively lower self-discharge rate, and ability to be recharged multiple times. Moreover, use of forklift equipment in warehouses and storage sectors has also contributed to increased demand for forklift batteries and hence led to market growth.
For the purpose of analysis, the forklift battery market is segmented based on type, application, and region. Depending on type, the market is categorized into lead acid batteries, lithium-ion batteries, and others. Lithium ions are the main ingredient in the electrochemical process that powers lithium-ion (Li-ion) batteries, a class of rechargeable battery. Because of their high energy density, comparatively low self-discharge rate, and multiple rechargeability, they have emerged as one of the most widely used types of rechargeable batteries for a variety of applications.
By application, the forklift battery market is divided into warehouses, manufacturing, construction, retail and wholesale stores, and others. The market was led by the manufacturing segment in 2022, and throughout the forklift battery projection period, it is anticipated to develop at the greatest CAGR. Manufacturing is the process of using different physical, chemical, or mechanical processes to transform raw materials, components, or parts into finished things. It entails converting raw materials or components into finished goods on a big scale with the aid of personnel, equipment, machinery, and a planned production procedure.
By region, the forklift battery market is further analyzed across North America, Europe, Asia-Pacific, and LAMEA (Latin America, the Middle East, and Africa). Asia-Pacific has a dominant position in the forklift battery market. The emphasis on energy conservation and reducing operational expenditures has led to an increasing popularity of advanced battery technologies. Government subsidies and other incentives are encouraging businesses to use electric forklifts. Ongoing advancements in battery technology, such as increased energy density and infrastructure for charging, are shaping the business.
The major players operating in the forklift battery industry are Iberdrola S.A., Amara Raja Batteries Ltd., EnerSys, East Penn Manufacturing Company, Inc., EXIDE INDUSTRIES LTD., Trojan Battery Company, LLC., GS Yuasa International Ltd., Flux Power, Zhejiang Narada Power Source Co., Ltd., and Electrovaya. The companies adopted key strategies such as collaboration and expansion to increase their market share.
Recent Market Developments:
- In October 2022, the ENERSYS strengthens partnership with Industrial Battery & Charger, Inc. through product territory expansion.
- IN May 2023, The Trojan Battery Company, LLC, went into agreement with Continental Battery Systems for an expansion of its master distributorship agreement with Trojan Battery Company. This agreement builds upon the existing relationship between the two companies and represents an exclusive opportunity to galvanize Continental Battery Systems.
- In November 2023, Electrovaya announced a three-year strategic supply agreement with existing and new global OEM partners. It's a leading lithium-ion battery technology and manufacturing company, executed a Strategic Supply Agreement with two leading affiliated OEM partners for material handling vehicles and other affiliates for the supply of battery systems.
- The report offers a thorough analysis of the forklift battery market with detailed study of various aspects of the market such as market dynamics, vital segments, major geographies, key players, and competitive landscape. The report provides a clear picture of the current market situation and future trends of the forklift battery market based on the impact of various market dynamics and vital forces influencing the market.
- The drivers and opportunities contributing toward the market growth are acknowledged in the market dynamics. Besides, challenges and restraints that hold potential to hamper market growth are also provided in the forklift battery market. Porter's five forces analysis is delivered through the report which precisely highlights the effects of key forces on the forklift battery market. The report offers market size and estimations analyzing forklift battery market through various segments. Furthermore, the report covers the competitive scenario of the forklift battery market. The key players operating in the forklift battery market are studied in the report to understand their current market position and competitive strengths in the industry.
Key Benefits For Stakeholders
- This report provides a quantitative analysis of the market segments, current trends, estimations, and dynamics of the forklift battery market analysis from 2022 to 2032 to identify the prevailing forklift battery market opportunities.
- The market research is offered along with information related to key drivers, restraints, and opportunities.
- Porter's five forces analysis highlights the potency of buyers and suppliers to enable stakeholders make profit-oriented business decisions and strengthen their supplier-buyer network.
- In-depth analysis of the forklift battery market segmentation assists to determine the prevailing market opportunities.
- Major countries in each region are mapped according to their revenue contribution to the global market.
- Market player positioning facilitates benchmarking and provides a clear understanding of the present position of the market players.
- The report includes the analysis of the regional as well as global forklift battery market trends, key players, market segments, application areas, and market growth strategies.
Additional benefits you will get with this purchase are:
- Quarterly Update and* (only available with a corporate license, on listed price)
- 5 additional Company Profile of client Choice pre- or Post-purchase, as a free update.
- Free Upcoming Version on the Purchase of Five and Enterprise User License.
- 16 analyst hours of support* (post-purchase, if you find additional data requirements upon review of the report, you may receive support amounting to 16 analyst hours to solve questions, and post-sale queries)
- 15% Free Customization* (in case the scope or segment of the report does not match your requirements, 15% is equivalent to 3 working days of free work, applicable once)
- Free data Pack on the Five and Enterprise User License. (Excel version of the report)
- Free Updated report if the report is 6-12 months old or older.
- 24-hour priority response*
- Free Industry updates and white papers.
Possible Customization with this report (with additional cost and timeline, please talk to the sales executive to know more)
- Additional company profiles with specific to client's interest
- Additional country or region analysis- market size and forecast
- Historic market data
- Key player details (including location, contact details, supplier/vendor network etc. in excel format)
- List of customers/consumers/raw material suppliers- value chain analysis
- SWOT Analysis
Key Market Segments
By Application
- Warehouses
- Manufacturing
- Construction
- Retail and Wholesale Stores
- Others
By Type
- Lithium Ion (LI-ion)
- Lead Acid Battery
- Others
By Region
- North America
- U.S.
- Canada
- Mexico
- Europe
- Germany
- UK
- France
- Italy
- Spain
- Rest of Europe
- Asia-Pacific
- China
- Japan
- India
- South Korea
- Australia
- Rest of Asia-Pacific
- LAMEA
- Brazil
- Saudi Arabia
- South Africa
- Rest of LAMEA
Key Market Players:
- EnerSys
- Trojan Battery Company, LLC.
- Electrovaya
- EXIDE INDUSTRIES LTD.
- Iberdrola S.A.
- Flux Power
- GS Yuasa International Ltd.
- Amara Raja Batteries Ltd.
- Zhejiang Narada Power Source Co., Ltd
- East Penn Manufacturing Company, Inc.
TABLE OF CONTENTS
CHAPTER 1: INTRODUCTION
- 1.1. Report description
- 1.2. Key market segments
- 1.3. Key benefits to the stakeholders
- 1.4. Research methodology
- 1.4.1. Primary research
- 1.4.2. Secondary research
- 1.4.3. Analyst tools and models
CHAPTER 2: EXECUTIVE SUMMARY
- 2.1. CXO Perspective
CHAPTER 3: MARKET OVERVIEW
- 3.1. Market definition and scope
- 3.2. Key findings
- 3.2.1. Top impacting factors
- 3.2.2. Top investment pockets
- 3.3. Porter's five forces analysis
- 3.3.1. Low bargaining power of suppliers
- 3.3.2. Low threat of new entrants
- 3.3.3. Low threat of substitutes
- 3.3.4. Low intensity of rivalry
- 3.3.5. Low bargaining power of buyers
- 3.4. Market dynamics
- 3.4.1. Drivers
- 3.4.1.1. Economic advantages coupled with government benefits
- 3.4.1.2. Increased energy efficiency and technological advancements
- 3.4.2. Restraints
- 3.4.2.1. High upfront costs and battery replacement costs
- 3.4.3. Opportunities
- 3.4.3.1. Advancements in charging technology and development in hydrogen infrastructure
- 3.4.3.2. Integration with renewable energy and expanding e-commerce
- 3.4.1. Drivers
- 3.5. Value Chain Analysis
- 3.6. Patent Landscape
CHAPTER 4: FORKLIFT BATTERY MARKET, BY APPLICATION
- 4.1. Overview
- 4.1.1. Market size and forecast
- 4.2. Warehouses
- 4.2.1. Key market trends, growth factors and opportunities
- 4.2.2. Market size and forecast, by region
- 4.2.3. Market share analysis by country
- 4.3. Manufacturing
- 4.3.1. Key market trends, growth factors and opportunities
- 4.3.2. Market size and forecast, by region
- 4.3.3. Market share analysis by country
- 4.4. Construction
- 4.4.1. Key market trends, growth factors and opportunities
- 4.4.2. Market size and forecast, by region
- 4.4.3. Market share analysis by country
- 4.5. Retail and Wholesale Stores
- 4.5.1. Key market trends, growth factors and opportunities
- 4.5.2. Market size and forecast, by region
- 4.5.3. Market share analysis by country
- 4.6. Others
- 4.6.1. Key market trends, growth factors and opportunities
- 4.6.2. Market size and forecast, by region
- 4.6.3. Market share analysis by country
CHAPTER 5: FORKLIFT BATTERY MARKET, BY TYPE
- 5.1. Overview
- 5.1.1. Market size and forecast
- 5.2. Lithium Ion (LI-ion)
- 5.2.1. Key market trends, growth factors and opportunities
- 5.2.2. Market size and forecast, by region
- 5.2.3. Market share analysis by country
- 5.3. Lead Acid Battery
- 5.3.1. Key market trends, growth factors and opportunities
- 5.3.2. Market size and forecast, by region
- 5.3.3. Market share analysis by country
- 5.4. Others
- 5.4.1. Key market trends, growth factors and opportunities
- 5.4.2. Market size and forecast, by region
- 5.4.3. Market share analysis by country
CHAPTER 6: FORKLIFT BATTERY MARKET, BY REGION
- 6.1. Overview
- 6.1.1. Market size and forecast By Region
- 6.2. North America
- 6.2.1. Key market trends, growth factors and opportunities
- 6.2.2. Market size and forecast, by Application
- 6.2.3. Market size and forecast, by Type
- 6.2.4. Market size and forecast, by country
- 6.2.4.1. U.S.
- 6.2.4.1.1. Market size and forecast, by Application
- 6.2.4.1.2. Market size and forecast, by Type
- 6.2.4.2. Canada
- 6.2.4.2.1. Market size and forecast, by Application
- 6.2.4.2.2. Market size and forecast, by Type
- 6.2.4.3. Mexico
- 6.2.4.3.1. Market size and forecast, by Application
- 6.2.4.3.2. Market size and forecast, by Type
- 6.3. Europe
- 6.3.1. Key market trends, growth factors and opportunities
- 6.3.2. Market size and forecast, by Application
- 6.3.3. Market size and forecast, by Type
- 6.3.4. Market size and forecast, by country
- 6.3.4.1. Germany
- 6.3.4.1.1. Market size and forecast, by Application
- 6.3.4.1.2. Market size and forecast, by Type
- 6.3.4.2. UK
- 6.3.4.2.1. Market size and forecast, by Application
- 6.3.4.2.2. Market size and forecast, by Type
- 6.3.4.3. France
- 6.3.4.3.1. Market size and forecast, by Application
- 6.3.4.3.2. Market size and forecast, by Type
- 6.3.4.4. Italy
- 6.3.4.4.1. Market size and forecast, by Application
- 6.3.4.4.2. Market size and forecast, by Type
- 6.3.4.5. Spain
- 6.3.4.5.1. Market size and forecast, by Application
- 6.3.4.5.2. Market size and forecast, by Type
- 6.3.4.6. Rest of Europe
- 6.3.4.6.1. Market size and forecast, by Application
- 6.3.4.6.2. Market size and forecast, by Type
- 6.4. Asia-Pacific
- 6.4.1. Key market trends, growth factors and opportunities
- 6.4.2. Market size and forecast, by Application
- 6.4.3. Market size and forecast, by Type
- 6.4.4. Market size and forecast, by country
- 6.4.4.1. China
- 6.4.4.1.1. Market size and forecast, by Application
- 6.4.4.1.2. Market size and forecast, by Type
- 6.4.4.2. Japan
- 6.4.4.2.1. Market size and forecast, by Application
- 6.4.4.2.2. Market size and forecast, by Type
- 6.4.4.3. India
- 6.4.4.3.1. Market size and forecast, by Application
- 6.4.4.3.2. Market size and forecast, by Type
- 6.4.4.4. South Korea
- 6.4.4.4.1. Market size and forecast, by Application
- 6.4.4.4.2. Market size and forecast, by Type
- 6.4.4.5. Australia
- 6.4.4.5.1. Market size and forecast, by Application
- 6.4.4.5.2. Market size and forecast, by Type
- 6.4.4.6. Rest of Asia-Pacific
- 6.4.4.6.1. Market size and forecast, by Application
- 6.4.4.6.2. Market size and forecast, by Type
- 6.5. LAMEA
- 6.5.1. Key market trends, growth factors and opportunities
- 6.5.2. Market size and forecast, by Application
- 6.5.3. Market size and forecast, by Type
- 6.5.4. Market size and forecast, by country
- 6.5.4.1. Brazil
- 6.5.4.1.1. Market size and forecast, by Application
- 6.5.4.1.2. Market size and forecast, by Type
- 6.5.4.2. Saudi Arabia
- 6.5.4.2.1. Market size and forecast, by Application
- 6.5.4.2.2. Market size and forecast, by Type
- 6.5.4.3. South Africa
- 6.5.4.3.1. Market size and forecast, by Application
- 6.5.4.3.2. Market size and forecast, by Type
- 6.5.4.4. Rest of LAMEA
- 6.5.4.4.1. Market size and forecast, by Application
- 6.5.4.4.2. Market size and forecast, by Type
CHAPTER 7: COMPETITIVE LANDSCAPE
- 7.1. Introduction
- 7.2. Top winning strategies
- 7.3. Product mapping of top 10 player
- 7.4. Competitive dashboard
- 7.5. Competitive heatmap
- 7.6. Top player positioning, 2022
CHAPTER 8: COMPANY PROFILES
- 8.1. Iberdrola S.A.
- 8.1.1. Company overview
- 8.1.2. Key executives
- 8.1.3. Company snapshot
- 8.1.4. Operating business segments
- 8.1.5. Product portfolio
- 8.1.6. Business performance
- 8.2. Amara Raja Batteries Ltd.
- 8.2.1. Company overview
- 8.2.2. Key executives
- 8.2.3. Company snapshot
- 8.2.4. Operating business segments
- 8.2.5. Product portfolio
- 8.2.6. Business performance
- 8.3. EnerSys
- 8.3.1. Company overview
- 8.3.2. Key executives
- 8.3.3. Company snapshot
- 8.3.4. Operating business segments
- 8.3.5. Product portfolio
- 8.3.6. Business performance
- 8.3.7. Key strategic moves and developments
- 8.4. East Penn Manufacturing Company, Inc.
- 8.4.1. Company overview
- 8.4.2. Key executives
- 8.4.3. Company snapshot
- 8.4.4. Operating business segments
- 8.4.5. Product portfolio
- 8.5. EXIDE INDUSTRIES LTD.
- 8.5.1. Company overview
- 8.5.2. Key executives
- 8.5.3. Company snapshot
- 8.5.4. Operating business segments
- 8.5.5. Product portfolio
- 8.5.6. Business performance
- 8.5.7. Key strategic moves and developments
- 8.6. Trojan Battery Company, LLC.
- 8.6.1. Company overview
- 8.6.2. Key executives
- 8.6.3. Company snapshot
- 8.6.4. Operating business segments
- 8.6.5. Product portfolio
- 8.6.6. Key strategic moves and developments
- 8.7. GS Yuasa International Ltd.
- 8.7.1. Company overview
- 8.7.2. Key executives
- 8.7.3. Company snapshot
- 8.7.4. Operating business segments
- 8.7.5. Product portfolio
- 8.7.6. Business performance
- 8.8. Flux Power
- 8.8.1. Company overview
- 8.8.2. Key executives
- 8.8.3. Company snapshot
- 8.8.4. Operating business segments
- 8.8.5. Product portfolio
- 8.8.6. Business performance
- 8.9. Zhejiang Narada Power Source Co., Ltd
- 8.9.1. Company overview
- 8.9.2. Key executives
- 8.9.3. Company snapshot
- 8.9.4. Operating business segments
- 8.9.5. Product portfolio
- 8.10. Electrovaya
- 8.10.1. Company overview
- 8.10.2. Key executives
- 8.10.3. Company snapshot
- 8.10.4. Operating business segments
- 8.10.5. Product portfolio
- 8.10.6. Business performance
- 8.10.7. Key strategic moves and developments
LIST OF TABLES
- TABLE 01. GLOBAL FORKLIFT BATTERY MARKET, BY APPLICATION, 2022-2032 ($MILLION)
- TABLE 02. FORKLIFT BATTERY MARKET FOR WAREHOUSES, BY REGION, 2022-2032 ($MILLION)
- TABLE 03. FORKLIFT BATTERY MARKET FOR MANUFACTURING, BY REGION, 2022-2032 ($MILLION)
- TABLE 04. FORKLIFT BATTERY MARKET FOR CONSTRUCTION, BY REGION, 2022-2032 ($MILLION)
- TABLE 05. FORKLIFT BATTERY MARKET FOR RETAIL AND WHOLESALE STORES, BY REGION, 2022-2032 ($MILLION)
- TABLE 06. FORKLIFT BATTERY MARKET FOR OTHERS, BY REGION, 2022-2032 ($MILLION)
- TABLE 07. GLOBAL FORKLIFT BATTERY MARKET, BY TYPE, 2022-2032 ($MILLION)
- TABLE 08. FORKLIFT BATTERY MARKET FOR LITHIUM ION (LI-ION), BY REGION, 2022-2032 ($MILLION)
- TABLE 09. FORKLIFT BATTERY MARKET FOR LEAD ACID BATTERY, BY REGION, 2022-2032 ($MILLION)
- TABLE 10. FORKLIFT BATTERY MARKET FOR OTHERS, BY REGION, 2022-2032 ($MILLION)
- TABLE 11. FORKLIFT BATTERY MARKET, BY REGION, 2022-2032 ($MILLION)
- TABLE 12. NORTH AMERICA FORKLIFT BATTERY MARKET, BY APPLICATION, 2022-2032 ($MILLION)
- TABLE 13. NORTH AMERICA FORKLIFT BATTERY MARKET, BY TYPE, 2022-2032 ($MILLION)
- TABLE 14. NORTH AMERICA FORKLIFT BATTERY MARKET, BY COUNTRY, 2022-2032 ($MILLION)
- TABLE 15. U.S. FORKLIFT BATTERY MARKET, BY APPLICATION, 2022-2032 ($MILLION)
- TABLE 16. U.S. FORKLIFT BATTERY MARKET, BY TYPE, 2022-2032 ($MILLION)
- TABLE 17. CANADA FORKLIFT BATTERY MARKET, BY APPLICATION, 2022-2032 ($MILLION)
- TABLE 18. CANADA FORKLIFT BATTERY MARKET, BY TYPE, 2022-2032 ($MILLION)
- TABLE 19. MEXICO FORKLIFT BATTERY MARKET, BY APPLICATION, 2022-2032 ($MILLION)
- TABLE 20. MEXICO FORKLIFT BATTERY MARKET, BY TYPE, 2022-2032 ($MILLION)
- TABLE 21. EUROPE FORKLIFT BATTERY MARKET, BY APPLICATION, 2022-2032 ($MILLION)
- TABLE 22. EUROPE FORKLIFT BATTERY MARKET, BY TYPE, 2022-2032 ($MILLION)
- TABLE 23. EUROPE FORKLIFT BATTERY MARKET, BY COUNTRY, 2022-2032 ($MILLION)
- TABLE 24. GERMANY FORKLIFT BATTERY MARKET, BY APPLICATION, 2022-2032 ($MILLION)
- TABLE 25. GERMANY FORKLIFT BATTERY MARKET, BY TYPE, 2022-2032 ($MILLION)
- TABLE 26. UK FORKLIFT BATTERY MARKET, BY APPLICATION, 2022-2032 ($MILLION)
- TABLE 27. UK FORKLIFT BATTERY MARKET, BY TYPE, 2022-2032 ($MILLION)
- TABLE 28. FRANCE FORKLIFT BATTERY MARKET, BY APPLICATION, 2022-2032 ($MILLION)
- TABLE 29. FRANCE FORKLIFT BATTERY MARKET, BY TYPE, 2022-2032 ($MILLION)
- TABLE 30. ITALY FORKLIFT BATTERY MARKET, BY APPLICATION, 2022-2032 ($MILLION)
- TABLE 31. ITALY FORKLIFT BATTERY MARKET, BY TYPE, 2022-2032 ($MILLION)
- TABLE 32. SPAIN FORKLIFT BATTERY MARKET, BY APPLICATION, 2022-2032 ($MILLION)
- TABLE 33. SPAIN FORKLIFT BATTERY MARKET, BY TYPE, 2022-2032 ($MILLION)
- TABLE 34. REST OF EUROPE FORKLIFT BATTERY MARKET, BY APPLICATION, 2022-2032 ($MILLION)
- TABLE 35. REST OF EUROPE FORKLIFT BATTERY MARKET, BY TYPE, 2022-2032 ($MILLION)
- TABLE 36. ASIA-PACIFIC FORKLIFT BATTERY MARKET, BY APPLICATION, 2022-2032 ($MILLION)
- TABLE 37. ASIA-PACIFIC FORKLIFT BATTERY MARKET, BY TYPE, 2022-2032 ($MILLION)
- TABLE 38. ASIA-PACIFIC FORKLIFT BATTERY MARKET, BY COUNTRY, 2022-2032 ($MILLION)
- TABLE 39. CHINA FORKLIFT BATTERY MARKET, BY APPLICATION, 2022-2032 ($MILLION)
- TABLE 40. CHINA FORKLIFT BATTERY MARKET, BY TYPE, 2022-2032 ($MILLION)
- TABLE 41. JAPAN FORKLIFT BATTERY MARKET, BY APPLICATION, 2022-2032 ($MILLION)
- TABLE 42. JAPAN FORKLIFT BATTERY MARKET, BY TYPE, 2022-2032 ($MILLION)
- TABLE 43. INDIA FORKLIFT BATTERY MARKET, BY APPLICATION, 2022-2032 ($MILLION)
- TABLE 44. INDIA FORKLIFT BATTERY MARKET, BY TYPE, 2022-2032 ($MILLION)
- TABLE 45. SOUTH KOREA FORKLIFT BATTERY MARKET, BY APPLICATION, 2022-2032 ($MILLION)
- TABLE 46. SOUTH KOREA FORKLIFT BATTERY MARKET, BY TYPE, 2022-2032 ($MILLION)
- TABLE 47. AUSTRALIA FORKLIFT BATTERY MARKET, BY APPLICATION, 2022-2032 ($MILLION)
- TABLE 48. AUSTRALIA FORKLIFT BATTERY MARKET, BY TYPE, 2022-2032 ($MILLION)
- TABLE 49. REST OF ASIA-PACIFIC FORKLIFT BATTERY MARKET, BY APPLICATION, 2022-2032 ($MILLION)
- TABLE 50. REST OF ASIA-PACIFIC FORKLIFT BATTERY MARKET, BY TYPE, 2022-2032 ($MILLION)
- TABLE 51. LAMEA FORKLIFT BATTERY MARKET, BY APPLICATION, 2022-2032 ($MILLION)
- TABLE 52. LAMEA FORKLIFT BATTERY MARKET, BY TYPE, 2022-2032 ($MILLION)
- TABLE 53. LAMEA FORKLIFT BATTERY MARKET, BY COUNTRY, 2022-2032 ($MILLION)
- TABLE 54. BRAZIL FORKLIFT BATTERY MARKET, BY APPLICATION, 2022-2032 ($MILLION)
- TABLE 55. BRAZIL FORKLIFT BATTERY MARKET, BY TYPE, 2022-2032 ($MILLION)
- TABLE 56. SAUDI ARABIA FORKLIFT BATTERY MARKET, BY APPLICATION, 2022-2032 ($MILLION)
- TABLE 57. SAUDI ARABIA FORKLIFT BATTERY MARKET, BY TYPE, 2022-2032 ($MILLION)
- TABLE 58. SOUTH AFRICA FORKLIFT BATTERY MARKET, BY APPLICATION, 2022-2032 ($MILLION)
- TABLE 59. SOUTH AFRICA FORKLIFT BATTERY MARKET, BY TYPE, 2022-2032 ($MILLION)
- TABLE 60. REST OF LAMEA FORKLIFT BATTERY MARKET, BY APPLICATION, 2022-2032 ($MILLION)
- TABLE 61. REST OF LAMEA FORKLIFT BATTERY MARKET, BY TYPE, 2022-2032 ($MILLION)
- TABLE 62. IBERDROLA S.A.: KEY EXECUTIVES
- TABLE 63. IBERDROLA S.A.: COMPANY SNAPSHOT
- TABLE 64. IBERDROLA S.A.: PRODUCT SEGMENTS
- TABLE 65. IBERDROLA S.A.: PRODUCT PORTFOLIO
- TABLE 66. AMARA RAJA BATTERIES LTD.: KEY EXECUTIVES
- TABLE 67. AMARA RAJA BATTERIES LTD.: COMPANY SNAPSHOT
- TABLE 68. AMARA RAJA BATTERIES LTD.: PRODUCT SEGMENTS
- TABLE 69. AMARA RAJA BATTERIES LTD.: SERVICE SEGMENTS
- TABLE 70. AMARA RAJA BATTERIES LTD.: PRODUCT PORTFOLIO
- TABLE 71. ENERSYS: KEY EXECUTIVES
- TABLE 72. ENERSYS: COMPANY SNAPSHOT
- TABLE 73. ENERSYS: PRODUCT SEGMENTS
- TABLE 74. ENERSYS: PRODUCT PORTFOLIO
- TABLE 75. ENERSYS: KEY STRATERGIES
- TABLE 76. EAST PENN MANUFACTURING COMPANY, INC.: KEY EXECUTIVES
- TABLE 77. EAST PENN MANUFACTURING COMPANY, INC.: COMPANY SNAPSHOT
- TABLE 78. EAST PENN MANUFACTURING COMPANY, INC.: PRODUCT SEGMENTS
- TABLE 79. EAST PENN MANUFACTURING COMPANY, INC.: SERVICE SEGMENTS
- TABLE 80. EAST PENN MANUFACTURING COMPANY, INC.: PRODUCT PORTFOLIO
- TABLE 81. EXIDE INDUSTRIES LTD.: KEY EXECUTIVES
- TABLE 82. EXIDE INDUSTRIES LTD.: COMPANY SNAPSHOT
- TABLE 83. EXIDE INDUSTRIES LTD.: PRODUCT SEGMENTS
- TABLE 84. EXIDE INDUSTRIES LTD.: PRODUCT PORTFOLIO
- TABLE 85. EXIDE INDUSTRIES LTD.: KEY STRATERGIES
- TABLE 86. TROJAN BATTERY COMPANY, LLC.: KEY EXECUTIVES
- TABLE 87. TROJAN BATTERY COMPANY, LLC.: COMPANY SNAPSHOT
- TABLE 88. TROJAN BATTERY COMPANY, LLC.: PRODUCT SEGMENTS
- TABLE 89. TROJAN BATTERY COMPANY, LLC.: SERVICE SEGMENTS
- TABLE 90. TROJAN BATTERY COMPANY, LLC.: PRODUCT PORTFOLIO
- TABLE 91. TROJAN BATTERY COMPANY, LLC.: KEY STRATERGIES
- TABLE 92. GS YUASA INTERNATIONAL LTD.: KEY EXECUTIVES
- TABLE 93. GS YUASA INTERNATIONAL LTD.: COMPANY SNAPSHOT
- TABLE 94. GS YUASA INTERNATIONAL LTD.: PRODUCT SEGMENTS
- TABLE 95. GS YUASA INTERNATIONAL LTD.: PRODUCT PORTFOLIO
- TABLE 96. FLUX POWER: KEY EXECUTIVES
- TABLE 97. FLUX POWER: COMPANY SNAPSHOT
- TABLE 98. FLUX POWER: PRODUCT SEGMENTS
- TABLE 99. FLUX POWER: PRODUCT PORTFOLIO
- TABLE 100. ZHEJIANG NARADA POWER SOURCE CO., LTD: KEY EXECUTIVES
- TABLE 101. ZHEJIANG NARADA POWER SOURCE CO., LTD: COMPANY SNAPSHOT
- TABLE 102. ZHEJIANG NARADA POWER SOURCE CO., LTD: PRODUCT SEGMENTS
- TABLE 103. ZHEJIANG NARADA POWER SOURCE CO., LTD: PRODUCT PORTFOLIO
- TABLE 104. ELECTROVAYA: KEY EXECUTIVES
- TABLE 105. ELECTROVAYA: COMPANY SNAPSHOT
- TABLE 106. ELECTROVAYA: PRODUCT SEGMENTS
- TABLE 107. ELECTROVAYA: PRODUCT PORTFOLIO
- TABLE 108. ELECTROVAYA: KEY STRATERGIES
LIST OF FIGURES
- FIGURE 01. FORKLIFT BATTERY MARKET, 2022-2032
- FIGURE 02. SEGMENTATION OF FORKLIFT BATTERY MARKET,2022-2032
- FIGURE 03. TOP IMPACTING FACTORS IN FORKLIFT BATTERY MARKET (2022 TO 2032)
- FIGURE 04. TOP INVESTMENT POCKETS IN FORKLIFT BATTERY MARKET (2023-2032)
- FIGURE 05. LOW BARGAINING POWER OF SUPPLIERS
- FIGURE 06. LOW THREAT OF NEW ENTRANTS
- FIGURE 07. LOW THREAT OF SUBSTITUTES
- FIGURE 08. LOW INTENSITY OF RIVALRY
- FIGURE 09. LOW BARGAINING POWER OF BUYERS
- FIGURE 10. GLOBAL FORKLIFT BATTERY MARKET:DRIVERS, RESTRAINTS AND OPPORTUNITIES
- FIGURE 11. PATENT ANALYSIS BY COMPANY
- FIGURE 12. PATENT ANALYSIS BY COUNTRY
- FIGURE 13. FORKLIFT BATTERY MARKET, BY APPLICATION, 2022 AND 2032(%)
- FIGURE 14. COMPARATIVE SHARE ANALYSIS OF FORKLIFT BATTERY MARKET FOR WAREHOUSES, BY COUNTRY 2022 AND 2032(%)
- FIGURE 15. COMPARATIVE SHARE ANALYSIS OF FORKLIFT BATTERY MARKET FOR MANUFACTURING, BY COUNTRY 2022 AND 2032(%)
- FIGURE 16. COMPARATIVE SHARE ANALYSIS OF FORKLIFT BATTERY MARKET FOR CONSTRUCTION, BY COUNTRY 2022 AND 2032(%)
- FIGURE 17. COMPARATIVE SHARE ANALYSIS OF FORKLIFT BATTERY MARKET FOR RETAIL AND WHOLESALE STORES, BY COUNTRY 2022 AND 2032(%)
- FIGURE 18. COMPARATIVE SHARE ANALYSIS OF FORKLIFT BATTERY MARKET FOR OTHERS, BY COUNTRY 2022 AND 2032(%)
- FIGURE 19. FORKLIFT BATTERY MARKET, BY TYPE, 2022 AND 2032(%)
- FIGURE 20. COMPARATIVE SHARE ANALYSIS OF FORKLIFT BATTERY MARKET FOR LITHIUM ION (LI-ION), BY COUNTRY 2022 AND 2032(%)
- FIGURE 21. COMPARATIVE SHARE ANALYSIS OF FORKLIFT BATTERY MARKET FOR LEAD ACID BATTERY, BY COUNTRY 2022 AND 2032(%)
- FIGURE 22. COMPARATIVE SHARE ANALYSIS OF FORKLIFT BATTERY MARKET FOR OTHERS, BY COUNTRY 2022 AND 2032(%)
- FIGURE 23. FORKLIFT BATTERY MARKET BY REGION, 2022 AND 2032(%)
- FIGURE 24. U.S. FORKLIFT BATTERY MARKET, 2022-2032 ($MILLION)
- FIGURE 25. CANADA FORKLIFT BATTERY MARKET, 2022-2032 ($MILLION)
- FIGURE 26. MEXICO FORKLIFT BATTERY MARKET, 2022-2032 ($MILLION)
- FIGURE 27. GERMANY FORKLIFT BATTERY MARKET, 2022-2032 ($MILLION)
- FIGURE 28. UK FORKLIFT BATTERY MARKET, 2022-2032 ($MILLION)
- FIGURE 29. FRANCE FORKLIFT BATTERY MARKET, 2022-2032 ($MILLION)
- FIGURE 30. ITALY FORKLIFT BATTERY MARKET, 2022-2032 ($MILLION)
- FIGURE 31. SPAIN FORKLIFT BATTERY MARKET, 2022-2032 ($MILLION)
- FIGURE 32. REST OF EUROPE FORKLIFT BATTERY MARKET, 2022-2032 ($MILLION)
- FIGURE 33. CHINA FORKLIFT BATTERY MARKET, 2022-2032 ($MILLION)
- FIGURE 34. JAPAN FORKLIFT BATTERY MARKET, 2022-2032 ($MILLION)
- FIGURE 35. INDIA FORKLIFT BATTERY MARKET, 2022-2032 ($MILLION)
- FIGURE 36. SOUTH KOREA FORKLIFT BATTERY MARKET, 2022-2032 ($MILLION)
- FIGURE 37. AUSTRALIA FORKLIFT BATTERY MARKET, 2022-2032 ($MILLION)
- FIGURE 38. REST OF ASIA-PACIFIC FORKLIFT BATTERY MARKET, 2022-2032 ($MILLION)
- FIGURE 39. BRAZIL FORKLIFT BATTERY MARKET, 2022-2032 ($MILLION)
- FIGURE 40. SAUDI ARABIA FORKLIFT BATTERY MARKET, 2022-2032 ($MILLION)
- FIGURE 41. SOUTH AFRICA FORKLIFT BATTERY MARKET, 2022-2032 ($MILLION)
- FIGURE 42. REST OF LAMEA FORKLIFT BATTERY MARKET, 2022-2032 ($MILLION)
- FIGURE 43. TOP WINNING STRATEGIES, BY YEAR (2019-2023)
- FIGURE 44. TOP WINNING STRATEGIES, BY DEVELOPMENT (2019-2023)
- FIGURE 45. TOP WINNING STRATEGIES, BY COMPANY (2019-2023)
- FIGURE 46. PRODUCT MAPPING OF TOP 10 PLAYERS
- FIGURE 47. COMPETITIVE DASHBOARD
- FIGURE 48. COMPETITIVE HEATMAP: FORKLIFT BATTERY MARKET
- FIGURE 49. TOP PLAYER POSITIONING, 2022
- FIGURE 50. IBERDROLA S.A.: NET REVENUE, 2020-2022 ($MILLION)
- FIGURE 51. IBERDROLA S.A.: REVENUE SHARE BY SEGMENT, 2022 (%)
- FIGURE 52. IBERDROLA S.A.: REVENUE SHARE BY REGION, 2022 (%)
- FIGURE 53. AMARA RAJA BATTERIES LTD.: NET SALES, 2020-2022 ($MILLION)
- FIGURE 54. AMARA RAJA BATTERIES LTD.: REVENUE SHARE BY SEGMENT, 2022 (%)
- FIGURE 55. AMARA RAJA BATTERIES LTD.: REVENUE SHARE BY REGION, 2022 (%)
- FIGURE 56. ENERSYS: NET SALES, 2020-2022 ($MILLION)
- FIGURE 57. ENERSYS: REVENUE SHARE BY SEGMENT, 2022 (%)
- FIGURE 58. EXIDE INDUSTRIES LTD.: NET REVENUE, 2020-2022 ($MILLION)
- FIGURE 59. EXIDE INDUSTRIES LTD.: RESEARCH & DEVELOPMENT EXPENDITURE, 2020-2022 ($MILLION)
- FIGURE 60. EXIDE INDUSTRIES LTD.: REVENUE SHARE BY REGION, 2022 (%)
- FIGURE 61. EXIDE INDUSTRIES LTD.: REVENUE SHARE BY SEGMENT, 2022 (%)
- FIGURE 62. GS YUASA INTERNATIONAL LTD.: RESEARCH & DEVELOPMENT EXPENDITURE, 2020-2022 ($MILLION)
- FIGURE 63. GS YUASA INTERNATIONAL LTD.: NET SALES, 2020-2022 ($MILLION)
- FIGURE 64. GS YUASA INTERNATIONAL LTD.: REVENUE SHARE BY SEGMENT, 2022 (%)
- FIGURE 65. FLUX POWER: NET REVENUE, 2020-2022 ($MILLION)
- FIGURE 66. FLUX POWER: RESEARCH & DEVELOPMENT EXPENDITURE, 2020-2022 ($MILLION)
- FIGURE 67. ELECTROVAYA: NET REVENUE, 2020-2022 ($MILLION)
- FIGURE 68. ELECTROVAYA: RESEARCH & DEVELOPMENT EXPENDITURE, 2020-2022 ($MILLION)
- FIGURE 69. ELECTROVAYA: REVENUE SHARE BY SEGMENT, 2022 (%)
- FIGURE 70. ELECTROVAYA: REVENUE SHARE BY REGION, 2022 (%)

