
PUBLISHER: Allied Market Research | PRODUCT CODE: 1414957

PUBLISHER: Allied Market Research | PRODUCT CODE: 1414957
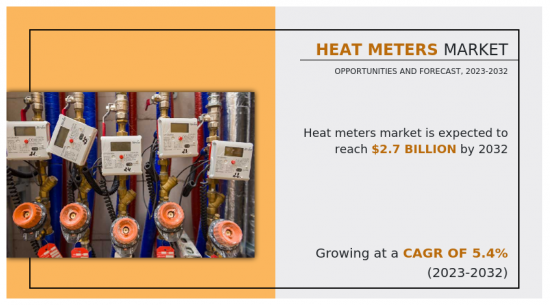
Heat Meters Market By Type (Mechanical, Static), By Connectivity (Wireless, Wired), By Application (Residential, Commercial, Industrial): Global Opportunity Analysis and Industry Forecast, 2023-2032
According to a new report published by Allied Market Research, titled, "Heat Meters Market," The heat meter market size was valued at $1.6 billion in 2022, and is estimated to reach $2.7 billion by 2032, growing at a CAGR of 5.4% from 2023 to 2032.
A heat meter is a device used to measure the amount of heat energy in a system. It is commonly employed in buildings to monitor the amount of thermal energy consumed for heating purposes. Heat meters typically consist of sensors to measure the temperature of the water or fluid entering and leaving a heating system, along with a flow meter to measure the volume of fluid passing through.
The rise in demand for energy efficiency is closely linked to broader efforts toward sustainability. Heat meters contribute to sustainability initiatives by enabling users to track and manage their energy usage effectively. They encourage the adoption of eco-friendly practices, reducing carbon footprints and contributing to a more sustainable future. In addition, heat meters are integral components of smart energy management systems. Increase in adoption of smart technologies in energy management relies on accurate data provided by heat meters. They enable the implementation of intelligent, data-driven solutions that optimize energy use, reduce waste, and promote efficiency. All these factors drive the demand for the heat meter.
However, the high upfront expense associated with heat meters impedes their widespread adoption. This initial cost deters investments, especially for large-scale implementations in district heating or industrial settings. For individual users or smaller businesses, the substantial initial investment might outweigh perceived benefits, impacting adoption rates. However, despite the upfront expense heat meters offer long-term benefits through energy savings, fair billing, and regulatory compliance.
The integration of heat meters with smart technologies marks a significant advancement in energy management. By leveraging interconnected systems and data analytics, smart heat meters offer real-time insights into energy consumption. They enable remote monitoring and control, empowering users to manage heating systems efficiently. Predictive maintenance algorithms help detect issues early, ensuring system reliability. Integration into smart grids allows for intelligent energy distribution and optimized usage, reducing waste. All these factors are anticipated to offer new growth opportunities in the heat meter market forecast.
The heat meter market is segmented on the basis of type, connectivity, application, and region. On the basis of type, the market is bifurcated into mechanical and static. The static type accounted for three-fourths of the global heat meter market share in 2022 and is expected to maintain its dominance during the forecast period. Static heat meters have the ability to measure heat without any moving parts. This design characteristic contributes to their reliability and durability, as there are fewer components prone to wear and tear.
On the basis of connectivity, the market is divided into wireless and wired. Wired segment accounted for less than two-thirds of the global heat meter market share in 2022 and is expected to maintain its dominance during the forecast period. As global initiatives emphasize energy efficiency and sustainability, wired heat meters are being deployed to optimize energy usage. They play a crucial role in identifying inefficiencies in heating systems, enabling consumers and businesses to make informed decisions to reduce energy consumption and carbon footprint. All these factors increase the demand for the wired heat meter during the forecast period.
On the basis of application, the market is segmented into residential, commercial, and industrial. Residential segment accounted for less than half of global heat meter market share in 2022 and is expected to maintain its dominance during the forecast period. In residential complexes or multi-family dwellings, individual heat meters allow for accurate measurement of energy consumption in each unit. This enables fair and transparent billing, ensuring that residents only pay for the energy they use. In addition, it promotes a sense of fairness among occupants and encourages energy-conscious behaviors, leading to reduced waste and more efficient use of resources.
Region-wise, the market is analyzed across North America, Europe, Asia-Pacific, and LAMEA. North America accounted for less than two-fifths of the global heat meter market share in 2022 and is expected to maintain its dominance during the forecast period. The stringent building efficiency standards and regulations, driven by initiatives such as LEED certification and regional energy codes, prompt the installation of heat meters in new constructions and building retrofits. Heat meters enable compliance with these standards by providing accurate data on energy usage, promoting transparent billing, and facilitating the implementation of energy-efficient technologies and practices in buildings. All these factors are anticipated to offer new growth opportunities for the heat meters in North America during the forecast period.
Key players in the heat meter industry include: Danfoss A/S, Diehl Stiftung & Co. KG, Honeywell International Inc., Ista Energy Solutions Limited, Kamstrup, Landis+Gyr Group AG, Qundis, Sensus, Siemens AG, and Sontex SA. Apart from these major players, there are other key players in the heat meter market growth. These include Apator Group, Krohne Messtechnik GmbH, Axioma Metering, Secure Meters, Zenner, Schlumberger Limited, Itron, Bmeters Srl, Micronics Ltd, and Diehl Stiftung & Co. KG.
Key Benefits For Stakeholders
- This report provides a quantitative analysis of the market segments, current trends, estimations, and dynamics of the heat meter market analysis from 2022 to 2032 to identify the prevailing heat meter market opportunities.
- The market research is offered along with information related to key drivers, restraints, and opportunities.
- Porter's five forces analysis highlights the potency of buyers and suppliers to enable stakeholders make profit-oriented business decisions and strengthen their supplier-buyer network.
- In-depth analysis of the heat meter market value and segmentation assists to determine the prevailing market opportunities.
- Major countries in each region are mapped according to their revenue contribution to the global market.
- Market player positioning facilitates benchmarking and provides a clear understanding of the present position of the market players.
- The report includes the analysis of the regional as well as global heat meter market trends, key players, market segments, application areas, and market growth strategies.
Additional benefits you will get with this purchase are:
- Quarterly Update and* (only available with a corporate license, on listed price)
- 5 additional Company Profile of client Choice pre- or Post-purchase, as a free update.
- Free Upcoming Version on the Purchase of Five and Enterprise User License.
- 16 analyst hours of support* (post-purchase, if you find additional data requirements upon review of the report, you may receive support amounting to 16 analyst hours to solve questions, and post-sale queries)
- 15% Free Customization* (in case the scope or segment of the report does not match your requirements, 15% is equivalent to 3 working days of free work, applicable once)
- Free data Pack on the Five and Enterprise User License. (Excel version of the report)
- Free Updated report if the report is 6-12 months old or older.
- 24-hour priority response*
- Free Industry updates and white papers.
Possible Customization with this report (with additional cost and timeline, please talk to the sales executive to know more)
- Analysis of raw material in a product (by %)
- End user preferences and pain points
- Industry life cycle assessment, by region
- Investment Opportunities
- Product Benchmarking / Product specification and applications
- Product Life Cycles
- Technology Trend Analysis
- Go To Market Strategy
- Market share analysis of players by products/segments
- New Product Development/ Product Matrix of Key Players
- Regulatory Guidelines
- Additional company profiles with specific to client's interest
- Additional country or region analysis- market size and forecast
- Expanded list for Company Profiles
- Historic market data
- Key player details (including location, contact details, supplier/vendor network etc. in excel format)
- List of customers/consumers/raw material suppliers- value chain analysis
- Market share analysis of players at global/region/country level
- SWOT Analysis
Key Market Segments
By Connectivity
- Wireless
- Wired
By Application
- Residential
- Commercial
- Industrial
By Type
- Mechanical
- Static
By Region
- North America
- U.S.
- Canada
- Mexico
- Europe
- Germany
- France
- Italy
- Spain
- UK
- Rest of Europe
- Asia-Pacific
- China
- Japan
- India
- South Korea
- Australia
- Rest of Asia-Pacific
- LAMEA
- Brazil
- South Africa
- Saudi Arabia
- Rest of LAMEA
Key Market Players:
- Honeywell International Inc.
- Landis+Gyr Group AG
- Kamstrup
- Sensus
- Ista Energy Solutions Limited
- QUNDIS GmbH
- Diehl Stiftung & Co. KG
- Siemens AG
- Sontex SA
- Danfoss A/S
TABLE OF CONTENTS
CHAPTER 1: INTRODUCTION
- 1.1. Report description
- 1.2. Key market segments
- 1.3. Key benefits to the stakeholders
- 1.4. Research methodology
- 1.4.1. Primary research
- 1.4.2. Secondary research
- 1.4.3. Analyst tools and models
CHAPTER 2: EXECUTIVE SUMMARY
- 2.1. CXO Perspective
CHAPTER 3: MARKET OVERVIEW
- 3.1. Market definition and scope
- 3.2. Key findings
- 3.2.1. Top impacting factors
- 3.2.2. Top investment pockets
- 3.3. Porter's five forces analysis
- 3.3.1. Moderate bargaining power of suppliers
- 3.3.2. High threat of new entrants
- 3.3.3. Moderate threat of substitutes
- 3.3.4. Moderate intensity of rivalry
- 3.3.5. Moderate bargaining power of buyers
- 3.4. Market dynamics
- 3.4.1. Drivers
- 3.4.1.1. Increase in adoption of district heating system
- 3.4.1.2. Rise in demand for energy efficiency
- 3.4.2. Restraints
- 3.4.2.1. High cost of investment
- 3.4.3. Opportunities
- 3.4.3.1. Integration with smart technologies
- 3.4.1. Drivers
- 3.5. Value Chain Analysis
- 3.6. Key Regulation Analysis
- 3.7. Patent Landscape
CHAPTER 4: HEAT METERS MARKET, BY TYPE
- 4.1. Overview
- 4.1.1. Market size and forecast
- 4.2. Mechanical
- 4.2.1. Key market trends, growth factors and opportunities
- 4.2.2. Market size and forecast, by region
- 4.2.3. Market share analysis by country
- 4.3. Static
- 4.3.1. Key market trends, growth factors and opportunities
- 4.3.2. Market size and forecast, by region
- 4.3.3. Market share analysis by country
CHAPTER 5: HEAT METERS MARKET, BY CONNECTIVITY
- 5.1. Overview
- 5.1.1. Market size and forecast
- 5.2. Wireless
- 5.2.1. Key market trends, growth factors and opportunities
- 5.2.2. Market size and forecast, by region
- 5.2.3. Market share analysis by country
- 5.3. Wired
- 5.3.1. Key market trends, growth factors and opportunities
- 5.3.2. Market size and forecast, by region
- 5.3.3. Market share analysis by country
CHAPTER 6: HEAT METERS MARKET, BY APPLICATION
- 6.1. Overview
- 6.1.1. Market size and forecast
- 6.2. Residential
- 6.2.1. Key market trends, growth factors and opportunities
- 6.2.2. Market size and forecast, by region
- 6.2.3. Market share analysis by country
- 6.3. Commercial
- 6.3.1. Key market trends, growth factors and opportunities
- 6.3.2. Market size and forecast, by region
- 6.3.3. Market share analysis by country
- 6.4. Industrial
- 6.4.1. Key market trends, growth factors and opportunities
- 6.4.2. Market size and forecast, by region
- 6.4.3. Market share analysis by country
CHAPTER 7: HEAT METERS MARKET, BY REGION
- 7.1. Overview
- 7.1.1. Market size and forecast By Region
- 7.2. North America
- 7.2.1. Key market trends, growth factors and opportunities
- 7.2.2. Market size and forecast, by Type
- 7.2.3. Market size and forecast, by Connectivity
- 7.2.4. Market size and forecast, by Application
- 7.2.5. Market size and forecast, by country
- 7.2.5.1. U.S.
- 7.2.5.1.1. Market size and forecast, by Type
- 7.2.5.1.2. Market size and forecast, by Connectivity
- 7.2.5.1.3. Market size and forecast, by Application
- 7.2.5.2. Canada
- 7.2.5.2.1. Market size and forecast, by Type
- 7.2.5.2.2. Market size and forecast, by Connectivity
- 7.2.5.2.3. Market size and forecast, by Application
- 7.2.5.3. Mexico
- 7.2.5.3.1. Market size and forecast, by Type
- 7.2.5.3.2. Market size and forecast, by Connectivity
- 7.2.5.3.3. Market size and forecast, by Application
- 7.3. Europe
- 7.3.1. Key market trends, growth factors and opportunities
- 7.3.2. Market size and forecast, by Type
- 7.3.3. Market size and forecast, by Connectivity
- 7.3.4. Market size and forecast, by Application
- 7.3.5. Market size and forecast, by country
- 7.3.5.1. Germany
- 7.3.5.1.1. Market size and forecast, by Type
- 7.3.5.1.2. Market size and forecast, by Connectivity
- 7.3.5.1.3. Market size and forecast, by Application
- 7.3.5.2. France
- 7.3.5.2.1. Market size and forecast, by Type
- 7.3.5.2.2. Market size and forecast, by Connectivity
- 7.3.5.2.3. Market size and forecast, by Application
- 7.3.5.3. Italy
- 7.3.5.3.1. Market size and forecast, by Type
- 7.3.5.3.2. Market size and forecast, by Connectivity
- 7.3.5.3.3. Market size and forecast, by Application
- 7.3.5.4. Spain
- 7.3.5.4.1. Market size and forecast, by Type
- 7.3.5.4.2. Market size and forecast, by Connectivity
- 7.3.5.4.3. Market size and forecast, by Application
- 7.3.5.5. UK
- 7.3.5.5.1. Market size and forecast, by Type
- 7.3.5.5.2. Market size and forecast, by Connectivity
- 7.3.5.5.3. Market size and forecast, by Application
- 7.3.5.6. Rest of Europe
- 7.3.5.6.1. Market size and forecast, by Type
- 7.3.5.6.2. Market size and forecast, by Connectivity
- 7.3.5.6.3. Market size and forecast, by Application
- 7.4. Asia-Pacific
- 7.4.1. Key market trends, growth factors and opportunities
- 7.4.2. Market size and forecast, by Type
- 7.4.3. Market size and forecast, by Connectivity
- 7.4.4. Market size and forecast, by Application
- 7.4.5. Market size and forecast, by country
- 7.4.5.1. China
- 7.4.5.1.1. Market size and forecast, by Type
- 7.4.5.1.2. Market size and forecast, by Connectivity
- 7.4.5.1.3. Market size and forecast, by Application
- 7.4.5.2. Japan
- 7.4.5.2.1. Market size and forecast, by Type
- 7.4.5.2.2. Market size and forecast, by Connectivity
- 7.4.5.2.3. Market size and forecast, by Application
- 7.4.5.3. India
- 7.4.5.3.1. Market size and forecast, by Type
- 7.4.5.3.2. Market size and forecast, by Connectivity
- 7.4.5.3.3. Market size and forecast, by Application
- 7.4.5.4. South Korea
- 7.4.5.4.1. Market size and forecast, by Type
- 7.4.5.4.2. Market size and forecast, by Connectivity
- 7.4.5.4.3. Market size and forecast, by Application
- 7.4.5.5. Australia
- 7.4.5.5.1. Market size and forecast, by Type
- 7.4.5.5.2. Market size and forecast, by Connectivity
- 7.4.5.5.3. Market size and forecast, by Application
- 7.4.5.6. Rest of Asia-Pacific
- 7.4.5.6.1. Market size and forecast, by Type
- 7.4.5.6.2. Market size and forecast, by Connectivity
- 7.4.5.6.3. Market size and forecast, by Application
- 7.5. LAMEA
- 7.5.1. Key market trends, growth factors and opportunities
- 7.5.2. Market size and forecast, by Type
- 7.5.3. Market size and forecast, by Connectivity
- 7.5.4. Market size and forecast, by Application
- 7.5.5. Market size and forecast, by country
- 7.5.5.1. Brazil
- 7.5.5.1.1. Market size and forecast, by Type
- 7.5.5.1.2. Market size and forecast, by Connectivity
- 7.5.5.1.3. Market size and forecast, by Application
- 7.5.5.2. South Africa
- 7.5.5.2.1. Market size and forecast, by Type
- 7.5.5.2.2. Market size and forecast, by Connectivity
- 7.5.5.2.3. Market size and forecast, by Application
- 7.5.5.3. Saudi Arabia
- 7.5.5.3.1. Market size and forecast, by Type
- 7.5.5.3.2. Market size and forecast, by Connectivity
- 7.5.5.3.3. Market size and forecast, by Application
- 7.5.5.4. Rest of LAMEA
- 7.5.5.4.1. Market size and forecast, by Type
- 7.5.5.4.2. Market size and forecast, by Connectivity
- 7.5.5.4.3. Market size and forecast, by Application
CHAPTER 8: COMPETITIVE LANDSCAPE
- 8.1. Introduction
- 8.2. Top winning strategies
- 8.3. Product mapping of top 10 player
- 8.4. Competitive dashboard
- 8.5. Competitive heatmap
- 8.6. Top player positioning, 2022
CHAPTER 9: COMPANY PROFILES
- 9.1. Danfoss A/S
- 9.1.1. Company overview
- 9.1.2. Key executives
- 9.1.3. Company snapshot
- 9.1.4. Operating business segments
- 9.1.5. Product portfolio
- 9.1.6. Business performance
- 9.2. Diehl Stiftung & Co. KG
- 9.2.1. Company overview
- 9.2.2. Key executives
- 9.2.3. Company snapshot
- 9.2.4. Operating business segments
- 9.2.5. Product portfolio
- 9.2.6. Business performance
- 9.2.7. Key strategic moves and developments
- 9.3. Honeywell International Inc.
- 9.3.1. Company overview
- 9.3.2. Key executives
- 9.3.3. Company snapshot
- 9.3.4. Operating business segments
- 9.3.5. Product portfolio
- 9.3.6. Business performance
- 9.4. Ista Energy Solutions Limited
- 9.4.1. Company overview
- 9.4.2. Key executives
- 9.4.3. Company snapshot
- 9.4.4. Operating business segments
- 9.4.5. Product portfolio
- 9.5. Kamstrup
- 9.5.1. Company overview
- 9.5.2. Key executives
- 9.5.3. Company snapshot
- 9.5.4. Operating business segments
- 9.5.5. Product portfolio
- 9.6. Landis+Gyr Group AG
- 9.6.1. Company overview
- 9.6.2. Key executives
- 9.6.3. Company snapshot
- 9.6.4. Operating business segments
- 9.6.5. Product portfolio
- 9.6.6. Business performance
- 9.6.7. Key strategic moves and developments
- 9.7. QUNDIS GmbH
- 9.7.1. Company overview
- 9.7.2. Key executives
- 9.7.3. Company snapshot
- 9.7.4. Operating business segments
- 9.7.5. Product portfolio
- 9.8. Sensus
- 9.8.1. Company overview
- 9.8.2. Key executives
- 9.8.3. Company snapshot
- 9.8.4. Operating business segments
- 9.8.5. Product portfolio
- 9.8.6. Key strategic moves and developments
- 9.9. Siemens AG
- 9.9.1. Company overview
- 9.9.2. Key executives
- 9.9.3. Company snapshot
- 9.9.4. Operating business segments
- 9.9.5. Product portfolio
- 9.9.6. Business performance
- 9.10. Sontex SA
- 9.10.1. Company overview
- 9.10.2. Key executives
- 9.10.3. Company snapshot
- 9.10.4. Operating business segments
- 9.10.5. Product portfolio
LIST OF TABLES
- TABLE 01. GLOBAL HEAT METERS MARKET, BY TYPE, 2022-2032 ($MILLION)
- TABLE 02. HEAT METERS MARKET FOR MECHANICAL, BY REGION, 2022-2032 ($MILLION)
- TABLE 03. HEAT METERS MARKET FOR STATIC, BY REGION, 2022-2032 ($MILLION)
- TABLE 04. GLOBAL HEAT METERS MARKET, BY CONNECTIVITY, 2022-2032 ($MILLION)
- TABLE 05. HEAT METERS MARKET FOR WIRELESS, BY REGION, 2022-2032 ($MILLION)
- TABLE 06. HEAT METERS MARKET FOR WIRED, BY REGION, 2022-2032 ($MILLION)
- TABLE 07. GLOBAL HEAT METERS MARKET, BY APPLICATION, 2022-2032 ($MILLION)
- TABLE 08. HEAT METERS MARKET FOR RESIDENTIAL, BY REGION, 2022-2032 ($MILLION)
- TABLE 09. HEAT METERS MARKET FOR COMMERCIAL, BY REGION, 2022-2032 ($MILLION)
- TABLE 10. HEAT METERS MARKET FOR INDUSTRIAL, BY REGION, 2022-2032 ($MILLION)
- TABLE 11. HEAT METERS MARKET, BY REGION, 2022-2032 ($MILLION)
- TABLE 12. NORTH AMERICA HEAT METERS MARKET, BY TYPE, 2022-2032 ($MILLION)
- TABLE 13. NORTH AMERICA HEAT METERS MARKET, BY CONNECTIVITY, 2022-2032 ($MILLION)
- TABLE 14. NORTH AMERICA HEAT METERS MARKET, BY APPLICATION, 2022-2032 ($MILLION)
- TABLE 15. NORTH AMERICA HEAT METERS MARKET, BY COUNTRY, 2022-2032 ($MILLION)
- TABLE 16. U.S. HEAT METERS MARKET, BY TYPE, 2022-2032 ($MILLION)
- TABLE 17. U.S. HEAT METERS MARKET, BY CONNECTIVITY, 2022-2032 ($MILLION)
- TABLE 18. U.S. HEAT METERS MARKET, BY APPLICATION, 2022-2032 ($MILLION)
- TABLE 19. CANADA HEAT METERS MARKET, BY TYPE, 2022-2032 ($MILLION)
- TABLE 20. CANADA HEAT METERS MARKET, BY CONNECTIVITY, 2022-2032 ($MILLION)
- TABLE 21. CANADA HEAT METERS MARKET, BY APPLICATION, 2022-2032 ($MILLION)
- TABLE 22. MEXICO HEAT METERS MARKET, BY TYPE, 2022-2032 ($MILLION)
- TABLE 23. MEXICO HEAT METERS MARKET, BY CONNECTIVITY, 2022-2032 ($MILLION)
- TABLE 24. MEXICO HEAT METERS MARKET, BY APPLICATION, 2022-2032 ($MILLION)
- TABLE 25. EUROPE HEAT METERS MARKET, BY TYPE, 2022-2032 ($MILLION)
- TABLE 26. EUROPE HEAT METERS MARKET, BY CONNECTIVITY, 2022-2032 ($MILLION)
- TABLE 27. EUROPE HEAT METERS MARKET, BY APPLICATION, 2022-2032 ($MILLION)
- TABLE 28. EUROPE HEAT METERS MARKET, BY COUNTRY, 2022-2032 ($MILLION)
- TABLE 29. GERMANY HEAT METERS MARKET, BY TYPE, 2022-2032 ($MILLION)
- TABLE 30. GERMANY HEAT METERS MARKET, BY CONNECTIVITY, 2022-2032 ($MILLION)
- TABLE 31. GERMANY HEAT METERS MARKET, BY APPLICATION, 2022-2032 ($MILLION)
- TABLE 32. FRANCE HEAT METERS MARKET, BY TYPE, 2022-2032 ($MILLION)
- TABLE 33. FRANCE HEAT METERS MARKET, BY CONNECTIVITY, 2022-2032 ($MILLION)
- TABLE 34. FRANCE HEAT METERS MARKET, BY APPLICATION, 2022-2032 ($MILLION)
- TABLE 35. ITALY HEAT METERS MARKET, BY TYPE, 2022-2032 ($MILLION)
- TABLE 36. ITALY HEAT METERS MARKET, BY CONNECTIVITY, 2022-2032 ($MILLION)
- TABLE 37. ITALY HEAT METERS MARKET, BY APPLICATION, 2022-2032 ($MILLION)
- TABLE 38. SPAIN HEAT METERS MARKET, BY TYPE, 2022-2032 ($MILLION)
- TABLE 39. SPAIN HEAT METERS MARKET, BY CONNECTIVITY, 2022-2032 ($MILLION)
- TABLE 40. SPAIN HEAT METERS MARKET, BY APPLICATION, 2022-2032 ($MILLION)
- TABLE 41. UK HEAT METERS MARKET, BY TYPE, 2022-2032 ($MILLION)
- TABLE 42. UK HEAT METERS MARKET, BY CONNECTIVITY, 2022-2032 ($MILLION)
- TABLE 43. UK HEAT METERS MARKET, BY APPLICATION, 2022-2032 ($MILLION)
- TABLE 44. REST OF EUROPE HEAT METERS MARKET, BY TYPE, 2022-2032 ($MILLION)
- TABLE 45. REST OF EUROPE HEAT METERS MARKET, BY CONNECTIVITY, 2022-2032 ($MILLION)
- TABLE 46. REST OF EUROPE HEAT METERS MARKET, BY APPLICATION, 2022-2032 ($MILLION)
- TABLE 47. ASIA-PACIFIC HEAT METERS MARKET, BY TYPE, 2022-2032 ($MILLION)
- TABLE 48. ASIA-PACIFIC HEAT METERS MARKET, BY CONNECTIVITY, 2022-2032 ($MILLION)
- TABLE 49. ASIA-PACIFIC HEAT METERS MARKET, BY APPLICATION, 2022-2032 ($MILLION)
- TABLE 50. ASIA-PACIFIC HEAT METERS MARKET, BY COUNTRY, 2022-2032 ($MILLION)
- TABLE 51. CHINA HEAT METERS MARKET, BY TYPE, 2022-2032 ($MILLION)
- TABLE 52. CHINA HEAT METERS MARKET, BY CONNECTIVITY, 2022-2032 ($MILLION)
- TABLE 53. CHINA HEAT METERS MARKET, BY APPLICATION, 2022-2032 ($MILLION)
- TABLE 54. JAPAN HEAT METERS MARKET, BY TYPE, 2022-2032 ($MILLION)
- TABLE 55. JAPAN HEAT METERS MARKET, BY CONNECTIVITY, 2022-2032 ($MILLION)
- TABLE 56. JAPAN HEAT METERS MARKET, BY APPLICATION, 2022-2032 ($MILLION)
- TABLE 57. INDIA HEAT METERS MARKET, BY TYPE, 2022-2032 ($MILLION)
- TABLE 58. INDIA HEAT METERS MARKET, BY CONNECTIVITY, 2022-2032 ($MILLION)
- TABLE 59. INDIA HEAT METERS MARKET, BY APPLICATION, 2022-2032 ($MILLION)
- TABLE 60. SOUTH KOREA HEAT METERS MARKET, BY TYPE, 2022-2032 ($MILLION)
- TABLE 61. SOUTH KOREA HEAT METERS MARKET, BY CONNECTIVITY, 2022-2032 ($MILLION)
- TABLE 62. SOUTH KOREA HEAT METERS MARKET, BY APPLICATION, 2022-2032 ($MILLION)
- TABLE 63. AUSTRALIA HEAT METERS MARKET, BY TYPE, 2022-2032 ($MILLION)
- TABLE 64. AUSTRALIA HEAT METERS MARKET, BY CONNECTIVITY, 2022-2032 ($MILLION)
- TABLE 65. AUSTRALIA HEAT METERS MARKET, BY APPLICATION, 2022-2032 ($MILLION)
- TABLE 66. REST OF ASIA-PACIFIC HEAT METERS MARKET, BY TYPE, 2022-2032 ($MILLION)
- TABLE 67. REST OF ASIA-PACIFIC HEAT METERS MARKET, BY CONNECTIVITY, 2022-2032 ($MILLION)
- TABLE 68. REST OF ASIA-PACIFIC HEAT METERS MARKET, BY APPLICATION, 2022-2032 ($MILLION)
- TABLE 69. LAMEA HEAT METERS MARKET, BY TYPE, 2022-2032 ($MILLION)
- TABLE 70. LAMEA HEAT METERS MARKET, BY CONNECTIVITY, 2022-2032 ($MILLION)
- TABLE 71. LAMEA HEAT METERS MARKET, BY APPLICATION, 2022-2032 ($MILLION)
- TABLE 72. LAMEA HEAT METERS MARKET, BY COUNTRY, 2022-2032 ($MILLION)
- TABLE 73. BRAZIL HEAT METERS MARKET, BY TYPE, 2022-2032 ($MILLION)
- TABLE 74. BRAZIL HEAT METERS MARKET, BY CONNECTIVITY, 2022-2032 ($MILLION)
- TABLE 75. BRAZIL HEAT METERS MARKET, BY APPLICATION, 2022-2032 ($MILLION)
- TABLE 76. SOUTH AFRICA HEAT METERS MARKET, BY TYPE, 2022-2032 ($MILLION)
- TABLE 77. SOUTH AFRICA HEAT METERS MARKET, BY CONNECTIVITY, 2022-2032 ($MILLION)
- TABLE 78. SOUTH AFRICA HEAT METERS MARKET, BY APPLICATION, 2022-2032 ($MILLION)
- TABLE 79. SAUDI ARABIA HEAT METERS MARKET, BY TYPE, 2022-2032 ($MILLION)
- TABLE 80. SAUDI ARABIA HEAT METERS MARKET, BY CONNECTIVITY, 2022-2032 ($MILLION)
- TABLE 81. SAUDI ARABIA HEAT METERS MARKET, BY APPLICATION, 2022-2032 ($MILLION)
- TABLE 82. REST OF LAMEA HEAT METERS MARKET, BY TYPE, 2022-2032 ($MILLION)
- TABLE 83. REST OF LAMEA HEAT METERS MARKET, BY CONNECTIVITY, 2022-2032 ($MILLION)
- TABLE 84. REST OF LAMEA HEAT METERS MARKET, BY APPLICATION, 2022-2032 ($MILLION)
- TABLE 85. DANFOSS A/S: KEY EXECUTIVES
- TABLE 86. DANFOSS A/S: COMPANY SNAPSHOT
- TABLE 87. DANFOSS A/S: PRODUCT SEGMENTS
- TABLE 88. DANFOSS A/S: PRODUCT PORTFOLIO
- TABLE 89. DIEHL STIFTUNG & CO. KG: KEY EXECUTIVES
- TABLE 90. DIEHL STIFTUNG & CO. KG: COMPANY SNAPSHOT
- TABLE 91. DIEHL STIFTUNG & CO. KG: PRODUCT SEGMENTS
- TABLE 92. DIEHL STIFTUNG & CO. KG: PRODUCT PORTFOLIO
- TABLE 93. DIEHL STIFTUNG & CO. KG: KEY STRATERGIES
- TABLE 94. HONEYWELL INTERNATIONAL INC.: KEY EXECUTIVES
- TABLE 95. HONEYWELL INTERNATIONAL INC.: COMPANY SNAPSHOT
- TABLE 96. HONEYWELL INTERNATIONAL INC.: PRODUCT SEGMENTS
- TABLE 97. HONEYWELL INTERNATIONAL INC.: PRODUCT PORTFOLIO
- TABLE 98. ISTA ENERGY SOLUTIONS LIMITED: KEY EXECUTIVES
- TABLE 99. ISTA ENERGY SOLUTIONS LIMITED: COMPANY SNAPSHOT
- TABLE 100. ISTA ENERGY SOLUTIONS LIMITED: PRODUCT SEGMENTS
- TABLE 101. ISTA ENERGY SOLUTIONS LIMITED: PRODUCT PORTFOLIO
- TABLE 102. KAMSTRUP: KEY EXECUTIVES
- TABLE 103. KAMSTRUP: COMPANY SNAPSHOT
- TABLE 104. KAMSTRUP: PRODUCT SEGMENTS
- TABLE 105. KAMSTRUP: PRODUCT PORTFOLIO
- TABLE 106. LANDIS+GYR GROUP AG: KEY EXECUTIVES
- TABLE 107. LANDIS+GYR GROUP AG: COMPANY SNAPSHOT
- TABLE 108. LANDIS+GYR GROUP AG: PRODUCT SEGMENTS
- TABLE 109. LANDIS+GYR GROUP AG: PRODUCT PORTFOLIO
- TABLE 110. LANDIS+GYR GROUP AG: KEY STRATERGIES
- TABLE 111. QUNDIS GMBH: KEY EXECUTIVES
- TABLE 112. QUNDIS GMBH: COMPANY SNAPSHOT
- TABLE 113. QUNDIS GMBH: PRODUCT SEGMENTS
- TABLE 114. QUNDIS GMBH: PRODUCT PORTFOLIO
- TABLE 115. SENSUS: KEY EXECUTIVES
- TABLE 116. SENSUS: COMPANY SNAPSHOT
- TABLE 117. SENSUS: PRODUCT SEGMENTS
- TABLE 118. SENSUS: PRODUCT PORTFOLIO
- TABLE 119. SENSUS: KEY STRATERGIES
- TABLE 120. SIEMENS AG: KEY EXECUTIVES
- TABLE 121. SIEMENS AG: COMPANY SNAPSHOT
- TABLE 122. SIEMENS AG: PRODUCT SEGMENTS
- TABLE 123. SIEMENS AG: PRODUCT PORTFOLIO
- TABLE 124. SONTEX SA: KEY EXECUTIVES
- TABLE 125. SONTEX SA: COMPANY SNAPSHOT
- TABLE 126. SONTEX SA: PRODUCT SEGMENTS
- TABLE 127. SONTEX SA: PRODUCT PORTFOLIO
LIST OF FIGURES
- FIGURE 01. HEAT METERS MARKET, 2022-2032
- FIGURE 02. SEGMENTATION OF HEAT METERS MARKET,2022-2032
- FIGURE 03. TOP IMPACTING FACTORS IN HEAT METERS MARKET (2022 TO 2032)
- FIGURE 04. TOP INVESTMENT POCKETS IN HEAT METERS MARKET (2023-2032)
- FIGURE 05. MODERATE BARGAINING POWER OF SUPPLIERS
- FIGURE 06. HIGH THREAT OF NEW ENTRANTS
- FIGURE 07. MODERATE THREAT OF SUBSTITUTES
- FIGURE 08. MODERATE INTENSITY OF RIVALRY
- FIGURE 09. MODERATE BARGAINING POWER OF BUYERS
- FIGURE 10. GLOBAL HEAT METERS MARKET:DRIVERS, RESTRAINTS AND OPPORTUNITIES
- FIGURE 11. IMPACT OF KEY REGULATION: HEAT METERS MARKET
- FIGURE 12. PATENT ANALYSIS BY COMPANY
- FIGURE 13. PATENT ANALYSIS BY COUNTRY
- FIGURE 14. HEAT METERS MARKET, BY TYPE, 2022 AND 2032(%)
- FIGURE 15. COMPARATIVE SHARE ANALYSIS OF HEAT METERS MARKET FOR MECHANICAL, BY COUNTRY 2022 AND 2032(%)
- FIGURE 16. COMPARATIVE SHARE ANALYSIS OF HEAT METERS MARKET FOR STATIC, BY COUNTRY 2022 AND 2032(%)
- FIGURE 17. HEAT METERS MARKET, BY CONNECTIVITY, 2022 AND 2032(%)
- FIGURE 18. COMPARATIVE SHARE ANALYSIS OF HEAT METERS MARKET FOR WIRELESS, BY COUNTRY 2022 AND 2032(%)
- FIGURE 19. COMPARATIVE SHARE ANALYSIS OF HEAT METERS MARKET FOR WIRED, BY COUNTRY 2022 AND 2032(%)
- FIGURE 20. HEAT METERS MARKET, BY APPLICATION, 2022 AND 2032(%)
- FIGURE 21. COMPARATIVE SHARE ANALYSIS OF HEAT METERS MARKET FOR RESIDENTIAL, BY COUNTRY 2022 AND 2032(%)
- FIGURE 22. COMPARATIVE SHARE ANALYSIS OF HEAT METERS MARKET FOR COMMERCIAL, BY COUNTRY 2022 AND 2032(%)
- FIGURE 23. COMPARATIVE SHARE ANALYSIS OF HEAT METERS MARKET FOR INDUSTRIAL, BY COUNTRY 2022 AND 2032(%)
- FIGURE 24. HEAT METERS MARKET BY REGION, 2022 AND 2032(%)
- FIGURE 25. U.S. HEAT METERS MARKET, 2022-2032 ($MILLION)
- FIGURE 26. CANADA HEAT METERS MARKET, 2022-2032 ($MILLION)
- FIGURE 27. MEXICO HEAT METERS MARKET, 2022-2032 ($MILLION)
- FIGURE 28. GERMANY HEAT METERS MARKET, 2022-2032 ($MILLION)
- FIGURE 29. FRANCE HEAT METERS MARKET, 2022-2032 ($MILLION)
- FIGURE 30. ITALY HEAT METERS MARKET, 2022-2032 ($MILLION)
- FIGURE 31. SPAIN HEAT METERS MARKET, 2022-2032 ($MILLION)
- FIGURE 32. UK HEAT METERS MARKET, 2022-2032 ($MILLION)
- FIGURE 33. REST OF EUROPE HEAT METERS MARKET, 2022-2032 ($MILLION)
- FIGURE 34. CHINA HEAT METERS MARKET, 2022-2032 ($MILLION)
- FIGURE 35. JAPAN HEAT METERS MARKET, 2022-2032 ($MILLION)
- FIGURE 36. INDIA HEAT METERS MARKET, 2022-2032 ($MILLION)
- FIGURE 37. SOUTH KOREA HEAT METERS MARKET, 2022-2032 ($MILLION)
- FIGURE 38. AUSTRALIA HEAT METERS MARKET, 2022-2032 ($MILLION)
- FIGURE 39. REST OF ASIA-PACIFIC HEAT METERS MARKET, 2022-2032 ($MILLION)
- FIGURE 40. BRAZIL HEAT METERS MARKET, 2022-2032 ($MILLION)
- FIGURE 41. SOUTH AFRICA HEAT METERS MARKET, 2022-2032 ($MILLION)
- FIGURE 42. SAUDI ARABIA HEAT METERS MARKET, 2022-2032 ($MILLION)
- FIGURE 43. REST OF LAMEA HEAT METERS MARKET, 2022-2032 ($MILLION)
- FIGURE 44. TOP WINNING STRATEGIES, BY YEAR (2020-2022)
- FIGURE 45. TOP WINNING STRATEGIES, BY DEVELOPMENT (2020-2022)
- FIGURE 46. TOP WINNING STRATEGIES, BY COMPANY (2020-2022)
- FIGURE 47. PRODUCT MAPPING OF TOP 10 PLAYERS
- FIGURE 48. COMPETITIVE DASHBOARD
- FIGURE 49. COMPETITIVE HEATMAP: HEAT METERS MARKET
- FIGURE 50. TOP PLAYER POSITIONING, 2022
- FIGURE 51. DANFOSS A/S: NET REVENUE, 2020-2022 ($MILLION)
- FIGURE 52. DANFOSS A/S: RESEARCH & DEVELOPMENT EXPENDITURE, 2020-2022 ($MILLION)
- FIGURE 53. DANFOSS A/S: REVENUE SHARE BY SEGMENT, 2022 (%)
- FIGURE 54. DANFOSS A/S: REVENUE SHARE BY REGION, 2022 (%)
- FIGURE 55. DIEHL STIFTUNG & CO. KG: RESEARCH & DEVELOPMENT EXPENDITURE, 2020-2022 ($MILLION)
- FIGURE 56. DIEHL STIFTUNG & CO. KG: NET SALES, 2020-2022 ($MILLION)
- FIGURE 57. DIEHL STIFTUNG & CO. KG: REVENUE SHARE BY SEGMENT, 2022 (%)
- FIGURE 58. DIEHL STIFTUNG & CO. KG: REVENUE SHARE BY REGION, 2022 (%)
- FIGURE 59. HONEYWELL INTERNATIONAL INC.: NET REVENUE, 2020-2022 ($MILLION)
- FIGURE 60. HONEYWELL INTERNATIONAL INC.: RESEARCH & DEVELOPMENT EXPENDITURE, 2020-2022 ($MILLION)
- FIGURE 61. HONEYWELL INTERNATIONAL INC.: REVENUE SHARE BY SEGMENT, 2022 (%)
- FIGURE 62. HONEYWELL INTERNATIONAL INC.: REVENUE SHARE BY REGION, 2022 (%)
- FIGURE 63. LANDIS+GYR: NET REVENUE, 2020-2022 ($MILLION)
- FIGURE 64. LANDIS+GYR: RESEARCH & DEVELOPMENT EXPENDITURE, 2020-2022 ($MILLION)
- FIGURE 65. SIEMENS AG: NET REVENUE, 2020-2022 ($MILLION)
- FIGURE 66. SIEMENS AG: RESEARCH & DEVELOPMENT EXPENDITURE, 2020-2022 ($MILLION)
- FIGURE 67. SIEMENS AG: REVENUE SHARE BY SEGMENT, 2022 (%)
- FIGURE 68. SIEMENS AG: REVENUE SHARE BY REGION, 2022 (%)

